STRUCTURE LINE DETECTION FROM LIDAR POINT CLOUDS USING
TOPOLOGICAL ELEVATION ANALYSIS
C. Y. Lo a *, L. C. Chen b
a
Department of Civil Engineering, National Central University, Taiwan - [email protected]
bCenter for Space and Remote Sensing, National Central University, Taiwan - [email protected]
Commission III, WG III/2
KEYWORDS: Detection, Automation, Analysis, Point cloud, LIDAR, Building, Model
ABSTRACT:
Airborne LIDAR point clouds, which have considerable points on object surfaces, are essential to building modeling. In the last two decades, studies have developed different approaches to identify structure lines using two main approaches, data-driven and model-driven. These studies have shown that automatic modeling processes depend on certain considerations, such as used thresholds, initial value, designed formulas, and predefined cues. Following the development of laser scanning systems, scanning rates have increased and can provide point clouds with higher point density. Therefore, this study proposes using topological elevation analysis (TEA) to detect structure lines instead of threshold-dependent concepts and predefined constraints. This analysis contains two parts: data pre-processing and structure line detection. To preserve the original elevation information, a pseudo-grid for generating digital surface models is produced during the first part. The highest point in each grid is set as the elevation value, and its original three-dimensional position is preserved. In the second part, using TEA, the structure lines are identified based on the topology of local elevation changes in two directions. Because structure lines can contain certain geometric properties, their locations have small relieves in the radial direction and steep elevation changes in the circular direction. Following the proposed approach, TEA can be used to determine 3D line information without selecting thresholds. For validation, the TEA results are compared with those of the region growing approach. The results indicate that the proposed method can produce structure lines using dense point clouds.
* Corresponding author
1. INTRODUCTION
Three-dimensional building modeling is essential for various applications, such as 3D visualization, urban planning, geo-database updating, and decision support. Key components including corners, edges, and planes can be used to delineate the building geometry. Therefore, feature detection is the highest priority for building procedures using aerial imagery, LIDAR point clouds, and integration strategies. Among these data sources, aerial imagery provides the spatial information with spectral features. Conversely, LIDAR data shows the building geometries with point cloud distribution. Following the development of lidargrammetry, an airborne LIDAR system can provide more point clouds to illustrate the relief of ground surfaces. From a building modeling perspective, laser scanning systems can provide more points with substantial accuracy and high point density, facilitating the improvement of automatic modeling processes. However, the LIDAR system is a blind device that cannot directly identify specific objects or features (Ackermann, 1999). Because irregular point distribution is the main aspect, analyzing point cloud distribution according to building geometry, with either explicit constraints (model-driven approach) or implicit constraints (data-(model-driven approach), is necessary.
To estimate building geometry using point clouds, the model-driven approach employs predefined model primitives. Maas and Vosselman (1999) fitted point clouds to identify the basic primitives and their model parameters from invariant moments. Point clouds can also be integrated with vector maps for building modeling (Vosselman and Dijkman, 2001). If the
building boundaries are well known, the processes partition the collected points according to their fit with the designed primitives. A dormer on the roof can also be successfully segmented using this scheme. However, these designed primitives restrict the capability under considered building geometries.
To overcome the limitation of the model-driven approach, the data-driven approach is used to directly analyze the point cloud distribution and estimate building geometries. Many studies have employed various strategies including the Hough transform, RANdom sample consensus (RANSAC) (Fischler and Bolles, 1981), binary space partitioning (BSP) (Sohn and Dowman, 2007), knowledge-based criteria (Pu and Vosselman, 2009), the octree-based split-and-merge segmentation algorithm (Wang and Tseng, 2010), TIN-merging and reshaping (TMR) (Rau and Lin, 2011), and the level set method (Kim and Shan, 2011). According to literature, segmentation approaches can be employed to manage unorganized point clouds for modeling. The differences of local patches were analyzed under several criteria including normal vectors, elevation differences, shapes, or mathematical weighting functions. Then, coplanar points were clustered together to fit the surface and calculate the structure lines through intersecting surfaces. Nevertheless, these threshold-dependent approaches developed building surfaces by adjusting the thresholds for different cases. The problematic issues may contain the starting position of segmentation processes, iterative procedures, and threshold determination. Therefore, threshold modification and post-processing have become necessary steps.
Based on the geometric characteristics of a building’s roof, LIDAR points located at the building boundaries have greater elevation differences. Additionally, these boundary points have explicit permutations that follow the roof shape. For this spatial phenomenon, this study proposes using topological elevation analysis (TEA) to identify the structure lines instead of threshold selection. This topological analysis concept was originally developed to detect edges for grayscale images (Lo and Chen, 2011). TEA then extends their concepts to manage point clouds.
Because the analyses of spatial relation between each point may need mass computation, many previous studies indicate that to convert point clouds into grid format can enhance speed for detection process (Cho et al., 2004). However, the traditional rasterization may disturb elevations due to interpolation processes. To avoid information loss, Cho et al. (2004) proposed a pseudo-grid concept to assign the original elevation to each grid from raw data without interpolation. The grid spacing can be calculated from the average point density of LIDAR data. Based on this merit of pseudo-grid, TEA implements two steps to hierarchically handle point clouds for structure line detection. In the first step, TEA generates pseudo-grid digital surface models (PDSMs) using the highest point of each grid. Topological permutations of the elevation differences are then analyzed to identify local extrema for grid-based line detection and produce an index map. According to this index map, the second step employs point clouds to calculate three-dimensional structure lines. For evaluation, the preliminary results are compared with those of the octree-based split-and-merge segmentation algorithm (Wang and Tseng, 2010) to assess the relative accuracy and evaluate the applicability of the proposed method.
2. METHODOLOGY
To identify three-dimensional structure lines using point clouds, the topological relationship between each point must be first established. Considering the characteristics of local relief, this study proposes three major concepts: (a) possible locations of structure lines may contain significant elevation differences in the circular direction and small elevation differences in the radial direction; (b) one structure line can be formed by several basic elements in a three-by-three area; and (c) the basic elements may have specific permutations. Figure 1 shows the three-step workflow developed based on the proposed concepts, that is, (1) pseudo-grid generation, (2) structure line detection, and (3) line formation. In the proposed scheme, TEA used two thresholds to identify grid-based lines including the grid spacing and the minimum elevation difference. The grid spacing can be derived from the average point density. The elevation constraint for estimation of minimum height jump is regarded as a constant in the processes.
Figure 1. Workflow
2.1 Pseudo-grid rasterization
Because the laser scanning system blind detects the geometry of objects with dense point clouds, the resulting data lacks information of the correlations between each point. In addition, the point density is associated with the computation. Greater point density can delineate detailed information, but it also increases the computation required. To resolve this issue, this study generates a PDSM to preserve the original elevation information. TEA is employed instead of mathematical interpolation to compare the point elevations and identify the highest elevation in each grid. After pseudo-grid generation, the PDSM provides the original elevation information for further elevation analysis.
2.2 Structure line detection
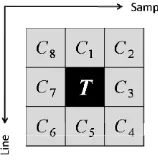
During the second step, topological permutations of the elevation differences are estimated for line detection. Local elevation distribution is considered to identify the structure line positions without threshold selection. Following the major concepts, the generated unit of TEA is shown in Figure 2. According to the characteristics of linear geometry, the elevation differences in the circular direction may exceed the differences in the radial direction for each grid (Figure 3) (Lo and Chen, 2011). To formulize this phenomenon, TEA employs two equations to represent the two-direction analyses.
8
where RCi is the elevation differences in the radial direction,
and CCi is the elevation differences in the circular direction.
Figure 2. Kernel illustration
(a) (b) Figure 3. Gradient directions
(a) Circular direction; (b) Radial direction
After calculating the elevation differences, TEA obtains two elevation differences series in both directions ((4) and (5)).
1, 2, ,
1~8' RC RC RCn n
RC (4)
1, 2, ,
1~8' CC CC CCn n
CC (5)
where RC’ is the elevation differences set in the radial direction of the basic unit, and CC’ is the elevation differences set in the circular direction of the basic unit. In TEA concepts, structural lines exist where two-direction gradients intersect. Detected candidates are then identified using the intersections between the minimum radial elevation differences and the maximum circular elevation differences. In the radial direction analysis, the first set of candidates are extracted when RCn closes to the
RCmin. The circular direction analysis then extracts possible
edge grids from these candidates when CCn is larger than CCn-1
and CCn+1. The following process compares these collected
candidates with designed patterns.
The concept of topological permutations is also used to identify structure lines. In this step, 12 patterns are designed to delineate the parts of one line, which are compared with designed patterns to identify the line grids. These designed patterns are shown in Fig. 4. The gray parts indicate the topological condition surrounding the nucleus. If the candidate fulfills one pattern, TEA determines the candidate to be a part of a structure line. Therefore, non-matched candidates can be considered isolated noises and removed.
Figure 4. Designed patterns
2.3 3D Line Formation
After the detection process, the identified structure lines are formed using several adjacent grids. During the subsequent process, the Hough transform is employed to group independent straight line segments and calculate the parameters of every structure line. To preserve the original elevation information,
the grids serve as index maps to obtain the original point clouds of each selected grid and calculate the linear parameters.
3. EXPERIMENTAL RESULTS
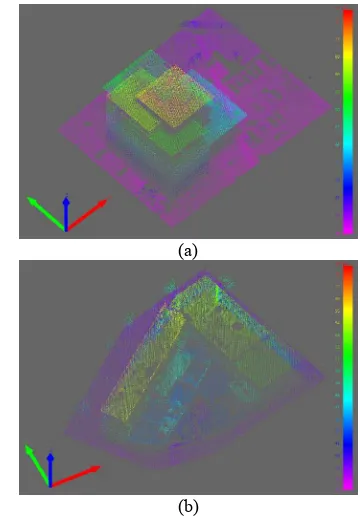
The test area was located in Van Heekplein, the Netherlands. Two target buildings were selected to evaluate the detection ability of the proposed scheme. The first building had several flat roofs with multiple elevations, whereas the second building contained a parapet on the rooftop. The LIDAR data used in this study was scanned by a FLIMAP system in 2007. The point density reached 30 points per square meters. Figure 5 shows the distributions of the original point clouds for both buildings. Because the original point spacing was approximately 20 cm, a higher value was used to generate a PDSM during the rasterization procedure. The spatial resolution used in this study is 25 cm. The elevation constraint is set as 0.5 m. This value is a constant for the identification of minimum parapet height.
(a)
(b)
Figure 5. Test datasets for (a) Case I and (b) Case II (Unit: m)
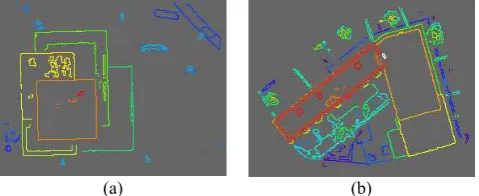
The PDSM results of the detection process are shown in Figure 6. In the figure, color-coded boundary pixels denote the elevation. During vectorization, the Hough transform was applied with TEA to separate the detected edges into several independent structure lines (Figure 7). Then, each group of line pixels can be used to calculate the linear coefficients. Figures 8 and 9 show the three-dimensional structure lines developed in this study.
(a) (b)
Figure 6. The detected PDSM structure lines for (a) Case I and (b) Case II
(a) (b)
Figure 7. The PDSM structure line segments for (a) Case I and (b) Case II
(a) (b)
Figure 8. The 3D structure lines for Case I in (a) the first view and (b) the second view
(a) (b)
Figure 9. The 3D structure lines for Case II in (a) the first view and (b) the second view
This study also used octree-based segmentation (Wang and Tseng, 2010) to compare and evaluate the capabilities of TEA. The same point clouds were employed to derive coplanar points.
The segmented surface points are shown in Figure 10 and are used in the planar equation to calculate the coefficients. The used thresholds contain the initial grid size, split distance, merge distance, and minimum point numbers of each patch. These values are manually optimized for the line computation. The computed structure lines were then obtained from the intersected planes. Finally, the position differences were compared to calculate the root-mean-square errors (RMSEs) of the three axes. The comparison results are shown in Table 1.
(a)
(b)
Figure 10. The octree-based segmentation results for (a) Case I and (b) Case II
Unit: m RMSE-X RMSE-Y RMSE-Z
Case I 0.354 0.331 0.406
Case II 0.351 0.340 0.468
Table 1. Comparison results of relative accuracy
4. CONCLUSIONS
This study proposed a method that employs TEA to identify three-dimensional structure lines. The two criteria of this method are the grid spacing and elevation difference, which were set as 0.25m and 0.5 m. Note that the grid spacing can be computed from the used LIDAR data. This value is lightly larger than the average point density. The independent structure lines were identified and compared with the results of the octree-based split-and-merge segmentation algorithm. The RMSEs of the two cases show that the differences between the three axes reached 0.35 m, 0.34 m, and 0.46 m. Case II had a greater elevation difference, which may be because of the parapet on the rooftop. The height of the parapet was 1.0 m. International Archives of the Photogrammetry, Remote Sensing and Spatial Information Sciences, Volume XXXIX-B3, 2012
These preliminary results indicate that the proposed scheme can be used to obtain structure lines without threshold selection that include the segmentation results.
Future works will focus on the improvement of TEA for corners and the development of further applications. The evaluation will be also enhanced to compare with manually edited models obtained from stereo aerial imagery. In the photogrammetric perspective, these detected three-dimensional structure lines can provide initial building information for the development of data registration and building reconstruction.
5. ACKNOWLEDGEMENT
This study was partially supported by the National Science Council, Taiwan, under project number 99-2221-E-008-079-MY3. The FLIMAP LIDAR data was kindly provided by the faculty of ITC, University of Twente, the Netherlands. The octree-based split-and-merge segmentation algorithm was developed by Professor Tseng and Dr. Wang at the National Cheng Kung University, Taiwan.
References
Ackermann, F., 1999. Airborne laser scanning—present status and future expectations. ISPRS Journal of Photogrammetry and Remote Sensing, 54, pp. 64–67.
Cho, W., Jwa, Y.S., Chang, H.J., and Lee, S.H., 2004. Pseudo-grid based building extraction using airborne lidar data. In: International Archives of the Photogrammetry and Remote Sensing, Istanbul, Turkey, Vol. XXXV, Part B3, pp. 378-383. Fischler, M.A., and Bolles, R.C., 1981. Random sample consensus: a paradigm for model fitting with applications to image analysis and automated cartography. Communications of the ACM, 24(6), pp. 381–395.
Kim, K.H., and Shan J., 2011. Building roof modeling from airborne laser scanning data based on level set approach. ISPRS
Journal of Photogrammetry and Remote Sensing, 66, pp. 484–
497.
Lo, C.Y., and Chen, L.C., 2011. Building Boundary Detection Using Topological Gradient Analysis. Proceedings of the 32th Asian Conference on Remote Sensing, Oct. 3-7, Taipei, Taiwan, CD-ROM.
Maas, H.G., and Vosselman, G., 1999. Two algorithms for extracting building models from raw laser altimetry data. ISPRS
Journal of Photogrammetry and Remote Sensing, 54, pp. 153–
163.
Pu, S., and Vosselman, G., 2009. Knowledge based reconstruction of building models from terrestrial laser scanning data. ISPRS Journal of Photogrammetry and Remote Sensing, 64, pp. 575-584.
Rau, J.Y., and Lin, B.C., 2011. Automatic roof model reconstruction from ALS data and 2D ground plans based on side projection and the TMR algorithm. ISPRS Journal of
Photogrammetry and Remote Sensing, 66, pp. S13–S27.
Sohn, G., and Dowman, I., 2007. Data fusion of high-resolution satellite imagery and LiDAR data for automatic building extraction. ISPRS Journal of Photogrammetry and Remote Sensing, 62, pp. 43–63.
Vosselman, G., and Dijkman, S, 2001. 3D building model reconstruction from point clouds and ground plans. In: International Archives of the Photogrammetry and Remote
Sensing, Annapolis, MA, USA, Vol. XXXIV, 3/W4, pp. 37–44,.
Wang, M., and Tseng, Y.-H., 2010. Incremental segmentation of lidar pointclouds with an octree-structured voxelspace. The Photogrammetric Record, 26(133), pp. 32-57.