DEFORMATION MONITORING OF MOTORWAY UNDERPASSES USING LASER
SCANNING DATA
I. Puente a, H. González-Jorge a,*, B. Riveiro a, P. Arias a a
Close Range Remote Sensing and Photogrammetry Group, School of Mining Engineering, University of Vigo
[email protected]
Commission VI, WG V/3
KEY WORDS: laser scanning, civil engineering, accuracy, deformation monitoring, point cloud
ABSTRACT:
The motorway Ourense - Celanova will become the next years in one of the main roads of inland Galicia (northwest region of Spain) that will connect quickly with the cities of Northern Portugal. This highway is projected as a public – private partnership between the regional government of Xunta de Galicia and the construction companies Copasa SA and Extraco SA. There are currently under construction the 19 km of this road and presents a number of structures as viaducts, overpasses and underpasses. The viaducts are part of the main road, allowing passage of the vehicles at conventional speed. Overpasses are mainly used in the connection of the highway with secondary roads. Moreover, the underpasses are better suited for the passage of wildlife animals, persons or agricultural machinery.
The underpass arch-shape structures used for this project consist of two reinforced concrete voussoirs placed on two small concrete walls. For each set of voussoirs there are three joining points, two between the walls and the voussoirs and one between the both voussoirs at the top of the structure. These underpasses suffer significant mechanical stress during construction, because during the backfilling process asymmetric loads are applied to both sides. Thus, it is very important the monitoring of the structure using geodetic techniques as total stations, levels or laser scanners
The underpass selected for this study is located at the kilometric point 4.9 of the highway, with a total length of 50.38 m, maximum span of 13.30 m and rise of 7.23 m. Voussoirs has a thickness of 0.35 m and a length of 2.52 m. The small lateral walls exhibit a height of 2.35 m and thickness of 0.85 m. The underpass presents a slope of approximately 4 % and the maximum height of the backfill over the top of the structure is 3.80 m. The foundation consists of a concrete slab arch-shape (curvature opposite the main arch) with a thickness of 0.7 m.
The geodetic technology used for the deformation monitoring is a Optech Lynx mobile LiDAR. This laser scanner is based on time of flight technology and presents an accuracy of 6 mm in the determination of the geometrical coordinates. This accuracy can be improved to around 1 mm using fitting post-processing techniques and makes this technology very useful for studies related with deformation monitoring. The laser scanner, in comparison with other geodetic techniques as total stations, allows the control of all the structure, including unexpected deformations. Reflective targets are permanently positioned over the small walls of the structure to allow the 3D orientation of the different scans.
Two main scans are made for this study, before and after the backfilling process. Backfilling takes about 10 days for the construction companies. The scans need a time of approximately 12 minutes. Construction works do not need to be interrupted during the scans. Point clouds are then post-processed using QT Modeler Software. First, the point cloud is cleaned to use only the data directly related with the structure under study. Then, using the target coordinates, both point clouds are moved to the same coordinate system. Finally, the deformation of the underpass is studied using two algorithms specifically developed using Matlab software.
First algorithm fits a geometrical surface to the point cloud of the first scan and evaluates the residuals of both scans for this fitting surface. Differences in the residuals give the deformation map of the structure. Second algorithm takes a portion of the point cloud from the top of the structure, where it is located the joining point between the voussoirs. The joining between two voussoirs shows a height step that in an ideal case must tend to zero. Deformations produced by the loading of the structure are measured as a comparison between the steps before and after the backfilling process. The analysis of the results show as some deformation occurs in the structure in the joining point of the voussoirs ranging between 1 mm and 5 mm. These deformations are under the tolerances predicted by the structure and confirm the success in the construction works developed. The laser scanning and the post-processing algorithms here developed appear as an easy methodology to make deformation monitoring of underpass structures and guarantee the load capacity of the structure.
* Corresponding author.
International Archives of the Photogrammetry, Remote Sensing and Spatial Information Sciences, Volume XXXIX-B5, 2012 XXII ISPRS Congress, 25 August – 01 September 2012, Melbourne, Australia
1. INTRODUCTION
Spain has, since the mid-eigthties and with the assistance of European funds, undertaken a significant drive to overcome its deficiencies in transport infrastructures. From the end of the eighties and until the mid-nineties it was, with Germany, in first place in the European Union in the percentage of GDP allocated to investment in transport infrastructures.
From the threshold of 0.5 – 0.6 % of GDP in the mid-eighties it has reached values of around 1.7 – 1.8 % of GDP in recent years, with deviations strongly linked to the economic cycle. As a result, investment in transport infrastructures in Spain is today twice the European Union average.
The existing structural road system on the Spanish mainland comprises the 24.797 km (2005 statistics) of the State Motorway Network, of which 8.700 km (35 %) are dual carriageways (6.698 km) and toll motorways (1.951 km). It must also be remembered that this structuring mainland network also includes about another 2.500 km of the Autonomous Communities’ system of dual carriageways and motorways. Galician roads Network includes 5.066 km (2010 statistics), including high capacity and conventional roads.
The motorway Ourense - Celanova will become the next years in one of the main roads of inland Galicia that will connect quickly the city of Ourense with the cities of Northern Portugal (Braga, Guimaraes and Oporto). This highway is projected as a public – private partnership between the regional government of Galicia and the construction companies Copasa SA and Extraco SA. There are currently under construction the 19 km of this road and presents a number of structures as viaducts, overpasses and underpasses. The viaducts are part of the main road, allowing passage of the vehicles at conventional speed. Overpasses are mainly used in the connection of the highway with secondary roads. Moreover, the underpasses are better suited for the passage of wildlife animals, persons or agricultural machinery.
Road underpasses are typically monitored using geodetic measuring methods. Geodetic measuring methods use total stations, levels and static LiDAR (González-Jorge, 2011). Although these techniques appear accurate and reliable, their productivity is low and the labour costs associated are very important. In the recent years, mobile LiDAR applications have irrupted in the market (Graham, 2010; Petri, 2010). These systems combine DGPS positioning and LiDAR measuring. In addition, in the areas with poor satellite coverage, GPS is aided with inertial navigation systems and distance measuring indicators. The combination of DGPS, INS and DMI data is done in post-processing using Kalman filtering algorithms (Leung 2011). Mobile LiDAR systems combine DGPS and LiDAR technology with RGB cameras to provide images of the scenes.
The productivity of mobile LiDAR systems is very high and they allow to measure between 100 – 200 km per journey with a team of two surveyors (one driver and one LiDAR technician). Typically one day more is necessary to post-processing all the information and to obtain a geo-referenced point cloud and images.
Mobile LiDAR systems are commonly installed in cars or vans, although they can also be arranged in boats or trains. The information generated is completely compatible with that obtained from airborne LiDAR or conventional surveying.
One of the main application fields of mobile LiDAR is in road inspections. They provide a complete geo-referenced point cloud of the road that can be used to analyze geometrical parameters (i.e. vertical and horizontal clearance, slope geometry, tunnel profiles, road sections). This work shows a semi-automatic procedure to determinate the geometric deformations between the voussoirs of a selected underpass that occur after the backfilling process.
2. MATERIAL AND METHODS
2.1 Area of study
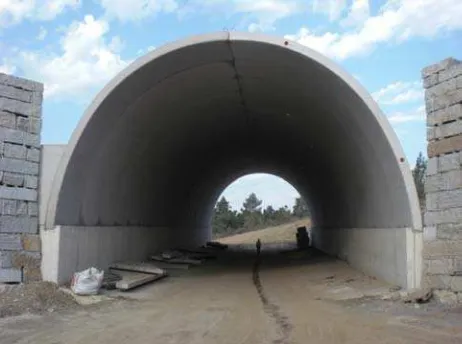
The underpass selected for this study is located at the kilometric point 4.9 of the highway, with a total length of 50.38 m, maximum span of 13.30 m and rise of 7.23 m (Figure 1). Voussoirs has a thickness of 0.35 m and a length of 2.52 m. The small lateral walls exhibit a height of 2.35 m and thickness of 0.85 m. The underpass presents a slope of approximately 4 % and the maximum height of the backfill over the top of the structure is 3.80 m. The foundation consists of a concrete slab arch-shape (curvature opposite the main arch) with a thickness of 0.7 m.
Figure 1. Underpass of Ourense – Celanova motorway (before backfilling process)
2.2 Mobile LiDAR and data acquisition
Mobile LiDAR used in this study (Figure 2) is the Optech Lynx system. The system integrates a navigation GPS/INS system from Applanix (POS 520 - 2 GPS antenna), 2 LiDAR scanners from Optech and 4 digital cameras from Jai (BB 500GE). The metric characteristics of the Lynx system are shown below:
- Maximun range: 200 m
International Archives of the Photogrammetry, Remote Sensing and Spatial Information Sciences, Volume XXXIX-B5, 2012 XXII ISPRS Congress, 25 August – 01 September 2012, Melbourne, Australia
Figure 2. Mobile LiDAR Optech Lynx.
Mobile LiDAR survey began and finished with the acquisition of 5 min of GPS data in an area with small PDOP (high GPS precision). The complete time of the survey was 12 min. Scanner and photographic data are only taken while the van is moving to avoid the excess of data. The synchronization of the data from the different sensors of the mobile unit is achieved using the time stamp and the PPS of the GPS/INS system. A total of 124 million of geometric points were acquired during the survey. The survey was repeated one week after the backfilling process was completed.
The data processing is performed using Applanix POSPac and Dashmap software. The first one corrects the GPS information using a RINEX file from a base station. In addition, combines, using a Kalman filter, the data from the GPS with those obtained from the inertial navigation system (INS) and distance measurement indicator (DMI). The corrected trajectory file exhibits a precision higher than 2 cm in X Y and higher than 4 cm in Z.
Dashmap combines the range and angle information obtained from the Optech scanners with the trajectory information from PosPAC. The point cloud obtained will be managed using the QT Modeler software in addition to Matlab and AutoCAD software.
3. RESULTS AND DISCUSSION
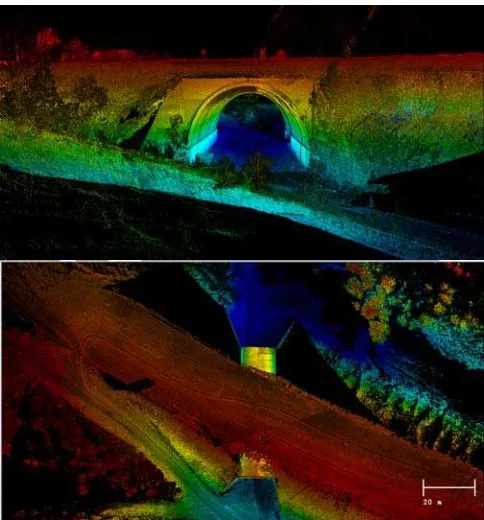
Figure 3 shows geo-referenced point cloud images (front and top views). Data were texturized using height colours. The scanner show high resolution and precision which makes the technique available to detect deformations in civil engineering structures. This system is nowadays the most powerful in the market for survey applications.
Figure 4 depicts the underpass structure after the filtering of the backfill. This process was done using QT Modeler software. Data were textured using intensity.
Figure 3. Geo-referenced point clouds of the underpass and the backfill (front and top view).
Figure 4. Geo-referenced point cloud of the underpass after filtering the backfill.
Once the underpass is cropped the data were imported in Matlab to apply the different algorithms developed in this work for the evaluation of geometrical deformations (Figure 5). Matlab algorithms automatically extract profiles from the point cloud to evaluate different movements between the voussoirs of the underpass structure at the joining points (Figure 6).
Figure 5. Point cloud loaded in Matlab software.
International Archives of the Photogrammetry, Remote Sensing and Spatial Information Sciences, Volume XXXIX-B5, 2012 XXII ISPRS Congress, 25 August – 01 September 2012, Melbourne, Australia
Figure 6. Scheme of transversal (blue) and longitudinal (red) profiles extracted from the point cloud to evaluate the geometric deformations.
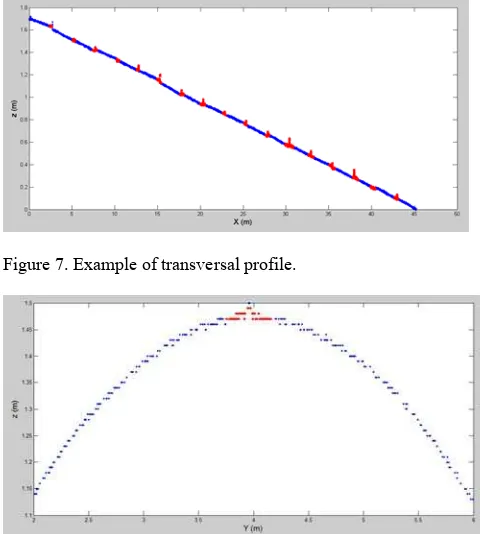
Figure 7 exhibits the results of a transversal profile. The joining points between the voussoirs are red highlighted. The maximum deformation founded is 5 mm. Figure 8 exhibits the analogous longitudinal profile. In this case, deformations are undetectable.
Figure 7. Example of transversal profile.
Figure 8. Example of longitudinal profile. The joining point of the two voussoirs is red highlighted.
4. CONCLUSIONS
Mobile LiDAR seems to be a technology highly productive and accurate to make geometric inspections on civil engineering structures. The longest part of the process is related to data processing that would seem of great interest to investigate the
development of algorithms for automated processing of the information.
The case of study based on the auscultation of an underpass structure show that small movements occur between the voussoirs (maximum of 5 mm), although in all cases are under the tolerances recommended by the designers of the structure.
Acknowledgements
This work was made with the financial support of the Spanish Ministry of Science and Innovation (Grant No. BIA2009-08012), the Spanish Centre for Technological and Industrial Development (Grant No. IDI-20101770) and Xunta de Galicia (IPP055 – EXP44).
References
Jorge, H., Rodríguez-Gonzalvez, P., González-Aguilera, D., Arias, P., 2011. Metrological comparison of terrestrial laser scanning systems Riegl LMS Z390i and Trimble GX. Optical Engineering, 50(11), pp. 116201 – 116208, 2011.
Graham, L., 2010. Mobile mapping systems overview. Photogrammetric Engineering, 76(3), pp. 222-228.
Petri, G., 2010. Mobile mapping systems: An introduction to the technology. Geoinformatics, 13(1), pp. 32 – 43.
Tim Leung, K., Whidborne, J. F., Purdy, D., Dunoyer, A., 2011. A review of ground vehicle dynamic state estimations utilizing GPS/INS, Vehicle system dynamics, 49 (1-2), pp. 29 – 58.
International Archives of the Photogrammetry, Remote Sensing and Spatial Information Sciences, Volume XXXIX-B5, 2012 XXII ISPRS Congress, 25 August – 01 September 2012, Melbourne, Australia