ELEMENTAL AND TOPOGRAPHIC MAPPING OF LAVA FLOW STRUCTURES IN
MARE SERENITATIS ON THE MOON
C. W¨ohlera,∗, A. Grumpea, D. Rommela, M. Bhattb, U. Mallc
a
Image Analysis Group, TU Dortmund University, D44227 Dortmund, Germany -(christian.woehler, arne.grumpe, daniela.rommel)@tu-dortmund.de
bSpace Physics Laboratory, Vikram Sarabhai Space Centre, Thiruvananthapuram, 695022, India - [email protected] c
Max-Planck-Institut f¨ur Sonnensystemforschung, Justus-von-Liebig-Weg 3, 37077 G¨ottingen, Germany - [email protected]
Commission III, ICWG III/II
KEY WORDS:Topographic mapping, Elemental mapping, Moon, Mare Serenitatis, Lava flow structure
ABSTRACT:
The detection of lunar lava flows based on local morphology highly depends on the available images. The thickness of lava flows, however, has been studied by many researchers and lunar lava flows are shown to be as thick as 200 m. Lunar lava flows are supposed to be concentrated on the northwestern lunar nearside. In this study we present elemental abundance maps, a petrological map and a digital terrain model (DTM) of a lava flow structure in northern Mare Serenitatis at (18.0◦E, 32.4◦N) and two possible volcanic
vents at (11.2◦E, 24.6◦N) and (13.5◦E, 37.5◦N), respectively. Our abundance maps of the refractory elements Ca, Mg and our
petrological map were obtained based on hyperspectral image data of the Moon Mineralogy Mapper (M3) instrument. Our DTM was constructed using GLD100 data in combination with a shape from shading based method to M3and Lunar Reconnaissance Orbiter (LRO) Narrow Angle Camera (NAC) image data. The obtained NAC-based DEM has a very high effective resolution of about 1-2 m which comes close to the resolution of the utilized NAC images without requiring intricate processing of NAC stereo image pairs. As revealed by our elemental maps and DEM, the examined lava flow structure occurs on a boundary between basalts consisting of low-Ca/high-Mg pyroxene and high-Ca/low-Mg pyroxene, respectively. The total thickness of the lava flow is about 100 m, which is a relatively large value, but according to our DEM the lava flow may also be composed of two or more layers.
1. INTRODUCTION
The detection of lunar lava flows based on local morphology highly depends on the available images (Hiesinger et al., 2002). The thickness of lava flows, however, has been studied by many researchers and lunar lava flows are shown to be as thick as 200 m (e.g. Hiesinger et al., 2002; Gifford and El-Baz, 1981; Neukum and Horn, 1976). Lunar lava flows are supposed to be concen-trated on the northwestern lunar nearside (Gifford and El-Baz, 1981). Neither Hiesinger et al. (2002) nor Gifford and El-Baz (1981) found lunar lava flows in Mare Serenitatis.
The detection of lava flows is not at simple task since they are thin structures that do not show a strong shading signature unless the incidence angle of the solar rays is quite large. Hiesinger et al. (2002) presented a method to detect lava flows and estimate the lave flow thickness using crater-size frequency distributions.
In this study we apply a digital terrain model (DTM) refinement method to very high resolution Lunar Reconnaissance Orbiter (LRO) Narrow Angle Camera (NAC) (Chin et al., 2007) images and a the GLD100 DTM (Scholten et al., 2012) of lower reso-lution to compute high resoreso-lution DTMs of a lava flow in Mare Serenitatis. The same technique is applied to two possible vol-canic vents. Additionally, elemental abundance maps, and a petro-logical map of the lava flow structure in northern Mare Serenitatis at (18.0 E, 32.7 N) are computed based on hyperspectral image data of the Moon Mineralogy Mapper (M) instrument (Pieters et al., 2009).
∗Corresponding author
2. METHODS
In order to construct elemental and topographic maps of lava flow structures in the Mare Serenitatis region of the moon, we use sev-eral different techniques. This sections briefly reviews the meth-ods applied in this study.
2.1 Construction of elemental abundance maps
In order to construct elemental abundance maps, we extract the M3level-1B radiance data of the region of interest (ROI). The M3 data is resampled to a resolution of 300 pixels per degree which corresponds to about 101 m per pixel at the lunar equator.
emis-sion spectrum of the surface. The spectral reflectance is inferred from the spectral radiance data by division by the solar irradiance.
The refined DTM is used to infer the local surface temperature using the thermal equilibrium method described in W¨ohler et al. (2017). This method iteratively infers the local surface tempera-ture and the local spectral emissivity. Furthermore, we apply the correction for surface roughness of 9◦root-mean-squared slope
of W¨ohler et al. (2017), i.e. the temperature is modified to an effective temperature of a single black body. The emission spec-trum of the black body is the weighted by the inferred spectral emissivity and subtracted from the measured M3 spectral radi-ance. The thermally corrected spectral radiance is then divided by the solar irradiance yielding the spectral reflectance.
Based on the inferred spectral reflectance and the refined DTM, we compute the spectral single-scattering albedo at full lateral resolution. Inserting the inferred single-scattering albedo and the standard illumination geometry of 30◦incidence angle, 0◦
emis-sion angle, and 30◦phase angle (Pieters, 1999) into the Hapke
model yields normalized spectral reflectance values.
The spectral parameters of W¨ohler et al. (2014) are inferred from the normalized spectral reflectance inserted into the regression model of Bhatt et al. (2015) mapping the spectral parameters onto Lunar Prospector Gamma-Ray Spectrometer (LP GRS) (Lawrence et al., 1998) data. This technique yields elemental abundance maps at the lateral resolution of M3data.
2.2 Refinement of digital terrain models
In this study, we combine the methods of Grumpe et al. (2014) and Grumpe and W¨ohler (2014) by simultaneously minimizing
ESfS=EI(p, q) +γEint(p, q,∂z ∂x,
∂z ∂y)
+δEgrad(p, q) +τ EabsDepth(z) (1)
with respect to p, q, andz. Following the approach of Horn (1990), we use the variablespandqto denote the photometrically estimated partial derivatives ∂z∂xand ∂y∂z, respectively, of the sur-face modelz, i.e. the inclination of the surface as inferred from the imageI is not directly related to the surface modelz. The termEI describes the integral over the squared intensity devia-tion between the measured spectral reflectance and the modeled spectral reflectance based on the surface inclination given byp andq. This term represents the shading information in the image (Horn, 1990). Sincepandqare subject to measurement noise, a surface modelzis searched that has a gradient field which is similar to the gradient field given bypandq. This integral over the squared norm of the gradient vectors[∂z
∂x, ∂z
∂y]and[p, q]is the integrability errorEintwhich relates the surface modelzto the shading information (Horn, 1990). To increase the stability and reduce systematic errors, Grumpe et al. (2014) introduced the gradient errorEgrad which measures the squared deviation of the photometrically inferred gradient fieldpand qfrom the partial derivatives ∂zDTM
∂x and ∂zDTM
∂y after applying a low-pass filter to each variable, respectively. This error term introduces a soft constraint on the photometrically inferred gradient field. The low-pass filter is introduced to allow small-scale deviations, since the constraining DTMzDTMis supposed to be of lower lateral resolution. Similarly, Grumpe and W¨ohler (2014) intro-ducedEabsDepthwhich is the integral over the squared deviation betweenzandzDTMafter applying the low-pass filter tozand zDTM, respectively. The factorsγ = 10−2, δ = 10−2, and
Figure 1: Petrographic map of Mare Serenitatis. The petro-graphic map is based on the Fe and Mg content of the surface following three endmember model of Berezhnoy et al. (2005). The three endmembers are used to create a color composite (Red: basaltic material, Green: Mg-rich rock, Blue: feldspathic mate-rial). The three regions considered in this study are shown as white rectangles. Black denotes missing data.
τ = 102
are arbitrary weights. Following the strategy of Horn (1990), we alternate between updating the photometric surface gradient field estimatepandqand the refined DTMz.
In order to apply this method to the Lunar Reconnaissance Or-biter Narrow Angle Camera (LROC NAC), we first us the USGS Integrated Software for Imagers and Spectrometers to construct map-projected reflectance images of 1-2 m per pixel resolution. The LROC NAC images are then cropped to the region of inter-est. Since the GLD100 DTM has a nominal lateral resolution of 100 m per pixel, we downscale the LROC NAC images by a fac-tor of26
to match the resolution of the GLD100 DTM. Based on this low-resolution LROC NAC image, a refined DTM is com-puted. The obtained refined DTM is upscaled by a factor of 2 and a corresponding downscaled LROC NAC image is used to com-pute a further refined DTM. This procedure is repeated until the full LROC NAC resolution is reached.
3. RESULTS AND DISCUSSION
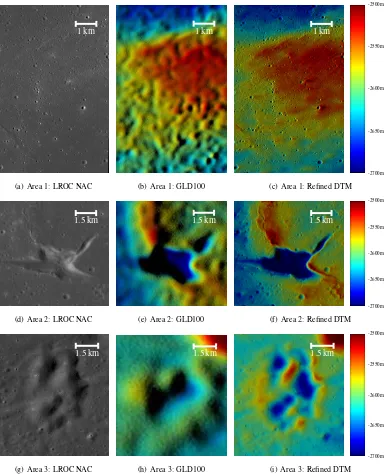
three interesting structures in Mare Serenitatis that were shown in LROC NAC images. The three areas are indicated in Fig. 1. They are captured by the LROC NAC images M181052395LE / RE, M104447576LE / RE, and M1108188835LE / RE, respec-tively. Area 1, Area 2 and Area 3 are centered at (18.0◦E, 32.4◦
N), (11.2◦E, 24.6◦ N), and (13.5◦ E, 37.5◦N), respectively.
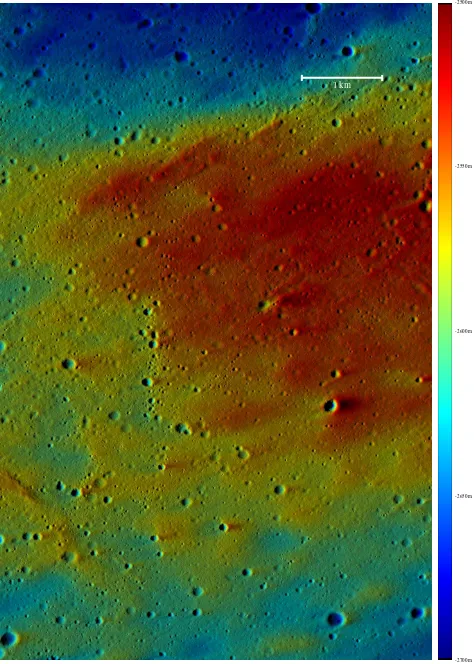
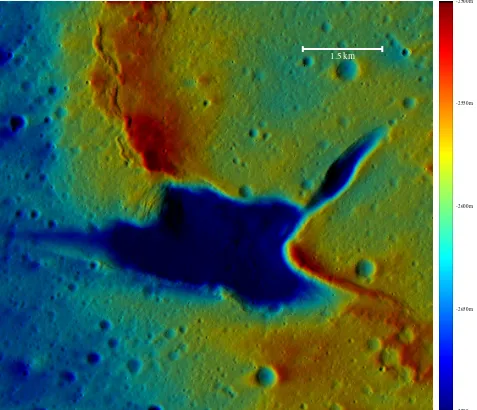
The LROC NAC images, the GLD100 data and our refined DTMs are shown in Fig. 2. The first area clearly shows a lava flow while the other two areas show possibly volcanic vents. In all cases, the refined DTMs show the same large-scale trends as the GLD100 DTM. However, the spatial resolution is strongly improved. Even small craters are visible within the refined DTMs and all struc-tures occurring in the image may be detected in the refined DTM. Fig. 3–5 show enlarged versions of Fig. 2(c), Fig. 2(f), and Fig. 2(i), respectively. These enlarged versions show that many of the details may not be displayed using the smaller images. The lava flow is found to have a thickness of about 100 m which is a rela-tively large value (Hiesinger et al., 2002). The refined DTM sug-gests that the lava flow consists of at least two layers. The irreg-ularly shaped depression in Area 2 shows a depth of 150–200 m while the possible volcanic vents in Area 3 show an average depth of 100 m.
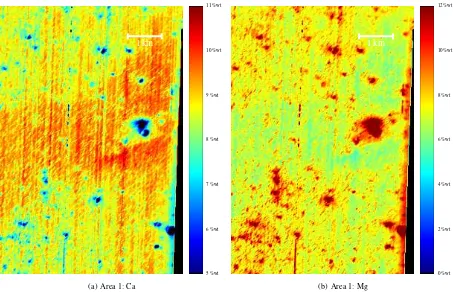
While the volcanic vents are smaller than 3 km in extent, the lava flow extends by more than 5 km. Consequently, the volcanic vents are barely visible in the M3 data. The derived elemental abundance maps of Ca and Mg of the lava flow in Area 1 are shown in Fig. 6. All other elements did not show differences be-tween the lava flow and the surrounding region. The lava flow clearly shows an increased amount of Ca while the Mg content is decreased, corresponding to a composition richer in clinopyrox-ene than the basalt to the north and south. The strong Ca depletion and Mg increase occurring at small fresh craters is an artifact of the method resulting from their low optical maturity.
4. SUMMARY AND CONCLUSION
In this study, we showed a method to refine DTMs of low lateral resolution, e.g. the GLD100 DTM, using high resolution images, e.g. LROC NAC images. The method produces DTMs of lateral resolution close to the image resolution. All image details can be detected also in the DTM while the low resolution DTM effec-tively regularizes the trend and thus prevents systematic errors. The possibly volcanic vents do not show exceptional elemental compositions while the lava flow exhibits an increase of the Ca and a decrease of the Mg content, corresponding to a composi-tion richer in clinopyroxene than the basalts north and south of the lava flow.
ACKNOWLEDGEMENTS
This research has made use of the USGS Integrated Software for Imagers and Spectrometers (ISIS).
References
Berezhnoy, A. A., Hasebe, N., Kobayashi, M., Michael, G. G., Okudaira, O. and Yamashita, N., 2005. A three end-member model for petrologic analysis of lunar prospector gamma-ray spectrometer data. Planetary and Space Science 53, pp. 1097–1108.
Bhatt, M., Mall, U., W¨ohler, C., Grumpe, A. and Bugiolacchi, R., 2015. A comparative study of iron abundance estimation
methods: Application to the western nearside of the Moon.
Icarus248, pp. 72–88.
Chin, G., Brylow, S., Foote, M., Garvin, J., Kasper, J., Keller, J., Litvak, M., Mitrofanov, I., Paige, D., Raney, K., Robin-son, M., Sanin, A., Smith, D., Spence, H., Spudis, P., Stern, S. A. and Zuber, M., 2007. Lunar Reconnaissance Orbiter Overview: TheInstrument Suite and Mission. Space Science Reviews129(4), pp. 391–419.
Gifford, A. W. and El-Baz, F., 1981. hicknesses of lunar mare flow fronts.The moon and the planets24(4), pp. 391–398.
Grumpe, A. and W¨ohler, C., 2014. Recovery of elevation from estimated gradient fields constrained by digital elevation maps of lower lateral resolution. ISPRS Journal of Photogrammetry and Remote Sensing94, pp. 37–54.
Grumpe, A., Belkhir, F. and W¨ohler, C., 2014. Construction of lu-nar DEMs based on reflectance modelling.Advances in Space Research53(12), pp. 1735–1767.
Grumpe, A., Zirin, V. and W¨ohler, C., 2015. A normalisation framework for (hyper-)spectral imagery.Planetary and Space Science111, pp. 1–33.
Hapke, B., 1984. Bidirectional reflectance spectroscopy: 3. Cor-rection for macroscopic roughness.Icarus59(1), pp. 41–59.
Hapke, B., 2002. Bidirectional reflectance spectroscopy: 5. The Coherent Backscatter Opposition Effect and Anisotropic Scat-tering.Icarus157(2), pp. 523–534.
Hapke, B., 2012. Theory of Reflectance and Emittance Spec-troscopy. 2nd edn, Cambridge University Press, Cambridge, UK.
Hiesinger, H., Head III, J. W., Wolf, U., Jaumann, R. and Neukum, G., 2002. Lunar mare basalt flow units: Thicknesses determined from crater size-frequency distributions. Geophys-ical Research Letters29(8), pp. 89–1–89–4.
Horn, B. K. P., 1990. Height and Gradient from Shading. Inter-national Journal of Computer Vision5(1), pp. 37–75.
Lawrence, D. J., Feldman, W. C., Barraclough, B. L., Binder, A. B., Elphic, R. C., Maurice, S. and Thomsen, D. R., 1998. Global Elemental Maps of the Moon: The Lunar Prospector Gamma-Ray Spectrometer.Science281, pp. 1484–1489.
Neukum, G. and Horn, P., 1976. Effects of lava flows on lunar crater populations.The moon15(3), pp. 205–222.
Pieters, C. M., 1999. The Moon as a Spectral Calibration Stan-dard Enabled by Lunar Samples: The Clementine Example. In:Workshop on New Views of the Moon II: Understanding the Moon Through the Integration of Diverse Datasets, Flagstaff, Arizona, p. #8025.
Pieters, C. M., Boardman, J., Buratti, B., Chatterjee, A., Clark, R., Glavich, T., Green, R., Head III, J., Isaacson, P., Malaret, E., McCord, T., Mustard, J., Petro, N., Runyon, C., Staid, M., Sunshine, J., Taylor, L., Tompkins, S., Varanasi, P. and White, M., 2009. The Moon Mineralogy Mapper (M3) on Chandrayaan-1.Current Science96(4), pp. 500–505.
Scholten, F., Oberst, J., Matz, K.-D., Roatsch, T., W¨ahlisch, M., Speyerer, E. J. and Robinson, M. S., 2012. GLD100: The near-global lunar 100 m raster DTM from LROC WAC stereo image data.Journal of Geophysical Research.
1 km
(a) Area 1: LROC NAC
1 km
(b) Area 1: GLD100
1 km
-2700 m -2650 m -2600 m -2550 m -2500 m
(c) Area 1: Refined DTM
1.5 km
(d) Area 2: LROC NAC
1.5 km
(e) Area 2: GLD100
1.5 km
-2700 m -2650 m -2600 m -2550 m -2500 m
(f) Area 2: Refined DTM
1.5 km
(g) Area 3: LROC NAC
1.5 km
(h) Area 3: GLD100
1.5 km
-2700 m -2650 m -2600 m -2550 m -2500 m
(i) Area 3: Refined DTM
1 km
-2700 m -2650 m -2600 m -2550 m -2500 m
1.5 km
-2700 m -2650 m -2600 m -2550 m -2500 m
1.5 km
-2700 m -2650 m -2600 m -2550 m -2500 m
1 km
5 %wt 6 %wt 7 %wt 8 %wt 9 %wt 10 %wt 11 %wt
(a) Area 1: Ca
1 km
0 %wt 2 %wt 4 %wt 6 %wt 8 %wt 10 %wt 12 %wt
(b) Area 1: Mg
Figure 6: Elemental abundance maps of Area 1. The lava flow shows (a) an enrichment in Ca and (b) a depletion in Mg. Black denotes missing data.
W¨ohler, C., Grumpe, A., Berezhnoy, A. A., Feoktistova, E. A., Evdokimova, N. A., Kapoor, K. and Shevchenko, V. V., 2017. Temperature regime and water/hydroxyl behavior in the crater Boguslawsky on the Moon.Icarus285, pp. 118–136.
W¨ohler, C., Grumpe, A., Berezhnoy, A., Bhatt, M. U. and Mall, U., 2014. Integrated topographic and spectral analysis of the lunar surface: Application to impact melt flows and ponds.