PERFORMANCE COMPARISON OF EVOLUTIONARY ALGORITHMS FOR IMAGE
CLUSTERING
P. Civicioglua,∗
, U.H. Ataseverb, C. Ozkanb, E. Besdokb, A. E. Karkinlib, A. Kesikoglub
a
Erciyes University, College of Aviation, Dept. of Aircraft Electrics and Electronics, Kayseri, Turkey - [email protected] b Erciyes University, Dept. of Geomatic Eng., Kayseri, Turkey, (uhatasever, cozkan, ebesdok, aekarkinli, akesikoglu)@erciyes.edu.tr
KEY WORDS:Evolutionary Algorithms, Backtracking Search Optimization Algorithm (BSA), Image Clustering.
ABSTRACT:
Evolutionary computation tools are able to process real valued numerical sets in order to extract suboptimal solution of designed problem. Data clustering algorithms have been intensively used for image segmentation in remote sensing applications. Despite of wide usage of evolutionary algorithms on data clustering, their clustering performances have been scarcely studied by using clustering validation indexes. In this paper, the recently proposed evolutionary algorithms (i.e., Artificial Bee Colony Algorithm (ABC), Grav-itational Search Algorithm (GSA), Cuckoo Search Algorithm (CS), Adaptive Differential Evolution Algorithm (JADE), Differential Search Algorithm (DSA) and Backtracking Search Optimization Algorithm (BSA)) and some classical image clustering techniques (i.e., k-means, fcm, som networks) have been used to cluster images and their performances have been compared by using four cluster-ing validation indexes. Experimental test results exposed that evolutionary algorithms give more reliable cluster-centers than classical clustering techniques, but their convergence time is quite long.
1. INTRODUCTION
Image clustering (Wang & Wang , 2009; Chen, et.all. , 2002; Halkidi et.all. , 2001) is a quite important unsupervised learning tool and it is one of the most intensively used image segmenta-tion operators. Image clustering is used for segmentasegmenta-tion of pix-els into groups according to predefined objective functions. Ob-jective functions are generally designed for minimizing cumula-tive distances between the pixels. One of the distance computing methods (e.g., euclidean distance, minkowski distance, manhat-tan dismanhat-tance, mahalanobis dismanhat-tance or derivatives of these) can be used, in order to compute the distances between pixels.
Clustering process involves seven basic steps: 1- Detection of optimum/suboptimum cluster numbers 2- Data selection 3- Data modeling 4- Setting objective function 5- Detection of clustering method 6- Computation process 7- Interpretation and validation.
Clustering methods can be classified into three groups as error-minimizing based methods, probability based methods and graph-based methods. There are lots of clustering methods introduced in the literature (Kasturi et.all. , 2003; Sharan et.all. , 2003; Shu et.all. , 2003) . The most intensively used methods are k-means, fuzzy-c means, isodata, decision-trees, mean-shift, hierarchical clustering, gaussian mixture-models, and unsupervised-artificial neural networks.
In the literature, there are some analytic methods proposed for the detection of optimum cluster number,kbut it is still a difficult problem. In this paper, Gap-Statistics and Calinski-Harabasz in-dexes have been used in order to detectk. Gap Method is based on statistical comparison of within-cluster dispersion of clustering results of an arbitrary clustering technique and estimated disper-sion of within-cluster pixels (Wang & Wang , 2009; Chen, et.all. , 2002; Halkidi et.all. , 2001; Kasturi et.all. , 2003; Sharan et.all. , 2003; Shu et.all. , 2003; Zhao and Karypis , 2005; Xu and Wun-sch , 2005; Halkidi et.al. , 2005).
In this paper, we have compared clustering performances of clas-sical methods (i.e., Fuzzy C-Means (FCM), K-means (K-Means),
∗Corresponding author.
Self Organizing Map (SOM) (Kohonen , 1982)) and metaheuris-tic algorithms (i.e., ABC, GSA, CS, JADE, DSA and BSA (Civi-cioglu , 2013a, 2012, 2013b; Civi(Civi-cioglu and Besdok , 2013)) over artificial and real images by using four clustering validation indexes, i.e., Davies-Bouldin, Silhouette, Dunn and R-Squared. The rest of the paper is organized as follows: Section 2 intro-duces Clustering Methods, Section 3 describes the Experiments, and Section 4 presents the Conclusions.
2. DATA CLUSTERING
In this section, classical data clustering methods and gap-statistics have been explained briefly.
2.1 k-Means Clustering
K-Means clustering method is the simplest and powerful unsu-pervised learning method used for data clustering. K-Means has been quite popular in pattern recognition and cluster analysis in data mining application. K-Means is based on the partition of the observed data, n, into k-clusters by minimizing the within-cluster sum of squares by using Eq. 1:
argmin
S k
∑
i=1
∑
xj∈Si
∥xj−µi∥2 (1)
2.2 Fuzzy C-Means Algorithm (FCM)
FCM is an unsupervised learning method which allows one piece of data to belong to two or more clusters. FCM is frequently used in pattern recognition, image segmentation and computer vision applications. FCM is based on minimization of function given in Eq. 2.
Jm=
N
∑
i=1
C
∑
j=1
umij∥xi−cj∥2|0≤uij≤1 (2)
The International Archives of the Photogrammetry, Remote Sensing and Spatial Information Sciences, Volume XL-7, 2014 ISPRS Technical Commission VII Symposium, 29 September – 2 October 2014, Istanbul, Turkey
This contribution has been peer-reviewed.
The cluster centers are calculated by using Eq.s 3- 4.
The partitioning process of FCM is finalized when the condition defined by Eq. 5 is realized.
max{
wherekshows the iteration number,ε∈[0 1]value is the thresh-old value used for finalizing the calculations.
2.3 Self Organizing Map Artificial Neural Network (SOM)
SOM is a competitive learning tool, whicht has been proposed for data clustering. SOM is an iterative unsupervised learning tool and it has been intensively used for pattern recognition and data clustering applications. SOM transforms the training data samples to topologically ordered maps. SOMs are analogically similar to the generalized principal component transform because of they required topographic map of the input patterns. At each training iteration,x-input is randomly selected and the distances betweenxand SOM vectors are recomputed. The winner unit is the vector closer toxas expressed by Eq. 6.
∥x−mwinner∥= min{∥x−mi∥} (6)
SOM vectors have to be updated by using Eq. 7.
mi(t+ 1) =mi(t) +α(t)·hbi(t)·(x−mi(t)) (7)
wheret,α(t), andhbi(t)denote time, adaptation coefficient and
winner-unit, respectively.
2.4 Gap-Statistics
There are some analytical methods proposed for detection of the optimal number of clusters such as Silhouette index, Davies-Bouldin index, Calinski-Harabasz index, Dunn index, C index, Krzanowski-Lai index, Hartigan index, weighted inter-intra index and Gap-Statistics. Gap-Statistics is quite sensitive to statistical properties of the data, therefore it is intensively used for analyzing of data clustering quality. The gap value is defined by using Eq. 8.
GAPn(k) =E
∗
n{log (Wk)} −log (Wk) (8)
where n and k denote simple size and the cluster number to be tested.Wkis defined by using Eq. 9;
Wk=
Carlo sampling based statistical method. The gap value is defined by using Eq. 10:
Gap(K)≥GAP M AX−SE(GAP M AX) (10)
where K is the number of clusters, Gap(K) is the gap value for the clustering solution with K clusters, GAPMAX is the largest gap value, and SE(GAPMAX) is the standard error corresponding to the largest gap value.
3. EVOLUTIONARY ALGORITHMS
In this section, some of the popular evolutionary algorithms, namely, ABC, GSA, CS, JADE, DSA and BSA (Civicioglu , 2013a, 2012, 2013b; Civicioglu and Besdok , 2013) have been explained briefly.
ABC (Artificial Bee Colony Algorithm) analogically simulates nectar source search behavior of honey-bees. It is a population-based evolutionary search algorithm that has two-phased search strategy. Its problem solving success for multimodal problems is limited because ABC’s search strategy is elitist. ABC has no crossover operator but has two control parameters. Its mutation strategy is rather similar to that of DE.
GSA (Gravitational Search Algorithm) is an evolutionary search algorithm, which has been inspired from the universal gravita-tional laws. Random solution of the problem is modeled as artificial-bodies that apply newtonian gravitational force to each other. Mass of an artificial-body and the quality of the solution that artificial-body provides for the problem are related with each other. When the quality of the solution is higher, the speed that artificial-body abandons that position gets slower due to the gravitation force applied to it by other artificial-bodies. In the search-space, the speed of the artificial-bodies with inferior quality of solution is higher. This allows GSA to efficiently search the search space for finding a solution of a problem.
CS (Cuckoo Search Algorithm) is a population based algorithm that has an elitist stochastic search strategy. CS tends to evolve each random solution towards to the best solution obtained be-forehand. CS has two control parameters. The structure of CS is similar to those of DE and ABC. However, it has an excellent problem solving success in comparison to ABC, DE and some DE variants.
JADE (Adaptive Differential Evolution Algorithm) has been de-veloped with a new mutation strategy (i.e., DE/current-to-pbest) to be used together with DE. In JADE, a randomly selected so-lution of the population is evolved by the mutation operator to-wards a random top-best solution of the population that provides the best solution at the moment. Compared with DE/current-to-best/1 and DE/DE/current-to-best/1 strategies that are used in standard DE al-gorithms, JADE can solve numerical optimization problems with much more success.
DSA (Differential Search Algorithm) is an advanced multi-strategy based evolutionary swarm- algorithm. DSA analogically simu-lates a superorganism migrating between two stopovers. DSA has only unique mutation and crossover operators. The struc-ture of mutation operator of DSA contains just one direction pat-tern apart from the target patpat-tern. Compared to the structures of crossover operators used in advanced DE algorithms, the struc-ture of crossover operator of DSA is very different from them.
The International Archives of the Photogrammetry, Remote Sensing and Spatial Information Sciences, Volume XL-7, 2014 ISPRS Technical Commission VII Symposium, 29 September – 2 October 2014, Istanbul, Turkey
This contribution has been peer-reviewed.
DSA has only two control parameters that are used for control-ling the degree to which the trial pattern will mutate in compari-son to the target pattern. For evolving towards stopovers that pro-vide a better fitness value, each trial pattern uses the correspond-ing target pattern. For obtaincorrespond-ing direction matrix, standard DSA has 4 different options: Bijective DSA (B-DSA), Surjective DSA (S-DSA), Elitist1 DSA (E1-DSA) and Elitist2 DSA (E2-DSA). In B- DSA, population evolves for each cycle into the randomly permuted form of the current population. In S-DSA, population evolves into artificial organisms in order to find relatively better solutions. In E1-DSA, population evolves into the randomly se-lected top-best solutions of the original population. In E2-DSA, population evolves into the better solution of the original popula-tion. In this paper, S-DSA and E2-DSA have been employed.
BSA (Backtracking Search Optimization Algorithm) has a sim-ple structure but it is a fast and effective algorithm that easily adapts to solving multimodal optimization problems. BSA can be considered as an advanced and modernized PSO. The local and global search abilities of BSA are very powerful and it has new strategies for crossover and mutation operations. BSA has a short-range memory in which it stores a population from a randomly chosen previous generation in generating the search-direction matrix. Thus, BSA has the advantage of using experi-ences gained from previous generations when it generates a new trial preparation.
Table 1 gives the initial values of the relevant control parameters of the ABC, GSA, CS, JADE, DSA and BSA.
Table 1: Control parameters of ABC, GSA, CS, JADE, DSA and BSA
AlgorithmInitial Values of Control Parameters
ABC limit=N·D
Size of EmployedBee= (Size ofColony)/2
GSA Rnorm= 2, Rpower= 1α= 20 , G0= 100
CS p= 0.25 , β= 1.5
JADE c= 0.1, p= 0.05,
CRm= 0.5, Fm= 0.5, Af actor= 1
DSA p1=p2= 0.30·κ|κ∼U[0,1], Surjective
BSA mixrate= 1
4. EXPERIMENTS
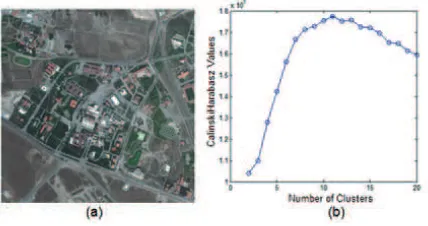
In the experiments, two [512x512] pixels sized test images with 8 bits/pixel radiometric resolution have been used. The first im-age is an artificial imim-age, which is illustrated in Fig. 1-(a). Gap-Statistics of the first test image have been graphically illustrated in Fig. 1-(b). According to gap-statistics of the first image, opti-mum cluster number has been found as 19. Hence, all the algo-rithms clustered the first test image into 19 clusters.
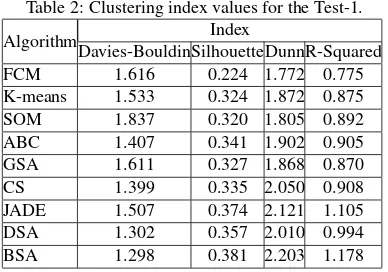
Statistical comparison results of the mentioned methods have been given in Table 2 for the first test image. We have used some of the well-known clustering validation indexes (i.e., Davies-Bouldin, Silhouette, Adjusted-Rand, and R-Squared) in order to evaluate the quality of the clustering success of the algorithms. All the evolutionary algorithms used the same objective function, which aims to maximize the silhouette index value. The analytical vali-dation of clustering results is also in data clustering analysis.
Clustering validity indices are intensively used in scientific com-munity in order to evaluate clustering results. The most inten-sively used indexes are silhouette index, davies-bouldin, calinski-harabasz, dunn index, R-squared index, hubert-levin (C-index),
krzanowski-lai index, hartigan index, root-mean-square standard deviation index, semi-partial R-squared (SPR) index, distance be-tween two clusters (CD) index, weighted inter-intra index, ho-mogeneity index, and Separation index. In this paper, we have used cvap toolbox in order to compute clustering indexes. All the simulations have been conducted by using Matlab running on a dual-core Xeon(R) CPU E5-2640 computer.
A low value of davies-bouldin index indicates that good cluster structures have been computed. A larger silhouette-index indi-cates that better quality of clustering results have been obtained. An adjusted-rand index with higher score indicates that better clustering results have been achieved. A large R-squared index value indicates that the difference between clusters is big. Be-cause of the huge computer-memory requirements for computa-tion of some indexes, mean-index values of 100 trials have been computed. At each trial, mean-clustering validation index values of 100 runs have been computed and results have been tabulated in Table 2. As it is seen from the Table 2, K-Means algorithm has obtained more successful clustering results within the clas-sical algorithms. Contrary to clasclas-sical algorithms, evolutionary algorithms, except GSA, have obtained more successful cluster-ing results than classical methods.
Figure 1: (a) Artificial Test Image, (b) Gap-Statistics of (a) (Op-timum cluster number is 19).
Table 2: Clustering index values for the Test-1.
Algorithm Index
Davies-BouldinSilhouetteDunnR-Squared
FCM 1.616 0.224 1.772 0.775
K-means 1.533 0.324 1.872 0.875
SOM 1.837 0.320 1.805 0.892
ABC 1.407 0.341 1.902 0.905
GSA 1.611 0.327 1.868 0.870
CS 1.399 0.335 2.050 0.908
JADE 1.507 0.374 2.121 1.105
DSA 1.302 0.357 2.010 0.994
BSA 1.298 0.381 2.203 1.178
In the second test, we have used a 8 bits/pixel real world image of [256x256] pixels size. Cluster indexes computed for the second test image have been tabulated in Table 3.
5. RESULTS AND CONCLUSIONS
In this paper, we have compared image clustering performances of some of the popular classical methods and evolutionary meth-ods. We have used clustering validation indexes in order to eval-uate clustering performances of the related methods. Experi-mental results exposed that k-means algorithm is the best clas-sical method for data clustering. Evolutionary algorithms, except GSA, give more successful clustering results when compared to
The International Archives of the Photogrammetry, Remote Sensing and Spatial Information Sciences, Volume XL-7, 2014 ISPRS Technical Commission VII Symposium, 29 September – 2 October 2014, Istanbul, Turkey
This contribution has been peer-reviewed.
Figure 2: (a) Real-World Test Image, (b) Calinski-Harabasz Statistics of (a) (Optimum cluster number is 11).
Table 3: Clustering index values for the Test-2.
Algorithm Index
Davies-BouldinSilhouetteDunnR-Squared
FCM 6.250 0.509 2.827 0.600
K-means 6.616 0.553 2.976 0.627
SOM 6.863 0.603 2.996 0.682
ABC 6.010 0.581 3.051 0.698
GSA 6.903 0.577 3.123 0.685
CS 5.788 0.592 3.205 0.701
JADE 5.601 0.607 3.194 0.699
DSA 5.402 0.598 3.208 0.706
BSA 5.587 0.620 3.121 0.732
the classical methods. We have used multi-runs for evolutionary algorithms, in order to avoid from affects of initial conditions of evolutionary algorithms. The best solution obtained by the re-lated evolutionary algorithms has been used in the tests. DSA and BSA supplied similar results in the tests. DSA, BSA and CS are detected as the most successful evolutionary algorithms in the tests. BSA is extremely robust and it converges to almost the same clustering results at each time. Despite of their cluster-ing success, uscluster-ing evolutionary algorithms for image clustercluster-ing is time consuming. Hence, we have obligated to use small-sized images, but hybridization of evolutionary algorithms with classi-cal methods (especially with k-means) gives quite useful results aspect of some clustering validation indexes.
ACKNOWLEDGEMENTS
This paper has been supported by TUBITAK-110Y309.
References
Wang, A., Wang, B.,Peng, L., 2009. CVAP: Validation for Cluster Analyses,Data Science Journal, 8, pp.88-93.
Chen, G., Jaradat, S.S., Banerjee, N., Tanaka, T.S., Ko, M.S.H., Zhang, M.Q. 2002.Evaluation and Comparison of Clustering Algorithms in Anglyzing ES Cell Gene Expression Data. Sta-tistica Sinica, 12, pp. 241–262.
Halkidi, M., Batistakis, Y., Vazirgiannis, M. 2001. On Clustering Validation Techniques.Intelligent Information Systems Jour-nal, 17(2-3), pp.107–145.
Kasturi, J., Acharya, R., Ramanathan, M. 2003. An information theoretic approach for analyzing temporal patterns of gene ex-pression.Bioinformatics, 19 (4), pp.449–458.
Sharan, R., Maron-Katz, A., Shamir, R. 2003. CLICK and EX-PANDER: A System for Clustering and Visualizing Gene Ex-pression Data.Bioinformatics19, pp. 1787-1799.
Shu, G., Zeng, B., Chen, Y.P., Smith, O.H. 2003. Performance as-sessment of kernel density clustering for gene expression pro-file data.Comparative and Functional Genomics, 4 (3), pp. 287-299.
Y. Zhao and G. Karypis. 2005. Data Clustering in Life Sciences. Molecular Biotechnology, 31(1), pp. 55–80.
Civicioglu, P., 2013a. Backtracking Search Optimization Algo-rithm for numerical optimization problems. Applied Mathe-matics and Computation, 219, pp.8121-8144.
Civicioglu, P., 2012. Transforming Geocentric Cartesian Coor-dinates to Geodetic CoorCoor-dinates by Using Differential Search Algorithm.Computers & Geosciences, 46, pp. 229-247.
Civicioglu, P., 2013b. Circular Antenna Array Design by Using Evolutionary Search Algorithms,Progress In Electromagnet-ics Research B,54, pp.265-284.
Xu, R, Wunsch, D. 2005. Survey of clustering algorithms.IEEE Transactions on Neural Networks. 16, pp.645-678.
Halkidi, M, Batistakis, Y, Vazirgiannis, M. 2005. On clustering validation techniques.Journal Of Intelligent Information Sys-tems, 17, pp. 107-145.
Civicioglu, P., Besdok, E. 2013. A conceptual comparison of the cuckoo-search, particle swarm optimization, differential evolu-tion and artificial bee colony algorithms,Artificial Intelligence Review, 39 (4), pp. 315-346.
Kohonen, T. 1982. Self-Organized Formation of Topologically Correct Feature Maps,Biological Cybernetics, 43 (1), pp. 59-69.
The International Archives of the Photogrammetry, Remote Sensing and Spatial Information Sciences, Volume XL-7, 2014 ISPRS Technical Commission VII Symposium, 29 September – 2 October 2014, Istanbul, Turkey
This contribution has been peer-reviewed.