Design of Laser Based Monitoring Systems for Compliance Management of Odorous and
Hazardous Air Pollutants in Selected Chemical Industrial Estates at Hyderabad, India
P. Sudhakar, P. Kalavathi, D. Ramakrishna Rao, M. Satyanarayana*
Department of Electronics and Communication Engineering,
Geethanjali College of Engineering & Technology, Cheeryal (V), Keesara (M), R.R (Dist)
Hyderabad – 501301 INDIA
*[email protected],
Contact No: +919387766248 Fax No: 04031001617
Keywords— Laser remote sensing; Hazardous air pollutants; Odorous compounds; Lidar; Differential Absorption Lidar; Raman lidar;
Abstract— Industrialization can no longer sustain without internalization of the concerns of the receiving environment and land-use. Increased awareness and public pressure, coupled with regulatory instruments and bodies exert constant pressure on industries to control their emissions to a level acceptable to the receiving environment. However, when a group of industries come-up together as an industrial estate, the cumulative impacts of all the industries together often challenges the expected/desired quality of receiving environment, requiring stringent pollution control and monitoring measures. Laser remote sensing techniques provide powerful tools for environmental monitoring. These methods provide range resolved measurements of concentrations of various gaseous pollutants and suspended particulate matter (SPM) not only in the path of the beam but over the entire area. A three dimensional mapping of the pollutants and their dispersal can be estimated using the laser remote sensing methods on a continuous basis. Laser Radar (Lidar) systems are the measurements technology used in the laser remote sensing methods. Differential absorption lidar (DIAL) and Raman Lidar technologies have proved to be very useful for remote sensing of air pollutants. DIAL and Raman lidar systems can be applied for range resolved measurements of molecules like SO2, NO2, O3 Hg, CO, C2H4, H2O, CH4, hydrocarbons etc. in real time on a continuous basis. This paper describes the design details of the DAIL and Raman lidar techniques for measurement of various hazardous air pollutants which are being released into the atmosphere by the chemical industries operating in the Bachupally industrial Estate area at Hyderabad, India. The relative merits of the two techniques have been studied and the minimum concentration of pollutants that can be measured using these systems are presented. A dispersion model of the air pollutants in the selected chemical industrial estates at Hyderabad has been developed.
I. INTRODUCTION
Light Detection and Ranging (LIDAR) makes use of the scattering/reflection characteristics of the target for the incident short wavelength and high directivity of the laser beam to image the objects with fine resolution. The LIDAR system, analogous to RADAR, transmits and receives the relatively short wavelength electromagnetic radiation in the optical and infrared spectral regions.
II. LIDAR METHODOLOGY
When designing a lidar system there are a number of key parameters that need to be optimized in order to maximize the effectiveness of the system. The key parameters are:
i) Laser pulse power
ii) Wavelength of the laser
iii) Laser Pulse Width
iv) Pulse repetition rate
v) Sensitivity of the detector(s) within the receiver
vi) Receiver collector aperture
Additional information on the atmospheric/meteorological parameters may also need to be considered while optimizing the system parameters.
Lidar systems are primarily governed by a simplified lidar equation describing the elastic backscattering or reflection from hard targets for the incident laser pulse of specified energy. The back scattered signal power P(ri ) from a height interval
r (= C t/2) centered at altitude ri is given
P(r1)= ² exp[-2 1 ] (1)
Where
E0 = Transmitted laser energy
C = Speed of light
t = Laser pulse width
R = Altitude
T = Optical efficiencies of transmitter and receiver optics
A = Effective area of the receiving telescope
(r1 )= Atmospheric volume back scatter coefficient at r1
= Atmospheric extinction coefficient
(r1 ) is given by
(r1 ) = na (r1 ) a + nm (r1 ) m (2)
Where a and m are the aerosol and molecular back scattering cross sections respectively and na and nm are the number densities of aerosols and air molecules respectively.
The International Archives of the Photogrammetry, Remote Sensing and Spatial Information Sciences, Volume XL-8, 2014 ISPRS Technical Commission VIII Symposium, 09 – 12 December 2014, Hyderabad, India
This contribution has been peer-reviewed.
Similarly is given by
(r1 ) = na (r1 ) a + nm (r1 ) m (3)
Where a and m are the extinction cross sections of aerosols and air molecules respectively.
Equation (1) contains two unknowns, namely and . Assuming a functional form of relationship between and the above equation can be solved for (or ). The DIAL technique consists of transmitting two different wavelengths: one( on) is a resonant with an absorption line of the species under investigation, and the other ( off ) is tuned to the line wing.
Using the appropriate relationship between and lidar observations of back scatter signals can be analyzed to obtain altitude profiles of aerosol extinction. By measuring the aerosol extinction at different wavelengths, it is possible to invert the size index of the particulate matter/aerosols using the above Mie lidar technique.
A DIAL system is similar to a LIDAR system except that the laser must be tunable. By analyzing the return signal with a fast digitizer (as in LIDAR) the radiation scattered back from any particular range along the beam can be measured. If we consider the size of the return signal at say 10µs after the firing of the laser we know that this must correspond to radiation which has travelled to a range of 1.5km (=c X 10-6 /2) and been scattered back. The size of this signal will thus depend, apart from fixed geometric factors, on the amount of backscattering at 1.5km range and on the absorption produced by the pollutant over the round trip to 1.5km back. The scattering is in general unknown but can be eliminated by repeating the measurement at a slightly different wavelength where the absorption coefficient of the pollutant is different but the scattering intensity is virtually the same. The change in signal between the two wavelengths thus corresponds entirely to the different amounts of absorption at the two wavelengths, and if the absorption coefficients of the pollutant at these two wavelengths are known the total burden of pollutant between the measuring site and 1.5km range can immediately be deduced. Total burden is the integrated concentration
(4)
Where n(r) is the concentration at range r. Since the DIAL return signal is in fact continuous we can make this calculation at a whole series of ranges and determine the total burden as a function of range. By differentiating this total burden with respect to range one arrives at the pollutant concentration as a function range.
This then is the basic principle of DIAL. A more precise treatment can be given starting with the LIDAR equations for the two wavelengths, which are traditionally known as the on-resonance and off-on-resonance wavelengths (on-on-resonance referring to the wavelengths at which the absorption is largest – usually the peak of an absorption line or feature):
Pon(r)= ² exp[- 2 ] (5)
Poff(r)= ² exp[ - 2 ] (6)
Where p = received backscatter power at time t = 2 r/c; E = transmitted laser pulse energy; T = optical efficiency of telescope system; A = area of telescope primary mirror; = atmospheric backscatter coefficient; = atmospheric extinction coefficient. The atmospheric absorption coefficient can be expressed in terms of its components.
on = M (r) + R (r) + on n (r) (7)
off = M (r) + R (r) + off n (r) (8)
Here we are assuming that the Mie and Rayleigh scattering coefficients, M and R , change negligibly between the on and off resonance wavelengths. Even when the two wavelengths are so far apart that this is no longer true, it is still sometimes the case, that these two terms are small compared with n (r) so that again the variation can be ignored. However in cases where the variation of M and R is not negligible, corrections must then be made for this. is the absorption cross-section of the pollutant and n(r) the concentration of pollutant in molecules/unit volume. n (r) thus represents the absorption produced by the pollutant. By dividing equation (6) by equation (5) we find:
= loge[ . . ] (9) technique for the measurement of the concentration of chemical agents and air pollutants. Many of the chemical agents have absorption bands in the NIR, MIR and LWIR. DIAL lidar systems operating in the IR wavelengths at different regions are used in profiling various chemical agents at stand-off distances. Commercially available tunable lasers in UV, VIS and IR regions including OPO based systems are planned to be used in the DIAL system. Fixed frequency lasers operating at the selective ON and OFF wavelengths will be used wherever the wavelength pair is suitable for a particular chemical agent.
To measure the concentration of various chemical agents the Differential Absorption Lidar (DIAL) technique will be used. Most of the chemical agents have absorption bands in the IR region. It is proposed to use the DIAL technique making use of the tunable CO2 laser transmitter to measure most of the chemical and toxic agents. Also fiber lasers operating in Mid IR region will be used for the measurement of chemical agents which have absorption bands in that region. This technique is well proven and can be used in the Visible, NIR, MIR and LWIR. Many toxic chemical agents and air pollutants including atmospheric trace gases can be conveniently measured using the DIAL technique with the suitable pair of wavelengths appropriate to specific chemical agent. Optical parametric oscillator (OPO) is one of the important and proven methods to generate laser wavelengths required for other chemical agents which are not amenable for measurement with other fixed frequency lasers. The DIAL method is a powerful and well proven technique useful in the stand-off detection of CB agents in two different wavelength regions. It is also established that the identification of bio aerosols could be possible at ranges up to 5Km or more.
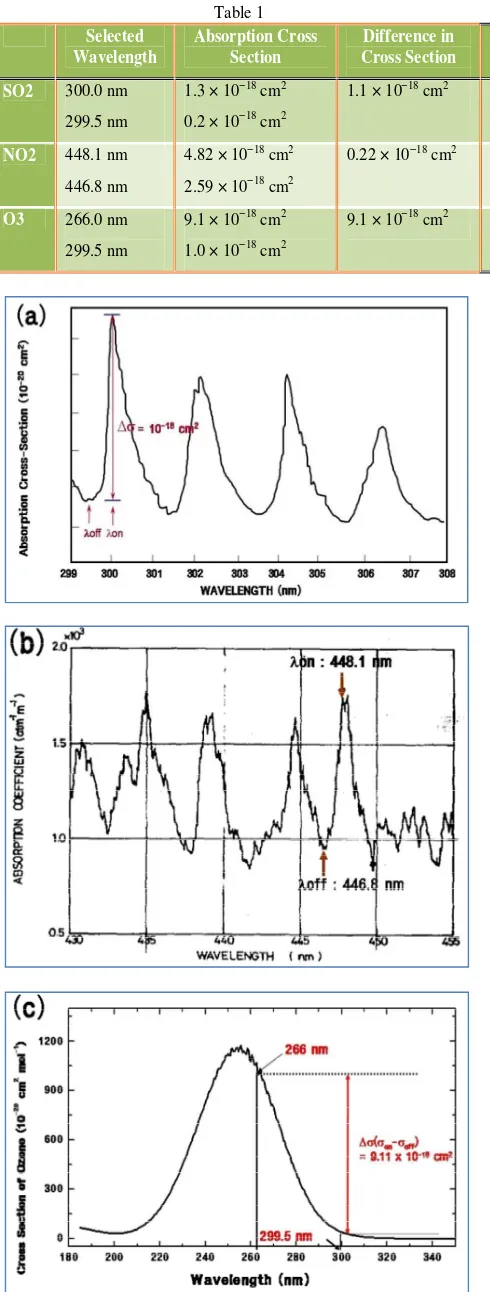
Table 1 shows the selected wavelengths and absorption cross sections for each species [1]
The International Archives of the Photogrammetry, Remote Sensing and Spatial Information Sciences, Volume XL-8, 2014 ISPRS Technical Commission VIII Symposium, 09 – 12 December 2014, Hyderabad, India
This contribution has been peer-reviewed.
Table 1
Selected Wavelength
Absorption Cross Section
Difference in Cross Section
SO2 300.0 nm
299.5 nm
1.3 × 10⁻¹⁸ cm2
0.2 × 10⁻¹⁸ cm2
1.1 × 10⁻¹⁸ cm2
NO2 448.1 nm
446.8 nm
4.82 × 10⁻¹⁸ cm2
2.59 × 10⁻¹⁸ cm2
0.22 × 10⁻¹⁸ cm2
O3 266.0 nm
299.5 nm
9.1 × 10⁻¹⁸ cm2
1.0 × 10⁻¹⁸ cm2
9.1 × 10⁻¹⁸ cm2
Figure.1 Absorption cross section of the UV-VIS spectral region.
The selected wavelength pair of the DIAL measurements (a) SO2,
(b) NO2, and (c) O3
IIISYSTEMOVERVIEW
Figure 2 shows a schematic diagram of the proposed DIAL system. The lidar system has transmitter, receiver, microcontroller, data acquisition and data processing units. A 50 cm dia Cassegrain telescope is used to collect the backscattered signal. The transmitting and receiving telescopes, which are coaxially aligned, are mounted on Gimbals. Receiving telescope is connected to the detector box that contains spectral filters and detectors. There are two detectors, one each for the detection of signals at 2-5 m and 9-11 m regions. A band pass filter allows the lidar signals to reach the respective detectors while blocking any stray light outside the wavelength range of interest. The detected signals are passed through A/D converters and data processors. The data processor consists of a 8 MHz digitizer and a computer for data storage. Table 2 describes the details of the system parameters used.
Fig 2 Schematic diagram of multi-wavelength differential absorption lidar system
Table 2 DIAL system parameters Transmitted energy at online and offline
(Et)
200 mJ
Pulse width (τ ) 100 ns
Pulse repetition frequency (n) 100 Hz
Dia of telescope mirror (D) 50 cm
Detectivity of the detector (D*) 3x10⁹ (m Hz /W )
NEP 1.45x 10⁻⁹ W
Dia of the detector (d) 2 mm
Electrical bandwidth of detector (B) 100 MHz
IVEQUATIONS FOR SIGNAL-TO-NOISE RATIO (SNR) AND
TRANSMITTED ENERGY
The noise contributions arise from the combined effects of detector dark current and the received background radiation. In the mid-IR range, both the solar and terrestrial thermal radiation contributions are very small, and hence, can be neglected. While the dark noise is negligible for good detectors in the visible and near-IR, the detectors in the mid-IR have fairly large dark noise. Since the origin of this dark noise is thermal in nature, cooling the detector to liquid N2 temperature (770 K) reduces the dark noise
contributions significantly. It should be noted that whereas the
The International Archives of the Photogrammetry, Remote Sensing and Spatial Information Sciences, Volume XL-8, 2014 ISPRS Technical Commission VIII Symposium, 09 – 12 December 2014, Hyderabad, India
This contribution has been peer-reviewed.
detector noise in the case of heterodyne (coherent) lidar with sufficient local oscillator power is shot-noise limited, for direct (noncoherent) lidar system with weak return signals, it is dark-current limited in the mid-IR spectral region. Note that the SNR is now range-dependent and, for the case of thermal-background limited case, the SNR of solid-state detector is given by the equation
SNR = √
! (11)
where P is the received power, NEP is the noise equivalent power of the detector and n is the number of received pulses. In the dark-current limited case, NEP of the detector is given by
NEP = √ "
#∗ (12)
where D* is the detectivity, Ad is the area of the detector, and B is the detection bandwidth. The SNR for n=1 is
(13) where Et is the transmitted energy per pulse. By rearranging Eqn (13), the required energy to be transmitted in the atmosphere for single pulse can be computed for given SNR values, which is given by
(14)
VCONCLUSION
The theoretical analysis of the DIAL system shows that the differential absorption lidar technique is a powerful method for the detection and measurement of ozone and other important industrial emissions. The efficacy of the method has shown using a typical lidar system specifications and collecting suitable pair of wavelengths for various industrial emissions. The signal to noise ratio in each of the cases has been worked out and presented. The uniqueness of the system is that it provides the vertical profile of the concentration of the chemical species with good spectral temporal resolutions. Also the technique does not require any calibration and infect sensitivity of the system increases with range of measurements.
VIREFERENCES
[1] Sung-Chul Choi, Do-Kyeong Ko and Jongmin Lee, “The Development of a Mobile Remote Monitoring System by Using Differential Absorption LIDAR Technology” Journal of the Korean Physical Society, Vol. 49, No. 1, July 2006, pp. 331~336
[2] S. Veerabuthiran and Jai Paul Dudeja, “Parametric Study of Differential Absorption Lidar System for Monitoring Toxic Agents in the Atmosphere” Defence Science Journal, Vol. 57, No. 5, September 2007, pp. 755-764.
[3] Measures, R.M., Laser Remote Sensing: Fundamentals and Applications, John Wiley & Sons, Inc., New York, 1984
[4] Perconti, P.; Hilger, J.; Loew, M., “Vehicle detection approaches using the NVESD Sensor Fusion Testbed”, Applied Imagery Pattern Recognition Workshop, 2003. Proceedings. 32nd : 15-17 Oct. 2003 Page(s): 56 - 61
[5] Steinvall, O., “3-D imaging laser radars: modelling and experimental results”, Lasers and Electro-Optics Europe, 2000. Conference Digest. Date 10-15 Sept. 2000 Digital Object Identifier : 10.1109/CLEOE.2000.909693
[6] Fournier, G.R.,D. Bonnier, J.L. Forand and P.W. Pace, 1993: Range-gated under water laser imaging system. Optical Engineering, 32, 9
[7] Ulrich, B.L., P.Lacovara, S.E. Moran and M.J.Deweert, 1997: Recent results in imaging lidar: Adavnces in Laser Remote Sensing for Terrestial and Hydrographic Applications. R.M Narayanan and J.E. Kalashoven, eds: Proc. SPIE V, 3059, 95-108 (1997)
[8] Deni Bonnier, Vincent Larochelle A range-gating active imaging system for search and rescue, and surveillance operations Proc. SPIE 2744, Infrared Technology and
Applications XXII, 134 (June 27, 1996); doi:10.1117/12.243458
[9] William T. Cooley, Matthew L. Gurey, Patrick R. Dodd, Barton W. Griffy, John Kelly, Tim Pressnall Overview of the Air Force Research Laboratory laser applications group active imaging programs Proc. SPIE 3698, Infrared Technology and
Applications XXV, 202 (July 26, 1999); doi:10.1117/12.354521
[10] Zhao Xun-jie, Gao Zhi-yun, Zhang Ying-yuan. Technique of active laser reconnaissance and the appl ications in the military based on "cat-eye" etct [1]. Optical Technology, 2003, 29(4):415-417.
The International Archives of the Photogrammetry, Remote Sensing and Spatial Information Sciences, Volume XL-8, 2014 ISPRS Technical Commission VIII Symposium, 09 – 12 December 2014, Hyderabad, India
This contribution has been peer-reviewed.