DIMENSIONALITY REDUCTION OF HYPERSPECTRAL IMAGES BY COMBINATION OF
NON-PARAMETRIC WEIGHTED FEATURE EXTRACTION (NWFE) AND MODIFIED
NEIGHBORHOOD PRESERVING EMBEDDING (NPE)
T. Alipour Fard a, *, H. Arefi a
a Dept. of Geomatics and Surveying Eng., University of Tehran, Tehran, Iran
- (tayebalipour, hossein.arefi)@ut.ac.ir
KEY WORDS: Hyperspectral Imagery, Feature Extraction, LDA, NPE, Classification
ABSTRACT:
This paper combine two conventional feature extraction methods (NWFE&NPE) in a novel framework and present a new semi-supervised feature extraction method called Adjusted Semi semi-supervised Discriminant Analysis (ASEDA). The advantage of this method is dominating the Hughes phenomena, automatic selection of unlabelled pixels, extraction of more than L-1(L: number of classes) features and avoidance of singularity or near singularity of within-class scatter matrix. Experimental results on well-known hyperspectral dataset demonstrate that compared to conventional extraction algorithms the overall accuracy of the classification increased.
* Corresponding author.
1. INTRODUCTION
High-dimensional data appear in many applications of classification, data mining and machine learning. Hyperspectral images consist of hundreds of spectral bands that provide effective means for discrimination of subtly different phenomena for earth observation (Schott, 2007). Evidently, the curse of dimensionality problem arises when the number of bands in hyperspectral increases (Jun and Ghosh, 2011). Feature extraction is commonly applied as a preprocessing step to overcome the curse of dimensionality .Much work has been carried out in the literature to overcome this issue. The main approaches can be categorized in three groups:i)Regularization of the sample covariance matrix ii)Adaptive statistics estimation by the exploitation of the classifier (semi labeled) samples iii) Preprocessing techniques based on feature selection/extraction, aimed at reducing/transforming the original feature space into another space of a lower dimensionality (Jimenez and Landgrebe, 1998).
One of the main approaches to overcome the curse of dimensionality is based on feature extraction, aimed to transforming the original feature space into subspace with a lower dimension (Kuo and Landgrebe, 2001).
In the last decade, many methods have been proposed by various researchers that can be categorized into the supervised and unsupervised methods (He et al., 2005). One of the most popular unsupervised methods is Principle Component Analysis (PCA) which is not preserve properties of local neighborhood of classes, so it is commonly used for visual interpretation (He et al., 2005). Neighborhood Preserving Embedding (NPE) is another unsupervised method can preserve local neighborhood information and overcome to over fitting problems of supervised methods (Liao
et al, 2011). The weakness of the unsupervised methods is random selection of pixels that in this paper we have tried to solve this problem.
One the other hand, supervised methods maximize the class discrimination of the data (Chang, 2000). The well-known supervised method is Linear Discriminant Analysis (LDA) aimed to maximize between-class to within-class scatter matrices ratio (Fukunaga, 1990). Many studies focus on definition of between-class and within-between-class scatter matrices in parametric and non-parametric fashion. Bor Chen Kuo and David Landgereb proposed NWFE method to achieve full rank between class matrixes and extract greater features (Kuo, 2004). Jinghua Wang et al. prove the orthogonal feature to avoid singularity or near singularity of within class matrix. Regularized techniques in (Tatyana, 2009) have been proposed to solve singularity of within class matrix. In most supervised methods neighborhood information is not be considered.
In this paper, we proposed a method called Adjusted Semi supervised Discriminant Analysis (ASEDA) in order to preserve local information and maximize the distance between the classes. Indeed, combination of scatter matrix derived from NWFE and NPE algorithms caused that weakness of unsupervised and supervised methods are eliminate. Particular examination on a benchmark hyperspectral data set demonstrates an improvement of classification accuracy using ASEDA compared to conventional feature extraction methods.
The International Archives of the Photogrammetry, Remote Sensing and Spatial Information Sciences, Volume XL-2/W3, 2014 The 1st ISPRS International Conference on Geospatial Information Research, 15–17 November 2014, Tehran, Iran
This contribution has been peer-reviewed.
2. METHODOLOGY
Let {xi} i=1,2,…, N, xi
Rd denote high dimensional data , {yi} i=1,2,…, N , yi
Rr denote low dimensional data where r << d. In our application, d is the number of spectral bands of hyperspectral images, and r is the dimensionality of the projected subspace. The assumption is that there exists a mapping function fwhich can map every original data point xi to yi = f(xi) such that most information of the high dimensional data is kept in a much lower dimensional projected subspace (Alipour, 2012).
2.1 NWFE
Supervised feature extraction approaches computes an optimal transformation (projection) by minimizing the within-class distance and maximizing the between-class distance simultaneously, thus achieving maximum class discrimination. The optimal transformation can be readily computed by applying an Eigen decomposition on the so-called scatter matrices. The NWFE obtains a transformation matrix, W, such that maximizes the between-class scatter matrix Sb and minimizing the within-class scatter matrix Sw.
T
i i
y
W x
(1), subject to maximize T b T
w
W S W W S W
(2)
Where Sb and Sw are computed using training data, Mi is the number of samples in class i and C is number of classes.
In NWFE, scatter matrices, called the within-class, between-class and total scatter matrices are defined as follows (Kuo, 2004):
Bor chen kuo used regularized equation (5) to overcome singularity or near singularity of within class scatter matrix.
2.2 NPE
Neighborhood Preserving Embedding is a linear approximation to locally linear embedding feature extraction. The algorithmic procedure is formally stated below:
Step 1: Select neighborhoods
In this step i-th node corresponds to the data point xi. In the standard NPE methods there are two ways to construct the adjacency graph:
K nearest neighbors (KNN): Put a directed edge from node i to j if xj is among the K nearest neighbors of xi.
e neighborhood: Put an edge between nodes i and j if
dist(xi , xj) ≤ e
Selection of pixels in this step is random an it caused to get different result during computation of overall accuracy in classification map. We proposed to spectral and spatial criterion for selecting unlabeled pixels using training data. Spectral angle mapper (De in Equation (6)) is an insensitive to noise criterion that we used to select unlabeled pixels and negiborhood of training pixels for spatial criterion (Da in Equation (7)).
In Equation (6) X is unlabeled pixels and µi is mean training sample corresponds to the i-th class.
In equation (7) (ic,jc) coordinate of labeled pixels in image and (ni,nj) arbitrary coordinate of pixels can be candidate.
Step 2: Computing the weights
The weights on the edges can be computed by minimizing the following objective function,
Step 3: Computing the Projections
In this step, we compute the linear projections. Generally projection matrix in locally linear feature extraction method can be writing as:
For NPE [13], ¯ = I and _ = (I-Q)' (I-Q).
2.3 COMBINATION OF NWFE AND NPE IN NATURAL FRAMEWORK
If all data X partitioned to two section X=[Xlabeled,Xunlabeled], in our method, mapping matrix is defined as follow:
Where: (3)
(4)
(5)
(6)
(7)
(8)
(9)
(10)
( ) ( )
( ) ( )
( ) ( )
0
[ , ] [ , ]
0
( )
T T
ASEDA labeled n n labeled unlabeled N n N n unlabeled
n n T
labeled unlabeled labeled unlabeled
N n N n
T
S X Q X X C X
Q
X X X X
C
X Q C X
(10)
C C
The International Archives of the Photogrammetry, Remote Sensing and Spatial Information Sciences, Volume XL-2/W3, 2014 The 1st ISPRS International Conference on Geospatial Information Research, 15–17 November 2014, Tehran, Iran
This contribution has been peer-reviewed.
And
To obtain the projection matrix, we solve the generalized eigenvalue problem of the proposed ASEDA method, which is equivalent to:
Through its nonlinear combination of supervised and unsupervised components, the proposed ASEDA seeks a projection direction on which the local neighborhood information of the data can be best preserved, while simultaneously the class discrimination is maximal.
3. EXPERIMENTAL RESULTS
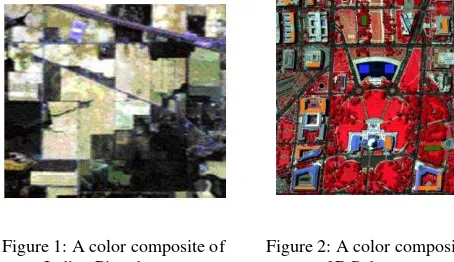
To evaluate the proposed method a well known hyperspectral dataset is used. One is Indian Pine data set that is a sub-image of AVIRIS data with the size of 145×145 pixels that was taken over
the northwest Indiana’s Pine test site in June 1992 and has 16
classes. The data has 220 spectral bands with a spatial resolution of 20 m. The 20 water absorption channels and 15 noisy channels were also removed, resulting in a total of 185 channels. The calibrated data are available online (along with detailed ground-truth information) from http://cobweb.ecn.purdue.edu/˜biehl/.
Another data set is DC mall. DC Mall data set was collected with an airborne sensor system over the Washington DC Mall, with 1280×307 pixels and 210 spectral bands in the 0.4-2.4 µm region. This data set consists of 191 spectral Bands after elimination of water absorption and noisy bands and is available at
http://cobweb.ecn.purdue.edu/˜biehl/.
Figure 1: A color composite of Indian Pine dataset
Figure 2: A color composite of DC data set
Moreover, the performance of most common classifiers such as Linear Discriminant Classifier (LDC), K-Nearest Neighborhood (K-NN) and Quadratic Discriminant Classifier (QDC) is evaluated in terms of Overall Classification Accuracy (OCA)[5]. The number of training and test samples of the dataset used is given in Table I, II.
TABLE I
NUMBER OF TRAINING AND TEST SAMPLES FOR EACH CLASS OF THE
INDIANA PINE DATA SETS.
No Indiana Pine dataset
Class Training Test
1 Corn-no till 50 80
2 Corn-min 30 88
3 Grass/Pasture 41 60
4 Grass/Trees 69 180
5 Hay-windrowed 34 189
6 Soybeans-no till 35 48
7 Soybeans-min 64 126
8 Soybeans-clean 44 91
9 Woods 68 176
Total 435 1038
TABLE II
NUMBER OF TRAINING AND TEST SAMPLES FOR EACH CLASS OF THE DC
DATA SET.
No Washington DC dataset
Class Training Test
1 Shadow 112 1632
2 Path 196 695
3 Water 1220 2905
4 Trees 500 10953
5 Building 597 12261
6 Road 3907 13458
7 Grass 2108 19496
Total 8640 61400
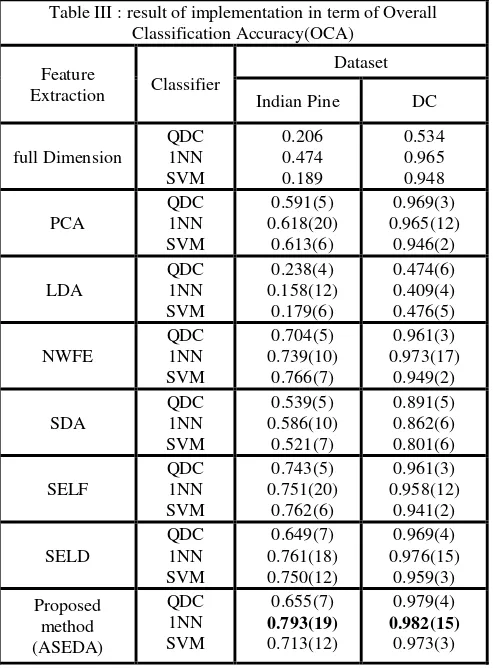
An experiment has been designed in a way that the performance of ASEDA is compared to its counterpart and conventional feature extraction methods. To evaluate the performance of the ASEDA the Overall Classification Accuracy (OCA) of SVM, QDC and 1-NN over examined dataset has been used. In recent years techniques such as Principle Component Analysis (PCA), Classical LDA (Tatyana, 2009), NWFE (Kuo, 2004) Semi-supervised discriminant analysis (SDA) (Cai, 2008), Semi-Supervised Local Fisher Discriminant SELF (Liao, 2011) and Semi-Supervised Local Discriminant Analysis (SELD) (Liao, 2011) proposed. Table III shows the produced OCA of the LDC,QDC and K-NN classifiers using PCA, LDA, NWFE, SDA, SELF and SEELD over Indian Pine dataset and DC dataset.
( ) ( )
( ) ( )
( )( ) ( )
0
[ , ] [ , ]
0 (( ) )
T T
ASEDA labeled n n n n labeled unlabeled N n N n unlabeled
n n n n T
labeled unlabeled labeled unlabeled
N n N n T
S X I Q X X C X
I Q
X X X X
C
X I Q C X
(11)
(12)
The International Archives of the Photogrammetry, Remote Sensing and Spatial Information Sciences, Volume XL-2/W3, 2014 The 1st ISPRS International Conference on Geospatial Information Research, 15–17 November 2014, Tehran, Iran
This contribution has been peer-reviewed.
4. CONCOLUSION
Implementation of the proposed method on examined dataset lead to extraction of features that mainly are discriminative, because of degeneracy of Sw-1Sb was almost declined. The superior result obtained by ASEDA using 1-NN classifier in both dataset.
Moreover, the results demonstrate that classification accuracy improves about 3% to 4% using ASEDA for Indiana pine and about 2% to 3% in DC data set compared to conventional feature extraction algorithms.
5. ACKNOLOWDGMENT
The authors would like to thank Prof. Landgrebe for providing the AVIRIS Indian Pines and ground truth image.
REFRENCES
Kuo, B.C., Landgrebe, D., 2004, Nonparametric Weighted Feature Extraction for Classification, IEEE TRANSACTIONS ON GEOSCIENCE AND REMOTE SENSING, VOL. 42, NO. 5.
Liao, W., Pizurica, A., Philips, W., Pi, Y., 2011, Feature extraction for hyperspectral images based on semi-supervised local discriminant analysis, JURSE 2011, Munich, Germany.
Alipour Fard, T., Mojaradi, B., Esmaeily, A., 2012, Feature extraction of hyperspectral images based on reformulate computation of between class scatter matrixes. Geoscience and
Remote Sensing Symposium (IGARSS), 2012 IEEE International.
IEEE.
Schott, J.R., 2007, Remote Sensing The Image Chain Approach, Oxford University Press, Newyork, 2007.
Jun, G., Ghosh, J., 2011, Spatially Adaptive Classification of Land Cover With Remote Sensing Data, IEEE TRANSACTIONS ON GEOSCIENCE AND REMOTE SENSING, VOL. 49, NO. 7.
Cai, D., He, X., Han, J., 2008, Semi-supervised Discriminant Analysis, National Science Foundation.
Kuo, B., Landgrebe, D., 2001, Improved Statistics Estimation and Feature Extraction For Hyperspectral Data Classification, PhD Thesis and School of Electrical & Computer Engineering Technical Report. TR-ECE 01-6.
Jimenez, L., Landgrebe, D., 1998, Supervised Classification in High Dimensional Space: Geometrical, Statistical and Asymptotical Properties of Multivariate Data, IEEE TRANSACTIONS ON GEOSCIENCE AND REMOTE SENSING,
VOL. 28, NO. 1.
Chang, C-I., Ren, H., 2000, An experiment-based quantitative and comparative analysis of target detection and image classification
algorithms for hyperspectral imagery,” IEEE Trans. Geosci. Remote Sens., vol. 38, no. 2, pp. 1044-1063.
Tatyana V.B., Bruzzone, L., Camps-Valls, G., 2009, Classification of Hyperspectral Images With Regularized Linear Discriminant Analysis, IEEE Trans. Geosci. Remote Sens. VOL. 47, NO. 3, pp.862-873.
Fukunaga, K., 1990, Introduction to Statistical Pattern Recognition, 2nd edition. New York: Academic.
Jieping Ye., Shuiwang Ji., 2009, Discriminant Analysis for Dimensionality Reduction: An Overview of Recent Developments.
He, X.F., Cai, D., Yan, S.C., Zhang, H.J., 2005, Neighborhood preserving embedding, Tenth IEEE International Conference on Computer Vision 2005, vol. 2, pp. 1208-1213.
Table III : result of implementation in term of Overall Classification Accuracy(OCA)
The International Archives of the Photogrammetry, Remote Sensing and Spatial Information Sciences, Volume XL-2/W3, 2014 The 1st ISPRS International Conference on Geospatial Information Research, 15–17 November 2014, Tehran, Iran
This contribution has been peer-reviewed.