CLUSTERING OF MULTI-TEMPORAL FULLY POLARIMETRIC L-BAND SAR DATA
FOR AGRICULTURAL LAND COVER MAPPING
H. Tamiminia a, *, S. Homayouni b, A. Safari a
aSchool of Surveying and Geospatial Engineering, Dept. of Remote Sensing, College of Engineering, University of Tehran, Iran - (haifa.tamiminia, asafari)@ut.ac.ir
b Dept. of Geography, Environmental Studies and Geomatics, University of Ottawa, Ottawa, Canada - [email protected]
KEY WORDS: Kernel-Based Fuzzy C-means, Crop Classification, Polarimetric SAR Images, Multi-Temporal Data, Target Decompositions
ABSTRACT:
Recently, the unique capabilities of Polarimetric Synthetic Aperture Radar (PolSAR) sensors make them an important and efficient tool for natural resources and environmental applications, such as land cover and crop classification. The aim of this paper is to classify multi-temporal full polarimetric SAR data using kernel-based fuzzy C-means clustering method, over an agricultural region. This method starts with transforming input data into the higher dimensional space using kernel functions and then clustering them in the feature space. Feature space, due to its inherent properties, has the ability to take in account the nonlinear and complex nature of polarimetric data. Several SAR polarimetric features extracted using target decomposition algorithms. Features from Cloude-Pottier, Freeman-Durden and Yamaguchi algorithms used as inputs for the clustering. This method was applied to multi-temporal UAVSAR L-band images acquired over an agricultural area near Winnipeg, Canada, during June and July in 2012. The results demonstrate the efficiency of this approach with respect to the classical methods. In addition, using multi-temporal data in the clustering process helped to investigate the phenological cycle of plants and significantly improved the performance of agricultural land cover mapping.
1. INTRODUCTION
Remote sensing offers an important source of data for studying spatial and temporal variability of the environmental parameters (Blaes et al., 2005). Crop identification from earth observing satellites is essential for monitoring food security, agricultural and economic planning. Both optical/infrared and microwave satellite data can be used for this purpose. Recently, Synthetic Aperture Radar (SAR) imagery, thanks to their potential of data collection regardless of weather and illumination conditions, has become an essential tool for crop mapping and monitoring activities (Jiao et al., 2014). Radar-based crop type classification requires earth observations with multiple polarization. In particular, Polarimetric Synthetic Aperture Radar (PolSAR) sensors can acquire data sensitive to the dielectric properties of the crop canopy and its geometric structure (i.e., the size, shape, orientation distribution of leaves, stalks and fruits) ((Soria-Ruiz et al., 2007) and (Skriver et al., 1999)). Fully polarimetric radars record the complete characterization of the scattering field. Thus, both four mutually coherent channels recorded and phase information are observed and recorded for further processing. As a result, users can synthesize any linear or nonlinear polarization and can generate other polarimetric variables (McNairn et al., 2004). Consequently, land cover classification is one of the most important applications of PolSAR data (Lee and Pottier, 2009).
In general, classification methods are divided into two categories: supervised and unsupervised or clustering. The most important issue with supervised classification approaches is providing of high quality and quantity training data, which is almost costly and time-consuming. Because of this limitation, there is a strong interest in developing of unsupervised techniques (Rignot, et al., 1992).
Clustering algorithms aim to identify the unknown structure or pattern among the data. These structures can be the natural groups or clusters within the multi-dimensional feature space by measuring similarities between different pixels’ data.
The C-means clustering families are the best known and robust techniques of batch clustering models, due to using the least square models (Bezdek, et al., 2005). The most frequently used algorithms of these families are C-means and Fuzzy C-means (FCM) algorithms. Hard clustering algorithms, such as K-means, divide data into distinct classes, whereas in fuzzy clustering, every pixel has a membership of belonging to all clusters rather than belonging to one single cluster. Presence of the mixed pixels in the remote sensing data is a potential case study to use fuzzy C-means method in clustering. FCM is a technique of clustering which permits data points to cluster based on spectral similarity and mainly used in pattern recognition (Vanisri, 2004). Nonetheless, these models are relatively efficient for linearly separable patterns, the inherent nature of polarimetric data is very complex. As a result, they are not linearlyseparable. As a solution, the aim of this paper is to present a kernel-based fuzzy C-means clustering (KBFCM) approach to classify nonlinear data in order to map the agricultural crop lands.
Unsupervised PolSAR classification follows three major approaches. One based on the inherent statistical characteristics of PolSAR data (Bell and Hall, 1967). The second category classifies PolSAR imageries by inherent physical scattering characteristics (Zyl, 1989). This approach has the advantage of providing information for class type identification, but the classification results typically lose the details and the number of classes is normally small. In the third category, both statistical and physical scattering characteristics are considered. As a result, they can classify PolSAR data most effectively (Lee and Pottier, 2009). However many clustering methods have been
proposed, they are not efficient enough to distinguish between classes, especially in agricultural crop mapping.
This paper presents a framework for classifying multi-temporal full polarimetric SAR data using kernel-based fuzzy C-means clustering method, over an agricultural region. The paper is organized as follows: In Section 2, a brief review of kernel-based clustering and the proposed method will be defined. Section 3 gives some information about used data. Section 4 presents the results and discussion of the clustering results. Finally, Section 5 concludes the paper.
2. METHODOLOGY
2.1 Kernel Principals
In the field of remote sensing, descriptive machine learning algorithms often focus on land cover classifications (Camps-Valls and Bruzzone, 2009). In machine learning, kernel methods are used for classification, clustering, regression, density estimation and visualization with heterogeneous types of data, such as time series, images, strings or objects (Schölkopf and Smola, 2002). In this subsection, a brief description of the notion of kernels is presented.
Kernel methods by using a nonlinear transform, map the dataset
� = {� , � , … , ��} defined over the input or attribute space Χ
However, direct computation in the high-dimensional feature space consumes much time and sometimes even infeasible. To avoid working in the potentially high-dimensional space, the dot product can be evaluated directly using a nonlinear function in input space by means of the kernel trick (Camps-Valls et al., 2008). Every function that meets the Mercer’s condition can be used as a kernel function. Usually, kernel functions are used instead of Mercer kernels or, equivalently, positive definite kernels.
The similarities between elements in feature space can be measured using inner product. For convenience we introduce the following function that does exactly that (Camps-Valls and Bruzzone, 2009):
This function is called a kernel. The mapping φ is referred to as its feature map and the space Η as its feature space.
The distances of the elements in H can be evaluated entirely in the terms of kernel evaluations (Camps-Valls and Bruzzone, 2009): inherent properties enable us to clustering nonlinear datasets simpler and more efficient. Kernel-based algorithms, unlike to the classical clustering techniques which use the Euclidean distance, benefit from kernel distance in order to calculate the objective function. The minimized objective function formula is given by (Girolami, 2002):
Optimization of objective function with respect to two variables (cluster centers and partition matrix) is one of the most important issues facing the partitional clustering models (Chen and Zhang, 2004). By an alternative optimization, in each apply other kernel functions, first the kernel function is replaced with K in Equation (8), then, this equation is optimized cluster centers and fuzzy partition matrix. For instance, the cluster centers for polynomial kernel will be obtained as:
1
1
1 1
(
,
1)
(
,
1)
n
m p
ji i i j i
i n
m p
ji j j i
u x
x c
c
u
c c
(11)
The kernel-based fuzzy C-means clustering procedures are shown below:
Step 1: Choose the kernel function, the maximum number of iterations, m and ε.
Step 2: Initialize the cluster centers.
Step 3: Calculate fuzzy partition matrix U according to Equation (9).
Step 4: Update cluster centers by Equation (10) or (11) depending on the kernel function and U.
Step 5: Until termination criterion satisfied (objective function (i+1) – objective function (i) ˂ ε) or maximum iterations reached stop, otherwise, go to step 3.
Step 6: Defuzzify the final U in order to obtain a hard membership decision. The highest membership was obtained by using the maximum membership decision rule.
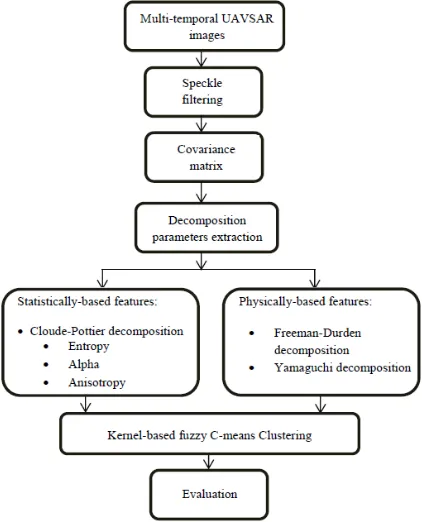
Figure 1 shows an overview of the proposed method. It starts by preprocessing of raw L-band SAR data. This preprocessing step consist of multi-looking and speckle filtering. Then the decomposition algorithms were applied to the covariance matrix of full polarimetric SAR data, in order to extract several physically and statistically based features. These features are the linear polarization intensities in HH, HV and VV, Freeman-Durden, Yamaguchi and Cloude-Pottier decompositions. Finally, the proposed kernel-based fuzzy C-means clustering was applied on these features to map out the various crop types.
Figure 1. An overview of the proposed method
3. POLARIMETRIC SAR DATA
The proposed method has applied to four dates of polarimetric SAR data acquired by Uninhabited Aerial Vehicle Synthetic
Aperture Radar (UAVSAR), over an agricultural area near Winnipeg, in Manitoba, Canada, during June and July in 2012. The data acquisition was to support the Soil Mapping Active Passive Validation Experiment 2012 (SMAPVEX 12) mission of the JPL- NASA. The UAVSAR data were collected 14 days during which soil and moisture and vegetation conditions significantly variant. The campaign started at the period of early crop development and finished at the point where crops had reached maximum biomass (McNairn et al., 2014). The UAVSAR system is an aircraft-based fully polarimetric L-band radar system operated by the JPL Radar Science and Engineering Section. Though there are plans to fly the system aboard a UAV, such as a Global Hawk, in the future, the UAVSAR system is currently flying aboard a NASA Gulfstream III and nominally operates at 45,000 ft AGL. The system has a precision real-time GPS and sensor-controlled flight management system which allows for repeatable flight paths that remain within a 10 m diameter tube about the intended track. This flight precision allows for differential interferometric studies of dynamic phenomena. The UAVSAR radar has some unique features that are worth noting. First, it has quad-pol capability. Second, it has a range bandwidth of 80 MHz which gives the Single-Look-Complex (SLC) data a 1.66 m range and 0.6 m azimuth resolution. The third notable feature is that the antenna can be steered ±20° along the azimuth line. This allows the radar line of sight direction to be independent of the wind-induced motion of the aircraft (Rosen et al., 2006). Its high spatial resolution allows studies of backscattering from homogeneous vegetation covers. Figure 2 shows a 501×501 subsample of the color composite of Pauli decomposition.
Figure 2. Color composite of Pauli decomposition (R=�ℎℎ+ ��� , G=�ℎℎ− ��� ,B= �ℎ�)
4. RESULTS AND DISCUSSION
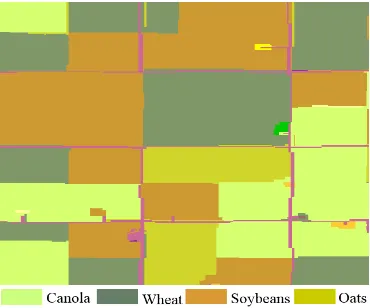
The proposed method has applied to the polarimetric features extracted from four datasets. To evaluate the results quantitatively, a ground truth image of the study area is used. This area consists of four dominant crop types including Wheat, Soybeans, Canola and Oats. The reference crop map of the study area is presented in Figure 3. The performance of the proposed algorithm is evaluated using actually three strategies: First, we have investigated the results of using different types of kernel functions. In second strategy we compared the best result of the kernel functions (RBF) with conventional methods. Finally, we evaluated RBF kernel with different number of dates to investigate the influence of the multi-temporal data for classification. The detailed comparisons and results are shown below.
Figure 3. Reference map and its legend
4.1 Different kernel functions evaluation
Table 1 contains accuracy parameters of using different kernel functions. The experimental results demonstrate that the accuracy of RBF kernel is more than polynomial and linear kernels. RBF kernel is the most popular kernel among the others in SAR data processing. Its efficiency can be explained by the nature of SAR data, because the statistical distribution of these data is approximately normally distributed and it is less sensitive to the noise. The next one is polynomial kernel, the experimental results showed that with increasing the kernel parameter the bigger values affect the dot products and the kernel values become unreal as a result the accuracy will decrease. In addition, the parameters of polynomial kernel are usually difficult to determine and it is more time-consuming and complicated. The linear kernel is the simplest one that takes the least time to process. It has the lowest results among other kernels.
Kernel type Overall accuracy Kappa coefficient
RBF 89.95 0.86
Polynomial 88.43 0.84
Linear 86.58 0.81
Table 1. Accuracy parameters of different kernel functions assessment
4.2 Comparisons with conventional methods
In this strategy we have compared the result of KBFCM with conventional methods such as K-means and FCM. Table 2 presents the overall accuracies and kappa coefficients of the results. Figure 3 shows the visual comparison of resulted classification maps. The performance of kernel-based fuzzy C-means algorithm with RBF kernel is very obvious in Table 1 and Figure 3. It can be seen that using kernel function to map input data into feature space and measuring the similarities with kernel rather than Euclidean distance can improve the clustering accuracy. Because calculating the distance with Euclidean equation is more sensitive to noise. Table 2 also represents the better accuracy for FCM algorithm with respect to K-means algorithm. This result can be explained by the inherent property of the fuzzy clustering. In fuzzy clustering, unlike to hard clustering we can consider each pixel to all classes. Existing mixed pixels especially in PolSAR data is one of the reasons for performance of the fuzzy C-means clustering.
Method Overall accuracy Kappa coefficient
KBFCM-RBF 89.95 0.86
FCM 77.22 0.69
K-means 71.85 0.6
Table 2. Comparisons between kernel-based and conventional methods
Figure 3. Final Crop maps: KBFCM- RBF (Top), FCM (Middle), and K-means (Bottom)
4.3 Multi-temporal SAR data assessment
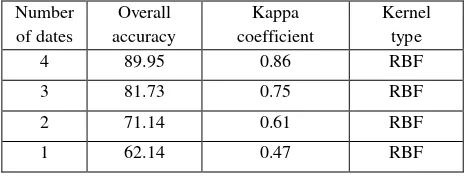
In this strategy we investigate the impact of using more than one date in clustering results. The results show that using multi- temporal datasets with four dates of data increase the overall accuracy up to 27% with respect to the single-date data. The overall accuracies and kappa coefficients of the clustering results are provided in Table3.
Number of dates
Overall accuracy
Kappa coefficient
Kernel type
4 89.95 0.86 RBF
3 81.73 0.75 RBF
2 71.14 0.61 RBF
1 62.14 0.47 RBF
Table 3. Accuracy parameters of multi-temporal assessment
5. CONCLUSION
The aim of this paper was to study the capability of multi-temporal UAVSAR L-band PolSAR data for crop mapping. Four full polarimetric images were acquired over an agricultural area. Several statistical and physical based decomposition features in addition to linear polarization intensities were extracted from data. A kernel-based fuzzy C-means clustering method based on several kernel functions (i.e. RBF, polynomial and linear) was applied to these features in order to classify data. The results showed that multi-temporal datasets increases the overall accuracy with respect to the single-date, two-dates and even three-dates data. Among the different kernels which used in this research, RBF kernel has much better accuracy than polynomial and linear kernels. Moreover, the proposed algorithm because of working in the higher dimensional feature space is more efficient than the other well-known classic methods such as FCM and K-means algorithms.
ACKNOWLEDGEMENTS
The authors would like to thank the SMAPVEX 2012 team for providing this data set. They also acknowledge the comments of Dr. Heather McNairn from Agriculture and Agri-food Canada, Ottawa that help to improve the paper.
REFERENCES
Bell, G. H. and Hall, D. J., 1967. A clustering technique for summarizing multi-variate data. Behavioral Science, 12(2), pp. 153–155.
Bezdek, J. C., Keller, J. M., Krishnapuram, R. and Pal, N. R., 2005. Fuzzy models and algorithms for pattern recognition and image processing. Springer, New York.
Blaes, X., Vanhalle, L. and Defourny, P., 2005. Efficiency of crop identification based on optical and SAR image time series. Remote Sens. Environ. Vol. 96, pp. 352–365.
Camps-Valls, G., Gomez-Chova, L., Munoz-Mari, J., Rojo-Alvarez, J. L. and Martinez-Ramon, M., 2008. Kernel-Based Framework for Multitemporal and Multisource Remote Sensing Data Classification and Change Detection. IEEE Transactions on Geoscience and Remote Sensing, 46(6), pp. 1822–1835. Camps-Valls, G. and Brizzone, L., 2009. Kernel Methods for Remote Sensing Data Analysis, 1st ed. John Wiley & Sons, Chichester,U.K.
Chen, S.C. and Zhang, D. Q., 2004. Robust image segmentation using FCM with spatial constraints based on new kernel-induced distance measure. IEEE Transactions on Systems, Man, and Cybernetics _Part B: Cybernetics, 34(4), pp. 1907–1916.
Girolami, M., 2002. Mercer kernel based clustering in feature space. IEEE Transactions on Neural Networks, Vol.13, pp. 780–784.
Jiao, X., Kovacs, J. M., Shang, J., McNairn, H., Walters, D., Ma, B. and Gang, X., 2014. Object-oriented crop mapping and monitoring using multi-temporal polarimetric RADARSAT-2 data. ISPRS Journal of Photogrammetry and Remote Sensing, pp. 38–46.
Lee, J. S. and Pottier, E., 2009. Polarimetric Radar Imaging: From Basics to Applications, 1st ed. CRC Press, Boca Raton.
McNairn , H., Hochheim, K. and Rabe, N., 2004. Applying polarimetric radar imagery for mapping the productivity of wheat crops. Canadian Journal of Remote Sensing, 30(3), pp. 517–524.
McNairn , H., Jackson,T. J., Wiseman, G., Bélair, S., Berg, A. A., Bullock, P., Colliander, A., Cosh, M. H., Kim, S.-B., Magagi, R., Moghaddam, M., Adams, J. R., Homayouni, S., Ojo, E., Rowlandson, T., Shang, J., Goïta, K. and Hosseini, M., 2014. The Soil Moisture Active Passive Validation Experiment 2012 (SMAPVEX12): Pre-Launch Calibration and Validation of the SMAP Satellite. IEEE Transactions on Geoscience and Remote Sensing, Vol. 53, pp. 2784–2801.
Rignot, E., Chellappa, R. and Dubois, P., 1992. Unsupervised segmentation of polarimetric SAR data using the covariance matrix. IEEE Trans. Geosci. Remote Sensing, Vol. 30, pp. 697– 705.
Rosen, P. A., Hensley, S., Wheeler, K., Sadowy, G., Miller,T., S. Shaffer, Muellerschoen, R., Jones, C., Zebker, H. and Madsen, S., 2006. UAVSAR: A new NASA airborne SAR system for science and technology research. In: IEEE Conference on Radar, pp. 24–27.
Schölkopf, B. and Smola, A. J., 2002. Learning with Kernels Support Vector Machines, Regularization, Optimization, and beyond. MIT Press, Cambridge, MA.
Skriver, H., Svendens, M. T. and Thomsen, A. G., 1999. Multitemporal C- and L-band polarimetric signatures of crops. IEEE Transactions on Geoscience and Remote Sensing, 37(5), pp. 2413–2429.
Soria-Ruiz , J., McNairn, H., Fernandez-Ordonez, Y. and Bugden-Storie, J., 2007 . Corn monitoring and crop yield using optical and RADARSAT-2 images. IEEE International Geoscience and Remote Sensing Symposium, pp. 3655–3658. Vanisri, D., 2014. A novel kernel based fuzzy C-means clustering with cluster validity measures. International journal of computer science and network solutions, 2(12), pp. 18–26. Yu, J., Yan, Q., Zhang, Z., Ke, H., Zhao, Z. and Wang, W., 2012. Unsupervised classification of polarimetric synthetic aperture radar images using kernel fuzzy C-means clustering. International journal of image and data fusion, 3(4), pp. 319– 332.
Zyl, J.J. Van, 1989. Unsupervised classification of scattering mechanisms using radar polarimetry data. IEEE Transactions on Geoscience and Remote Sensing, Vol. 27, pp. 36–45.