*Corresponding author. Tel.:#1-201-692-7284; fax:# 1-201-692-7219.
E-mail address:[email protected] (S. Talluri).
A cone-ratio DEA approach for AMT justi
"
cation
Srinivas Talluri*, K. Paul Yoon
Department of Information Systems and Sciences, S.J. Silberman College of Business Administration, Fairleigh Dickinson University, H323D, 1000 River Road, Teaneck, NJ 07666, USA
Received 1 December 1998; accepted 1 July 1999
Abstract
Evaluation and selection of advanced manufacturing technology (AMT) is a complex decision making process which requires careful consideration of various performance criteria. Initially, the decision-maker must identify a feasible set of AMT candidates, which broadly meet the budget constraints and system requirements. The competitive priorities (cost,
time, quality, and#exibility) must then be set and matched against the performance variables in identifying preference
relationships. The"nal step involves the evaluation of alternative systems based on performance criteria and preference
relationships. This paper depicts the AMT selection process through an IDEF0 functional model. It utilizes a
combina-tion of a cone-ratio data envelopment analysis (CRDEA), which integrates decision-maker's preferences, and a new
methodological extension in data envelopment analysis (DEA). The applicability of the proposed model is illustrated by
using a real data set of industrial robots. ( 2000 Elsevier Science B.V. All rights reserved.
Keywords: AMT; DEA; Cone-ratios; Preference relationships; Relative e$ciency
1. Introduction
In order to respond quickly and e!ectively to the rapidly changing needs of the customer and to maintain a high level of competitiveness in the global arena, manufacturers all around the globe have sought the adoption of advanced manufactur-ing technologies (AMT) such as industrial robots,
#exible manufacturing systems (FMS), automated material handling (AMH) systems, etc. Although it seemed at"rst that the chief advantage of AMTs is labor saving, it was quickly realized by many manufacturers that AMTs result in improved
prod-uct quality, fast prodprod-uction and delivery, and increased product#exibility.
It is estimated that U.S. manufacturers have in-vested $32.3 billion in shop-#oor automation in 1990, and the levels of spending have increased since then. Because of growing magnitude of invest-ments in automation, the evaluation and selection of AMT is a problem that requires serious consid-eration. The selection procedure is a complex stra-tegic process involving many decision variables. The decision-maker must identify the critical per-formance attributes, preference relationships among the attributes, and appropriate evaluation models to be used in the selection process.
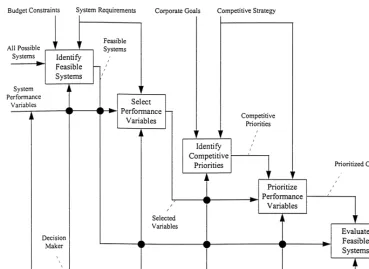
Fig. 1 depicts the corporation wise technology selection process through an IDEF0 functional model [1]. IDEF0 methodology allows for a systematic representation of steps involved in the
Fig. 1. Technology selection process.
decision making process, and e!ectively models the relationships between various phases of the pro-cess. The IDEF0 model for the technology selection process involves several activities such as identify feasible systems, select performance variables, identify competitive priorities, prioritize perfor-mance variables, and evaluate feasible systems. At each stage of this process inputs are transformed into outputs in the presence of some constraints. For example, in the"rst activity of the technology selection process that involves the identi"cation of feasible systems, the inputs that include all possible systems are evaluated in the presence of constraints such as budget and system requirements in deriving outputs which are the feasible systems. Similarly, in the prioritization of the performance variables, the inputs are the variables themselves, the constraints are competitive priorities and strategies, and the resulting outputs are prioritized constraints. The decision-maker acts as a mechanism in conducting this entire process.
the scope of this process, then new systems and/or other performance variables are considered for the re-evaluation process.
This paper aims at the"nal stage of the IDEF0 model, which is evaluation of feasible candidates. The evaluation process is performed by utilizing a combination of CRDEA and new methodological extensions in DEA. The primary advantage of this methodology is that it e!ectively integrates the decision-maker's preferences on output measures. The rest of the paper is organized as follows. Sec-tion 2 provides a literature review of the models used in AMT evaluation. Section 3 provides an introduction to the CRDEA model and its exten-sions. Section 4 presents the performance evalu-ation of industrial robots. Finally, the conclusions and future study are presented in Section 5.
2. Literature review
Several models have been proposed in the litera-ture on evaluation, justi"cation and selection of AMT. Le#ey [2], Leung and Tanchoco [3], Proc-tor and Canada [4], and Sarkis [5] have presented reviews on the evolution of justi"cation methodologies of capital projects in general, and manufacturing technology in particular. Proposed methodologies have included case studies, empiri-cal research, analytiempiri-cal, and simulation modeling. In this paper, we focus on the case of AMTs.
Canada [6] developed a weighted model for evaluating computer integrated manufacturing (CIM) systems by incorporating"nancial measures and certain intangible factors. Huang and Ghand-foroush [7] evaluated industrial robot vendors based on economic measures and some subjective factors. They assigned speci"c weights to objective and subjective factor measures in identifying the optimal choice. However, their model did not in-clude any technical robot performance measures. Imany and Schlesinger [8] compared linear goal programming (LGP) and ordinary least-squares (OLS) methods for robot selection. The perfor-mance measures included by them are cost, load capacity, velocity, and repeatability of the robot. They concluded that LGP model provides more stable results than OLS approach in the presence of
outliers. In addition, they stated that when several con#icting goals need to be considered, weighted priorities should be assigned to robot parameters. Frazelle [9] used the analytical hierarchy process (AHP) for evaluating material handling alterna-tives. According to Frazelle, a major advantage of AHP over simple weighted evaluation techniques is its accommodation of decision maker's inconsisten-cies on preference judgement. Siha [10] utilized multi-goal programming (0}1) and AHP for robot selection. The model included four priority levels with various goals in each level. Equal importance was assigned to robot performance measures such as repeatability, reach, and cost. Maimon and Fisher [11] developed an integer programming model and a rule based expert system for robot selection. Seidmann et al. [12] used a combination of multi-goal programming and AHP for the same problem.
Several researchers have utilized multi-attribute decision making (MADM) models for technology selection [13}16]. Most MADM models in AMT evaluation assume that preferences for technology attributes are independent of each other. But this is not true in case of AMTs such as robots where certain performance measures get worse as invest-ment cost decreases. Hence, the mutual preferential independence assumption of these models may be violated. Khouja [17] used DEA and MADM model together for technology selection. Although this two-phase model is innovative, there are cer-tain issues associated with the traditional DEA model used in this approach. The primary limita-tion of this model in the context of technology selection is that the simple radial e$ciency scores obtained from it may not lead to the selection of the best choice. Shang and Sueyoshi [18] utilized a combination of AHP and DEA for selection of
#exible manufacturing systems. Their model used AHP to restrict factor weights in DEA. However, they could not solve the di$culty with multiple optimum solutions.
and it is often a di$cult task for the decision maker to accurately assign numbers to preferences. Narasimhan and Vickery [19] pointed that it is a daunting task for the decision-maker to assess weight-ing information as the number of performance criteria increased. Therefore, a more robust mathematical technique that does not demand too much and too precise information, i.e., ordinal preferences instead of cardinal weights, from the decision-maker can strengthen the AMT evaluation process.
This paper depicts the AMT selection process through an IDEF0 functional model. It proposes a combination of a CRDEA model and a new methodological extension in DEA, while allowing for the incorporation of decision maker's prefer-ences. The chief advantage of the CRDEA model is that it does not demand exact weights from the decision-maker. It simply requires priority order among performance criteria.
3. Cone-ratio DEA model and extensions
DEA is a mathematical programming technique, proposed by Charnes et al. [20], which evaluates the relative e$ciencies of a homogeneous set of decision making units (DMUs) in the presence of multiple inputs and outputs. Over the years several extensions and new models have been proposed to improve the discriminatory power of DEA. CRDEA is one such model that allows for integra-tion of decision maker's preferences.
3.1. Traditional CRDEA model
Thompson et al. [21] introduced the concept of assurance regions (ARs) in DEA. According to them, ARs can be classi"ed into cone-ratio ARs and non-cone-ratio ARs. Polyhedral cone-ratios are usually expressed in intersection form or in sum form [22]. Non-cone-ratio ARs can be expressed as linked-cones, which link inputs and outputs, and also as non-Archimedean and lower bound multi-pliers. A parallel study conducted by Charnes et al. [22] lead to the development of the CRDEA model. In the CRDEA model, ARs are speci"ed by de"ning bounds on weights that re#ect the relative importance of di!erent inputs and outputs. These
weight constraints are represented in the form of linear inequalities and appended to the ratio DEA model. The following formulation is the CRDEA model with the input and output cones speci"ed by (1.3) and (1.4), respectively:
max+sk/1vkykp
wherepis the test DMU which is being evaluated,
s represents the number of outputs, m represents the number of inputs,nis the number of decision making units,y
ki is the amount of outputk
prod-uced by DMUi,x
jiis the amount of inputjused by
DMUi,v
kis the weight given to outputk,uj is the
weight given to inputj, anda,b,a,bare non-nega-tive scalars.
The above fractional program can be converted to the linear programming problem shown as (2):
max +s
that maximize the output to input ratio, but at the same time the constraint set prevents the e$ cien-cies of the nDMUs computed with these weights from exceeding a value of`onea. A relative e$ cien-cy score of `oneaindicates that the DMU under consideration is e$cient, whereas a score less than
`oneaindicates that it is ine$cient.
The above CRDEA model has certain advant-ages over the ratio DEA model. The e$ciency score obtained from the ratio DEA model is referred to as the simple radial e$ciency. In the estimation of simple radial e$ciency, the ratio model allows for unrestricted factor weights (v
k and uj). This may
result in allowing a DMU to achieve a high relative e$ciency score by involving in unreasonable weighting scheme [23,24]. Such DMUs heavily weigh few favorable measures and completely ignore the other inputs and outputs. To overcome this problem CRDEA model allows for weight restrictions, which signi"cantly improve the dis-criminatory power of DEA.
Although the cone restrictions e!ectively dis-criminate between e$cient and ine$cient DMUs, they do not allow for a ranking of e$cient units. This poses a problem to the decision-maker in situations where there are multiple e$cient units. Cross-e$ciency analysis in DEA can be utilized in such situations to discriminate between e$cient units [25]. The cross e$ciency matrix (CEM) pro-vides information on how well a DMU is perform-ing with respect to the optimal DEA weights of other DMUs. The element in theith row and jth column of the matrix indicates how well DMUjis performing when evaluated with the optimal weights of DMU i. A DMU with several high e$ciencies along its column in the CEM is con-sidered to be a superior performer, and a DMU with several low e$ciencies can be regarded as a relatively poor performer. The column means can be computed as an index to identify the best choice.
3.2. Methodological extensions
Although the CRDEA model e!ectively inte-grates decision maker's preferences into the evalu-ation process, it does not solve the problem of multiple optimum solutions in DEA. This problem occurs in DEA if there are more than one set of
input/output weights that maximize the e$ciency of a DMU. In such situations the usefulness of CEM, which is derived from these weights, will be undermined. To overcome these problems and to provide a robust set of weights that not only maxi-mize the e$ciency of a DMU but also minimize the e$ciencies of its competitors we provide method-ological extensions to the CRDEA model case. The formulation shown as problem (3) is an extension to the Doyle and Green's [26] aggressive formula-tion: cone scenarios, ec is an index that represents the number of e$cient DMUs with respect to conec, and pc is the test DMU. The other notation for inputs and outputs is same as before.
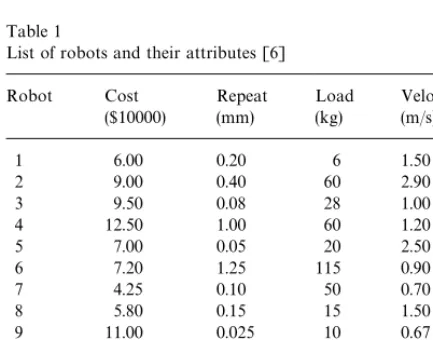
Table 1
List of robots and their attributes [6]
Robot Cost
Scaled robot data set
Robot Cost Repeat Load Velocity
1 0.789 0.590 0.134 1.230
2 1.184 0.295 1.336 2.377
3 1.250 1.474 0.623 0.820
4 1.645 0.118 1.336 0.984
5 0.921 2.358 0.445 2.049
6 0.947 0.094 2.560 0.738
7 0.559 1.179 1.113 0.574
8 0.763 0.786 0.334 1.230
9 1.447 4.717 0.223 0.549
10 0.658 0.590 0.890 0.820
11 0.526 0.236 0.223 0.410
12 1.118 0.094 2.226 0.738
13 1.184 0.472 1.558 0.533
Problem (3) identi"es weights that not only maximize the e$ciency score of a DMU, but also minimize the e$ciencies of all other CRDEA e$ -cient DMUs in some sense (by minimizing the e$ciency of the composite DMU). We did not include the ine$cient DMUs in problem (3), be-cause if a system is ine$cient then it is not con-sidered as a potential candidate for selection.
The primary contribution of the above model is that it provides robust input/output weights for each of the e$cient DMUs that can be utilized for cross-e$ciency calculations to discriminate and se-lect DMUs with best operating practices.
4. Performance evaluation of industrial robots
The robot data set published in Siha [10], shown in Table 1, is utilized to illustrate the use of the CRDEA model for technology selection. Thirteen robots are considered as the feasible alternatives. The robot performance measures considered for the analysis are cost, repeatability, load capacity, and velocity. These measures are not exhaustive by any means, but frequently used in robot's perfor-mance evaluation. Repeatability can be de"ned as the ability of the robot to return repeatedly to a learned point in its work envelope, which is expressed in millimeters (mm). Load capacity in kilograms (kg) is the maximum load that the robot
can lift, which includes the actual load and the gripper weight. Velocity of the robot is the distance covered by the robot-arm per unit time (m/s).
In this analysis, cost is treated as an input to the CRDEA model, because from the decision maker's standpoint it represents the investment required to purchase the system. Repeatability, load capacity, and velocity are treated as outputs, because they are measures that indicate the ability of the system in performing various tasks.
In DEA, large value of an output is considered to be better than small. Since smaller values of re-peatability indicate better performance than larger values, we have used inverse of repeatability in our computations. Also, we have re-scaled the entire data set by dividing each performance variable value by its respective mean to remove any scale e!ects, especially when weight restrictions are spe-ci"ed in the CRDEA model. This is a normalization procedure that is commonly used in DEA compu-tations. The scaled data set is shown in Table 2.
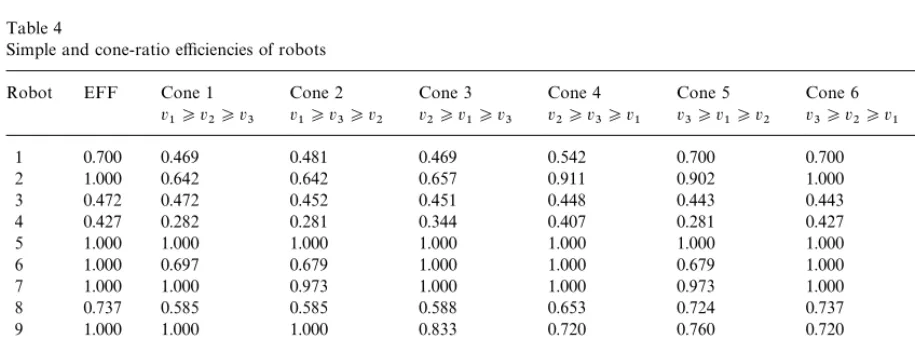
Table 4
Simple and cone-ratio e$ciencies of robots
Robot EFF Cone 1 Cone 2 Cone 3 Cone 4 Cone 5 Cone 6 Mean
v
1*v2*v3 v1*v3*v2 v2*v1*v3 v2*v3*v1 v3*v1*v2 v3*v2*v1
1 0.700 0.469 0.481 0.469 0.542 0.700 0.700 0.560
2 1.000 0.642 0.642 0.657 0.911 0.902 1.000 0.792
3 0.472 0.472 0.452 0.451 0.448 0.443 0.443 0.452
4 0.427 0.282 0.281 0.344 0.407 0.281 0.427 0.337
5 1.000 1.000 1.000 1.000 1.000 1.000 1.000 1.000
6 1.000 0.697 0.679 1.000 1.000 0.679 1.000 0.843
7 1.000 1.000 0.973 1.000 1.000 0.973 1.000 0.991
8 0.737 0.585 0.585 0.588 0.653 0.724 0.737 0.645
9 1.000 1.000 1.000 0.833 0.720 0.760 0.720 0.839
10 0.829 0.669 0.663 0.682 0.801 0.663 0.829 0.718
11 0.400 0.313 0.313 0.318 0.373 0.350 0.400 0.345
12 0.767 0.531 0.519 0.747 0.762 0.519 0.767 0.641
13 0.532 0.422 0.415 0.532 0.532 0.411 0.530 0.474
Table 3
DEA LP formulation for robot selection Max 0.59v
4.1. Ratio DEA model results
Initially, the ratio DEA model without the weight restrictions is used and simple radial e$ -ciency scores are obtained for all the robots. The DEA formulation with robot 1 as the test DMU is shown in Table 3. The e$ciency scores of the thir-teen robots are shown under the heading EFF in Table 4. DEA identi"ed robots 2, 5, 6, 7 and 9 to be e$cient with a relative e$ciency score of `onea. The other eight robots were ine$cient with e$ cien-cy scores of less than`onea. These evaluations did
not include any decision-maker's preferences (weight restrictions).
It is a di$cult task for the decision-maker to select the optimal choice from the"ve simple radial e$cient robots because:
(i) There may be robots indulging in an inappro-priate weight scheme among the "ve e$cient robots. Thus, an arbitrarily selected e$cient robot may be a sub-optimal choice. Also, the selected robot may not be the one that best meets the decision-maker's requirements. (ii) Alternately, the decision-maker may have to
assign speci"c weights to the attributes of the
"ve e$cient robots in selecting the optimal choice. But from earlier discussions, it may be a di$cult task to obtain exact weights for each of the attributes.
Thus, using simple radial e$ciency scores alone may not guarantee the selection of the best robot. Hence, we need to modify the model to allow for the decision-maker's preferences.
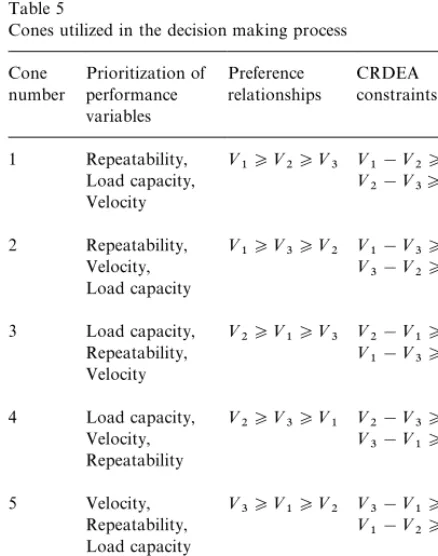
Table 5
Cones utilized in the decision making process Cone
CEM for Cone 1 analysis
Robot 5 7 9
5 1.000 0.973 0.720
7 0.742 1.000 0.833
9 0.785 0.647 1.000
Mean 0.843 0.873 0.851
Higher velocity of robot-arm results in lower pro-cessing times, which decreases the overall product lead-time. Finally, higher load capacity results in higher load#exibility. This is because the ranges of load capacities that can be handled by the robot are higher thereby resulting in improved #exibility. Based on this reasoning, we have selected six pos-sible cone scenarios (3! cases), shown in Table 5, where each of them can be represented as a con-straint set in the CRDEA model. For example, cone 1 represents the situation where the decision maker sets quality,#exibility, and lead time in that order as the competitive priorities thereby allowing higher weight for repeatability (<
1) over load capa-city (<
2), and load capacity (<2) over velocity (<3). This prioritization is represented as a set of prefer-ence relationships, which are incorporated into the CRDEA model as linear constraints. Although in the construction of the cones we did not include actual managerial information in terms of more
speci"c and appropriate bounds, this information if available can be easily integrated into the CRDEA model. However, we did specify cones that are e!ectively linked to the competitive priorities, and allow for increased weights on higher priority vari-ables.
4.2. CRDEA model results
Cone 1 analysis depicts the scenario where the decision-maker sets the competitive priorities thereby allowing higher weight for repeatability (<
1) over load capacity (<2), and load capacity (<
2) over velocity (<3). The results are depicted in Table 4 under the heading`Cone 1a. Robots 5, 7, and 9 are identi"ed to be e$cient with a relative e$ciency score of`onea. All the other robots are ine$cient with relative e$ciency scores of less than
`onea. Thus, the decision-maker must identify the best robot from the three e$cient choices.
Problem (3) is utilized to identify input/output weights for Robots 5, 7, and 9, which are used in the evaluation of the CEM. The corresponding CEM of the order 3]3 is depicted in Table 6. Based on
this CEM, the column means of the CEM for Robots 5, 7, and 9 are 0.843, 0.873, and 0.851, respectively. Robot 7 achieved the highest mean cross-e$ciency score of 0.873. Thus, the optimal choice for the decision-maker is Robot 7, which is evaluated to be the best performer by the other two e$cient robots.
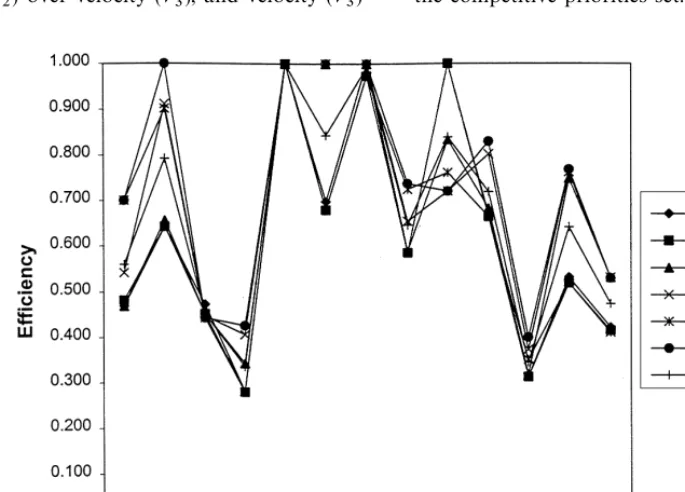
Fig. 2. Comparison of robot e$ciencies. considered. The decision-maker can identify the
next best option based on the highest cross-e$ cien-cy mean, which in this case is Robot 9.
In cone 2 analysis the decision-maker allows higher weight for repeatability (<
1) over velocity (<
3), and velocity (<3) over load capacity (<2). CRDEA identi"ed Robots 5 and 9 to be e$cient, and the other eleven robots are evaluated to be ine$cient. The cross-e$ciency means of the Robots 5 and 9 are 0.893 and 0.860, respectively. Thus, the decision-maker must select Robot 5 as the optimal choice.
In cone 3 analysis, we assume that the decision-maker sets the competitive priorities thereby allow-ing higher weight for load capacity (<
2) over repeatability (<
1), and repeatability (<1) over velocity (<
3). CRDEA identi"ed Robots 5, 6 and 7 to be e$cient, and the other ten robots are evalu-ated to be ine$cient. The cross-e$ciency means of the Robots 5, 6, and 7 are 0.640, 0.788, and 0.903, respectively. Therefore the optimal choice for the decision-maker is Robot 7.
Cone 4 analysis allows for higher weight for load capacity (<
2) over velocity (<3), and velocity (<3)
over repeatability (<
1). CRDEA identi"ed Robots 5, 6 and 7 to be e$cient, and the other ten robots are evaluated to be ine$cient. The cross-e$ciency means of the Robots 5, 6, and 7 are 0.616, 0.893, and 0.903, respectively. Thus, the decision-maker must select Robot 7 as the optimal choice.
Cone 5 analysis illustrates the situation where the decision-maker allows higher weight for velo-city (<
3) over repeatability (<1), and repeatability (<
1) over load capacity (<2). In this analysis only Robot 5 is identi"ed to be e$cient. Since no other robot is e$cient, there is no need for cross-e$ cien-cy analysis. The decision-maker can select Robot 5 as the optimal choice.
Finally, in cone 6 analysis the decision-maker allows higher weight for velocity (<
3) over load capacity (<
2), and load capacity (<2) over repeata-bility (<
1). CRDEA identi"ed Robots 2, 5, 6, and 7 to be e$cient. The mean cross-e$ciency means of Robots 2, 5, 6, and 7 are 0.886, 0.944, 0.713, and 0.760, respectively. So, the decision-maker can se-lect Robot 5 as the optimal choice.
the decision-maker to identify the optimal choice based on the critical performance variables and system requirements that are vital for satisfying the corporate goals and long-term strategy of the or-ganization. If the decision maker is interested in a good overall performer then they have to go with Robot 5, which performed consistently well across all cones and achieved a mean score (mean of all six cone e$ciencies) of 1.000, shown in Table 4 under the heading `Meana. Fig. 2 helps facilitate the comparison of the 13 robots across all the six cone scenarios. It clearly demonstrates the variabil-ity and consistency in the performance of the ro-bots with respect to the decision-maker's preferences.
5. Conclusions and future study
In this paper a CRDEA model is proposed for AMT evaluation and selection. The strength of the model is in incorporating the decision-maker's in-put and e!ectively discriminating between e$cient and ine$cient technologies. The limitations of the ratio DEA model are illustrated, and its results are compared to that of the CRDEA model. The paper also presents a new methodological extension in DEA to improve the discriminatory power of the CRDEA model.
As an extension to this study, it will be interest-ing to investigate the impact of the linked-cone structures, linking inputs and outputs, on the deci-sion making process. However, the decideci-sion-maker must be cautious when using these linked-cone structures because of possible infeasibility prob-lems. For more information on application of lin-ked-cones, see Thompson et al. [27].
One of the limitations of this study is that the cone restrictions are not derived from actual mana-gerial experiences, but we did provide cones that are e!ectively linked to the competitive priorities. Although it may be a di$cult task to obtain cone ratios from actual managerial practice, it is relative-ly easier to obtain these types of bounds than specifying exact weights. We would like to point out that this model can easily integrate such bounds into the decision making process, if avail-able. Another limitation of this research is that the
model does not allow for the incorporation of qualitative factors into the selection process.
Although DEA was applied extensively in evalu-ating the e$ciencies of hospitals, schools, banks, health insurance, and other pro"t and non-pro"t organizations, its application in production and operations"eld has been very limited. This paper illustrates its importance as a decision making tool in the area of technology management.
References
[1] J. Sarkis, L. Lin, A general IDEF0 model for the strategic implementation of CIM systems, International Journal of Computer Integrated Manufacturing 7 (2) (1994) 100}115. [2] F. Le#ey, Strategic methodologies of investment appraisal of AMT projects: A review and synthesis, Engineering Economist 41 (4) (1996) 345}363.
[3] L.C. Leung, J.M.A. Tanchoco, Replacement decision based on productivity: An alternative to the MAPI method, Journal of Manufacturing Systems 2 (2) (1983) 89}114.
[4] M.D. Proctor, J.R. Canada, Past and present methods of manufacturing investment evaluation: A review of the em-pirical and theoretical literature, Engineering Economist 38 (1) (1992) 45}58.
[5] J. Sarkis, The Evolution to Strategic Justi"cation of Ad-vanced Manufacturing Systems, in: H.R. Parsaei et al. (Eds.), Economic and Financial Justi"cation of Advanced Manufacturing Technologies, Elsevier Publishing, Am-sterdam, 1992, pp. 141}163.
[6] J. Canada, Non}traditional method for evaluating CIM opportunities assigns weights to intangibles, Industrial Engineering 18 (3) (1986) 66}71.
[7] P. Huang, P. Ghandforoush, Procedures given for evaluat-ing, selecting robots, Industrial Engineering 16 (4) (1984) 44}48.
[8] M.M. Imany, R.J. Schlesinger, Decision models for robot selection: A comparison of ordinary least squares and linear goal programming methods, Decision Sciences 20 (1989) 40}53.
[9] E. Frazelle, Suggested techniques enable multi-criteria evaluation of material handling alternatives, Industrial Engineering (1985) 42}48.
[10] S. Siha, A decision model for selecting mutually exclusive alternative technologies, Computers and Industrial Engin-eering 24 (3) (1993) 459}475.
[11] O. Maimon, E. Fisher, Analysis of robotic technology alternatives, Annual Industrial Engineering Conference Proceedings, 1985.
[13] V.P. Agrawal, V. Khohl, S. Gupta, Computer aided robot selection: A multiple attribute decision making approach, International Journal of Production Research 29 (1991) 1629}1644.
[14] S.M. Jones, C.J. Malmborg, M.H. Agee, Decision support system used for robot selection, Industrial Engineering 17 (1985) 66}73.
[15] B.O. Nnaji, M. Yannacopoulou, A utility theory based robot selection and evaluation for electronic assembly, Computers and Industrial Engineering 14 (1988) 477}493. [16] G. Kim, C.S. Park, K.P. Yoon, Identifying investment opportunities for advanced manufacturing systems with comparative-integrated performance measurement, Inter-national Journal of Production Economics 50 (1997) 23}33. [17] M. Khouja, The use of data envelopment analysis for technology selection, Computers and Industrial Engineer-ing 28 (1) (1995) 123}132.
[18] J. Shang, T. Sueyoshi, A uni"ed framework for the selec-tion of#exible manufacturing system, European Journal of Operational Research 85 (2) (1995) 297}315.
[19] R. Narasimhan, S.K. Vickery, An experimental evaluation of articulation of preferences in multiple criterion decision-making, Decision Sciences 19 (1988) 880}888.
[20] A. Charnes, W.W. Cooper, E. Rhodes, Measuring the e$ciency of decision making units, European Journal of Operational Research 2 (6) (1978) 429}444.
[21] R.G. Thompson, F.D. Singleton, R.M. Thrall, B.A. Smith, Comparative site evaluations for locating a high-energy physics laboratory in Texas, Interfaces 16 (1986) 35}49.
[22] A. Charnes, W.W. Cooper, Z.M. Huang, D.B. Sun, Poly-hedral cone-ratio DEA models with an illustrative applica-tion to large commercial banks, Journal of Econometrics 30 (1990) 91}107.
[23] R.G. Dyson, E. Thannassoulis, Reducing weight#exibility in data envelopment analysis, Journal of Operational Re-search Society 39 (6) (1988) 563}576.
[24] Y.H.B. Wong, J.E. Beasley, Restricting weight#exibility in DEA, Journal of Operational Research Society 41 (9) (1990) 829}835.
[25] T.R. Sexton, R.H. Silkman, A. Hogan, Data envelopment analysis: Critique and extensions, in: H. Richard Silkman (Ed.), Measuring E$ciency: An Assessment of Data Envelopment Analysis, New Directions of Program Evaluation, Jossey Bass, San Francisco 32 (1986). [26] J. Doyle, R. Green, E$ciency and cross-e$ciency in DEA:
derivations, meanings, and uses, Journal of Operational Research Society 45 (5) (1994) 567}578.