CHAPTER III
RESEARCH METHODOLOGY
This chapter elaborates the research methodology which was employed in
the present study. It consists of the formulation of the problem, research design,
data collection, data analysis, and data presentation.
3.1Formulation of The Problem
The study was conducted to answer these following questions:
1) How is flood represented visually and verbally in the selected Indonesian
online newspapers?
2) What does the verbal and visual representation signify?
3.2Research Design
This study uses a descriptive qualitative method because the data were in
the form of images and words, not numerical data. According to Muhammad
(2011), qualitative method is the method to analyse texts deeply, clearly, and
widely. This study analysed texts to reveal the representation of flood in online
newspapers deeply. The data were in the form of visual and verbal texts.
In addition, Creswell (2008) argues that qualitative research is a research
method in which the researcher relies on the views of the participants, collects
data consisting of words, describes and analyses the words, and conducts the
questions. Furthermore, Hammersley (1989) states that qualitative method is the
method using unstructured forms of data collection. Additionally, the data are
obtained from several sources (Emilia, 2009). Hammersley (1989) also suggests
that qualitative method often involves an emphasis on process rather than
structures.
In answering the research questions, the study uses Kress and van
Leeuwen‟s Framework, Reading Images (2006) to analyse the visual texts. The
study also uses Sistemic Functional Linguistics as proposed by Halliday (1994) to
3.3Data Collection
The data were in the form of words, phrases, sentences, and pictures which
were selected from Indonesian online newspapers: Republika.co.id on 21 January
2013, Kompas.com on 28 January 2013, Radarcirebon.com on 17 January 2013,
and Harianjogja.com on 5 March 2013. They were selected because the issues
were about the news of flood which was the headlines at that time.
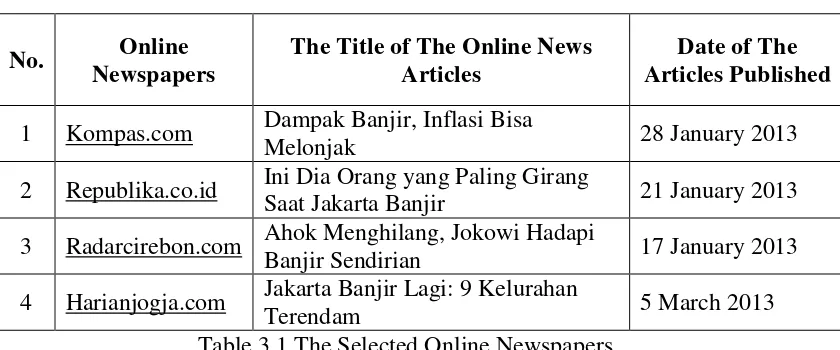
In collecting the data, first, the online newspapers were downloaded and
stored in a hard disk. The selected online newspapers were four news articles in
each online newspaper about flood in Jakarta. Here is the table that presents the
four selected online news articles about flood taken from Kompas.com,
Republika.co.id, Radarcirebon.com, and Harianjogja.com.
No. Online
Newspapers
The Title of The Online News Articles
Date of The Articles Published
1 Kompas.com Dampak Banjir, Inflasi Bisa
Melonjak 28 January 2013
2 Republika.co.id Ini Dia Orang yang Paling Girang
Saat Jakarta Banjir 21 January 2013
3 Radarcirebon.com Ahok Menghilang, Jokowi Hadapi
Banjir Sendirian 17 January 2013
4 Harianjogja.com Jakarta Banjir Lagi: 9 Kelurahan
Terendam 5 March 2013
Table 3.1 The Selected Online Newspapers
Kompas.com is the online newspaper which comes from Kompas
newspaper. Kompas is one of widely read national newspapers in Indonesia. The
reason of selecting Kompas.com online newspaper is because it can provide news,
information, and representation of flood nationally. Republika.co.id is the online
version of Republika newspaper. Republika is another widely read national
newspaper in Indonesia. Republika.co.id was selected because it can also
distribute news, information, and representation of flood nationally. Additionally,
Harianjogja.com and Radarcirebon.com come from Harian Jogja and Radar
information, and representation of flood regionally. These four different
newspapers represent flood both nationally and regionally.
The online news articles were converted into word texts in order to ease
the analysis. The unit of analysis of the verbal texts is clause. Additionally, the
visual texts were also downloaded and stored in a hard disk. The data analysis will
be described in the next section.
3.4Data Analysis
The data in this study were in the form of pictures (visual texts) and
words, phrases, sentences (verbal texts). The data in the form of visual texts were
analysed by using Kress and van Leeuwen‟s framework (2006). The data in the
form of verbal texts were then analysed by using Systemic Functional Linguistics
as proposed by Halliday (1994). The data are analysed to reveal the representation
of flood visually and verbally. After the representation was revealed, the data
were then analysed to discover the signification of both visual and verbal
representation of flood.
The study applies two steps of analysis. The first step was analysing the
visual texts. This step shows how flood is represented in the pictures, what is
happening in the pictures, and who are involved in the events visually. Afterward,
the second step is analysing the verbal texts. This step uses Systemic Functional
Linguistics as a tool for analysing the texts which were in the form of words,
phrases, and sentences. Additionally, this step also shows how flood is
represented verbally.
3.5Data Presentation
In this point, the visual and verbal texts analyses are elaborated in the
table. The analysis contains the description which describes the picture.
Furthermore, the analysis also contains signification which elaborates the meaning
of the description. The analysed data are then presented in tables such as the
Tukang ojek saat ngetem di pangkalannya (Caption).
Picture 3.1 The Picture of “Ini Dia Orang yang Paling Girang Saat Jakarta Banjir”
(Title) Republika.co.id Article Description
(Visual Text) Signification
This is a Pangkalan Ojek
(Ojek Terminal). This place is used
for ojek riders to wait for the
passengers. The ojek rider is at the
central of the picture wearing a red
jacket. He is sitting on his
motorcycle. He is looking at the
viewers. There is also another
person wearing a white shirt. He is
a shopkeeper. He is sitting on the
participant is foregrounded and bigger in
size compared to other, the participant
becomes more salient. In relation to this,
Kress and van Leeuwen (2006) argue that
participant who is positioned at the central
of the picture is called „salience‟. The most
salient element or participant in the picture
is made to attract the viewers‟ attention
is waiting for his customers. The
vector in this picture is realized by the gaze
of the ojek rider to the viewers. It means
that the vector positions the ojek rider as „reacter‟. Reacter is “the active participant in reaction processes whose look creates the eyeline” (Kress & van leeuwen, 2006). In this picture, the ojek rider is looking in front
of him. His gaze is directed toward the
Article: Banjir yang melanda
Ibukota Jakarta sejak awal pekan
The message of the layout composition and
lalu Jakarta
Actor Material Goal
sejak awal pekan lalu
since the last week
Circ: Time
Meaning: Based on the analysis, it can be understood that “tukang ojek” and “banjir” are the actors of the event. The analysis of
the caption shows that there is only one
participant; that is the Actor. The actor is
the ojek rider (tukang ojek) in the caption
which does not have goal. According to
Kress & van Leeuwen (2006, p. 63), when
an image has one participant, this is called
„a non-transactional process‟. Furthermore,
the analysis of the article shows that there
are two participants; those are the Actor and
the Goal. The actor is flood (banjir) in the
article which has goal; that is Ibukota
Jakarta. According to Kress & van Leeuwen
(2006, p. 63), when image has two
participants, one is the Actor and the other is the Goal. This process is called „a
transactional process‟.
Table 3.2 The Example of Flood in the Verbal and Visual Texts Analysis
Based on the table, the visual analysis reveals that flood is the situation
which can bring positive effect for people in Jakarta. When Jakarta was flooded,