SUPPORTING STUDENTS’
REASONING IN ADDING FRACTIONS
THROUGH MEASUREMENT ACTIVITIES IN GRADE FOUR OF
PRIMARY SCHOOL
MASTER THESIS
Lathiful Anwar
09715010STATE UNIVERSITY OF SURABAYA
POSTGRADUATE PROGRAM
SUPPORTING STUDENTS’
REASONING IN ADDING FRACTIONS
THROUGH MEASUREMENT ACTIVITIES IN GRADE FOUR OF
PRIMARY SCHOOL
MASTER THESIS
A thesis submitted in partial fulfillment of the requirements for the degree of Master of Science in Master Program of Mathematics Education, State University of Surabaya
Lathiful Anwar
09715010STATE UNIVERSITY OF SURABAYA
POSTGRADUATE PROGRAM
Table of Contents
Chapter II Theoretical Framework ... 7
A. Addition of Fractions ... 7
1. Interpretation of Fractions ... 9
2. Comparing and Equivalent Fractions ... 9
3. Addition of Fractions through Measurement Length ... 10
B. Realistic Mathematics Education (RME) ... 14
1. Five characteristics of RME ... 15
2. Three principles of RME ... 19
C. Addition of fractions in the Indonesian curriculum for elementary school ... 20
D. Hypothetical Learning Trajectory ... 22
1. Mathematical Learning Goals ... 23
2. Planned Instructional Activities ... 23
3. A Conjectured Learning Activities ... 26
Chapter III Design Research Methodology ... 51
A. Phase 1: Preparation and Design ... 52
B. Phase 2: Teaching Experiment ... 52
C. Phase 3: Retrospective Analysis ... 53
D. Reliability and Validity ... 54
E. Description of Experimental Subject and Time line ... 55
F. Data Collection ... 57
Chapter IV Retrospective Analysis ... 59
A. Pilot Experiment ... 60
2. Hypothetical Learning Trajectory II (revision of HLT I) ... 77
3. Progressive Design of HLT I and HLT II ... 101
B. Teaching Experiment ... 101
1. Measurement length as concrete context as the base of mathematical activity... 102
a. Measuring the length of stick part(s) as activity supporting students to interpret fractions as measure ... 103
b. Comparing the length of part of coloring stick supports students reasoning in comparing fractions such as comparing fractions and equivalence of fractions ... 106
c. Cutting Rope supports students’ acquisition of the interpretation fractions as operator ... 112
d. Guessing the length of rope and its contribution in supporting students’ acquisition of the idea of common denominator. ... 114
e. Summary of the measurement length activities as supporting activities to help students’ thinking and reasoning in addition of fractions. ... 116
2. Drawing to visualize the situation as a bridge from contextual problem to the mathematical formal of addition of fractions. ... 117
3. Solving addition of fraction with same denominator problem using bar model ... 121
4. Solving addition of fraction with different denominator problem using a bar model ... 124
C. Local Instructional Theory ... 132
D. Discussion ... 134
1. Phenomenological Didactical ... 134
2. Interactivity: Teacher’s Role and Students’ Social Interaction ... 135
3. Emergent Modeling ... 137
Chapter V Conclusion, the Weakness of the Research and Discussion ... 138
A. Conclusions ... 138
B. Recommendation ... 143
1. Classroom setting ... 143
2. Realistic Mathematics Educations as approach ... 144
List of Figures Chapter II Theoretical Framework
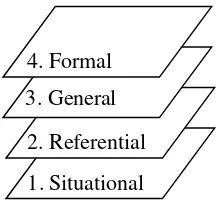
2.1.Levels of emergent modeling from situational to formal reasoning .. 19
2.2.Learning line ... 24
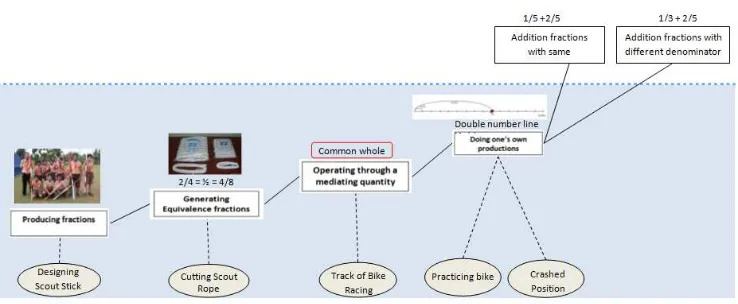
2.3.The main frame work of measurement length activities for learning addition of fractions ... 25
2.4.Scout stick ... 28
2.5.Scout rope and tent ... 35
2.6.Crashed Bike ... 45
Chapter III Methodology 3.1. Reflexive relation between theory and experiments (Gravemeijer & Cobb, 2006) ... 51
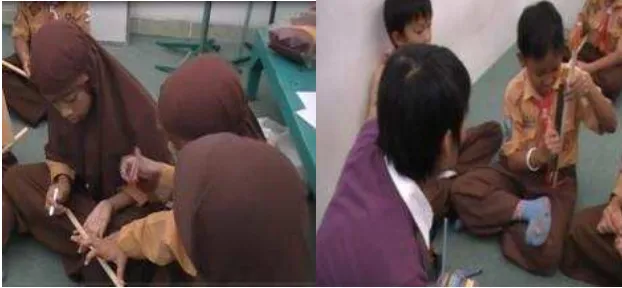
Chapter IV Retrospective Analysis 4.1.Students measured and divided by the ruler to use and stick their fingers ... 61
4.2.Discussion among teacher and students about the equivalence of fractions ... 63
4.3.Salsa’s calculation ... 65
4.4.Ayu’s drawing/model as representation of the rope ... 66
4.5.Ilham’s work in finding the length of the track such that can divided into 3 and 4 parts ... 68
4.6.Ayu’s drawing/representation of the track of bike racing ... 70
4.8.Ilham’s work in determining the addition of fractions with same denominator by drawing stick, bar/double number line model in
thinking and reasoning ... 71
4.9.Student’s draw as representation of situation ... 72
4.10. student’s mathematical language of the addition of fractions problem ... 73
4.11. addition of fractions with different denominator strategy of Salma, Rafee, Ilham, and Rio. ... 73
4.12. Salsa’s Strategy in addition of fractions with different denominator ... 73
4.13. Ilham’s strategy in determining the addition fractions with different denominator, 1/3 + 3/5 = … ... 75
4.14. Scout stick ... 77
4.15. Scout rope and tent... 88
4.16. A bundle of scout rope ... 92
4.17. Crashed Bike ... 95
4.18. Work of Akzal’s group in interpreting fractions as measure ... 105
4.19. Salsa’s strategy in comparing fractions ... 110
4.20. Ayu’s work in comparing 2/3 and ¾ ... 111
4.21. Akzal’s work in determining 1/3 of 15 meters and 2/5 of 15 meters ... 113
4.23. a bar model as the models-of situation that relates the contextual situation, coloring stick. ... 120 4.24. a bar model as the models-for mathematical reasoning within
fractions relations with jump on the bar ... 120 4.25. Akzal’s work in addition of fractions with same denominator ... 122 4.26. Fahri’s darwing of visualization as model to reason ... 123 4.27. A bar model used by students to visualize the contextual situation. 125 4.28. A bar model used by students to reason about their idea and
strategy in solving problem ... 126 4.29. Work of Akzal’s group in solving the addition of fractions with
different denominator problem, 2/3 + ¼ ... 128 4.30. Akzal’s work in solving the addition of fractions with different
List of Tables Chapter II Theoretical Framework
Table 2.1. Addition of fractions for elementary school in the Indonesian
curriculum... 21
Table 2.2. The mathematical learning goals ... 23
Table 2.3. Conjecture of students’ learning process ... 26
Chapter III Methodology Table 3.1. Success indicators of designing the instructional activities (hypothetical learning trajectory) ... 54
Table 3.2. The timeline of the research ... 55
Table 3.3. Outline of data collection ... 58
Chapter IV Retrospective Analysis Table 4.1. List of Students in pilot experiment ... 60
Table 4.2. Achievement of success indicators at the first cycle ... 77
Table 4.3: the progressive design of HLT I and HLT II ... 101
Table 4.4. Achievement of success indicators at the second cycle ... 131
1 ABSTRACT
Anwar, Lathiful. 2011. Supporting Students’ Reasoning in Adding Fractions through Measurement Activities in Grade Four of Primary School. Thesis, Mathematics Educations Study Program, Postgraduate Program of Surabaya State University. Supervised by: (I) Prof. Drs. Ketut Budayasa, Ph.D., and (I) Prof. Dr. Siti M. Amin, M.Pd..
Keyword: addition of fractions, students’ reasoning, design research, measurement activities, measure, operator, emergent modeling
One of reasons why fractions are a topic which many students find difficult to learn is that there exist many rules calculating with fractions. Some previous researcher confirmed that the problem which students encounter in learning fraction operations is not firmly connected to concrete experiences.
For this reason, a set of measurement length activities was designed to provide concrete experiences in supporting students’ reasoning in addition of fractions, because the concept of fractional number was derived from measuring. This design research aims to investigate how measurement activities could support students’ reasoning and reach the mathematical goals of addition of fractions. Consequently, design research is chosen as an appropriate means to achieve this research goal and a sequence of instructional activities is designed and developed based on the investigation of students’ learning processes. Students and a teacher of grade 4 in elementary school in Indonesia (i.e. SD Islam At Taqwa Surabaya) are involved in this research.
The result of the teaching experiments showed that measuring activities could stimulate students to acquire the idea of a addition of fractions. Furthermore, the strategies and drawing as visualization of situation used by students in solving problem could gradually be developed, through emergent modeling, into a bar model
2
Chapter I
Introduction
A. Background
There are many researches in mathematics education that paid attention in the area of “understanding of fraction”. The reason is that because fraction is a topic in which many teachers find difficult to understand and teach (Ma, 1999), and many students find difficult to learn (Clarke, Roche, Mitchell & Sukenik, 2006; Gould, 2005; Streefland, 1991). Among the factors that fractions in particular difficult to understand are their many representations and interpretations (Kjlpatrick, Swafford, & Findell, 2001).
Hasenmann (1981) and Keijzer (2003) found that one of the reasons why fractions is difficult for children is that there exist many rules in calculating fractions, which are more complicated than those for natural number. In addition, memorizing rules, concepts and lack of knowledge of basic concepts brings the difficulties in using the knowledge. Consequently, these difficulties cause students to do operations instead of understanding the mathematical concepts and making sense the operations of fractions.
3 for explaining and solving mathematics problems, while students remain passive and simply copy what their teacher writes on the black board. In addition, mathematics problems used in assessment activities focus merely on algorithms and procedures and they lack elements of practical applications (Suryanto, 1996). Consequently, students have been trained for the skills and should have mastered such procedures even they do not ‘understand’.
However, mastering the procedure is also important, but mastering the procedure without understanding it is worthless. This is the reason why; there is a need to emphasize a shift-thinking from procedure to understanding. Hasemann (1991), Kamii & Klark (1995), and Streefland (1991) confirmed that the problems that students encounter in learning fractions, especially when operations on fractions are not firmly connected to concrete experiences or significant situations. Consequently, in exploring the question of how to facilitate the transition process from concrete experiences via modeling fractions to formal reasoning and understanding several fraction, Explorative activities could be mentioned. It is known that the concept of natural numbers was derived from counting and the concept of fractional number was derived from measuring (Freudenthal, 1983; Streefland, 1991).
4 research presented in this research is design research which particularly focuses on the relation among fractions as theme and use Realistic Mathematics Educations (RME) approach with measurement length as the context of the activities.
B. Research questions
Based on the explanation at the background the researcher formulated two research questions as follow:
1. How can measurements activities support students’ reasoning in adding
fractions?
2. What kind of models used by students to support their reasoning in adding
fractions?
C. Research Aim
Based on research question, the aims of the research are:
1. Describing how measurement activities can support students’ reasoning in adding fractions.
5 D. Definition of Key Terms
1. Measurement is the process or the result of determining the magnitude of a quantity. Measurement length is the process of determining the magnitude of length. Measurement activities are activities in determining the magnitude of quantity, such as length.
2. Support means to help. Reasoning is the process of drawing conclusions based on evidence or stated assumptions. Support students’ reasoning means to help
student in processing of drawing conclusions based on evidence or stated assumptions.
3. Fraction is a number that indicates the quotient of two quantities, especially the quotient of two whole numbers written in the form a/b, whereas b is not equal to zero.
4. Adding fractions or addition of fractions in this research is addition of positive fractions with the same denominators and different denominators. For instance, 1/5 + 3/5 and 1/5 + 2/3.
6 E. Assumptions
This research has a assumption related to the research subject, it is described as follows: the researcher assumes that the students' works represent the students’ thinking process.
F. Significances of Research
There are some various significances of this research that are expected to be useful for the development of science, especially mathematics education. The significance of this research is presented as follows:
1. Significances for researcher:
a. Providing an overview of how the processes of students’ thinking and reasoning in constructing their understanding about addition of fractions. b. Providing an overview of how to design instructional activities through a
Realistic Mathematics Education approach in addition of fractions that can support students’ thinking and reasoning in adding fractions.
c. Completing final task (master thesis) in mathematics education study program at the postgraduate program.
7 Chapter II
Theoretical Framework
In order to construct groundwork of our research, the researcher developed the theoretical framework. Some literatures are studied to identify the basic concepts that required to do addition of fractions. Furthermore, this literature reviews are useful in designing instructional activities in which students will gain more insight in the addition of fractions
In this research, measurement activities are explored as experience-based activities and contextual situation to build upon students’ reasoning and reach the
mathematical goals of addition of fractions. Furthermore literatures about realistic mathematics education is needed in explaining and investigating how can measuring contexts can support students’ thinking from informal to more formal mathematics in adding fractions.
A.Addition of fractions
8 each of these different meanings. The researcher described some ideas and concepts supported to addition of fractions as follows:
1. Interpretation of Fractions
There are some interpretations of fractions such as ratio, operator, quotient, and measure. The operator and measure interpretations are considered necessary for developing proficiency in additive operations on fractions (Fosnot & Dolk, 2002; Charlambos, et al , 2005). The both interpretations, operator and measure, are described as follows:
In the measure aspect, fraction can represent a measure of a quantity relative to one unit of that quantity. Lamon (1999) explained that the measure interpretation is different from the other constructs in which the number of equal parts in a unit can vary depending on how many times someone partition. This successive partitioning allows to “measure” with precision. The researcher spoke of these measurements as “points” and the number line served as a model to
9 In the operator aspect, Clark (2007) explained that a fraction can be used as an operator to shrink and stretch a number such as 3/4 x 12 = 9 and 5/4 x 8 = 10. It could also be suggested that student lack of experience with using fractions as operators may also contribute to the common misconception that multiplication always makes the result is bigger and division always makes the result is smaller.
2. Comparing and equivalent Fractions
The usual approaches in comparing fractions are finding common denominators and using cross-multiplication. These rules can be effective in getting the correct answers but these rules do not require understanding about the size of the fractions. If children are taught these rules before they have the opportunity to think about the relative sizes of various fractions, there is little chance that they will develop any familiarity with number sense about fractions size. Comparison activities (which fraction is more?) can play a significant role in helping children develop concepts of relative fraction sizes (De Walle, 2008). He also recommended that the use of a region or number line model may help students who are struggling to reason mentally.
10 the first experience that a fixed quantity can have multiple names (De Walle, 2008). In finding the equivalent fractions, the procedures should never be taught or used until the students understand what the results means. As a concept, two fractions are equivalent if they represent the same amount or quantity, for instance the same length. Through the activities, students are expected to realize that to get an equivalent fractions, doubling the numerator and denominator by the same nonzero number.
3. Addition Fractions through Measurement Length
It is known that the concept of natural numbers was derived from counting and the concept of fractional number was derived from measuring (Freudenthal, 1983; Streefland, 1991). Consequently, in order to teach addition of fraction, the researcher used measurement of length as the context.
There are two reasons why measurement activities are used as the context. The first, measurement comprises an aspect of practical skill that is important in daily life. The second, measuring numbers represents a specific aspect, because they refer to an “environment” in which the number exists, for
11 whole into some parts, the parts (e g quarters) are adjusted until the set number of equal parts leave no remainder (without gaps and without overlapping).
However, the notion of fractions as numbers appears to be simplistic. Lamon (1999) also refers to a qualitative leap that students need to undertake when moving from whole to fractional numbers. Linking the measure aspect of fractions to the partitioning process, Lamon (1999) considers performing partitions other than halving as a necessary skill for the development of the measure personality of fractions. To develop the measure personality of fractions students should also be able to use a given unit interval to measure any distance from the origin (e.g., zero). This means that students should be capable of locating a number on a number line and, conversely, be able to identify a number represented by a certain point on the number line (Hannula, 2003).
12 divided into parts equal to a multiple or a sub-multiple of the denominator of the given fraction (Baturo, 2004). Therefore, Smith (2002) suggests that to fully develop the measure personality of fractions students also need to master the order and equivalence of fractions.
There are five cluster that precede operation with fraction, namely producing fractions and their operational relations, Generating equivalencies, Operating through a mediating quantity, Doing one’s own productions, and On the
way to rules for the operations with fractions (Streefland, 1993).
Streefland (1993) describes the sequence of addition of fractions as follows:
a. Producing fractions
13 b. Generating equivalencies
Partitioning as activity for producing fractions has its sequel in the treatment of situations in which division is better concealed. This also holds for increasing precision in the comparing and equivalent of fractions (Streefland, 1991). This means that the mathematical ideas under consideration will be applied more broadly. This also takes place in problem involving distance (length) relate to addition of fractions problem.
c. Operating through a mediating quantity
The point of this, it is to determine the length of all sort of combinations in which fractions appear. This is indirect method of determining the addition of fractions (Streefland, 1991; Fosnot & Dolk, 2002). The idea of common whole or common denominator can be of service in mediating quantity.
d. Doing one’s own productions
In this stage, attention is paid to take fractions apart and put them together in order to acquire skill in producing equivalent fractions and to sharpen students’
own concept of the operations. It means that students are able to solve problems in a more and more refined manner at the symbolizing level. This take place through using a variety of ‘model of situations’ and through applying
14 e. On the way to rules for the operations with fractions
Free productions at a symbolizing level focuses the attention on taking fractions apart and putting them together, keeping in mind production of equivalent of fractions and developing ideas for the operations (Streefland, 1991).
Phrasing of formal rules as an activity is not considered up to this stage. On the other hand, as many activities as possible are directed towards stimulating the students to contribute their own informal ways of working.
B. Realistic Mathematics Educations
Realistic Mathematics Education (RME) is a theory of mathematics education that offers a pedagogical and didactical philosophy on mathematical learning and teaching as well as on designing instructional materials for mathematics education. The central principle of RME is that mathematics should always be meaningful to students.
The term ‘realistic’ in RME means that problem situations should be ‘experientially real’ for students. This does not necessarily mean that the problem
15 Students should be allowed and encouraged to invent their own strategies and ideas, and they should learn mathematics on their own authority. At the same time, this process should lead to particular end goals. This raises the question that underlies much of the RME-based research, namely that of how to support this process of engaging students in meaningful mathematical and fractions problem solving, and using students’ contributions to reach certain end goals.
The theory of RME is adjusted to mathematics education, because it includes specific characteristics on and design principles for mathematics education. Characteristics and principles of RME are described in the following sections.
1. Five characteristics of RME
There are five characteristics of the Realistic Mathematics Education (Treffers, 1987):
16 2. Using models and symbols for progressive mathematization. The development of students’ intuitive or informal notions towards more formal
mathematical concepts is a gradual process of progressive mathematization, the process by which a student extends his understanding from the concrete to the formal. From the contextual problem, students might use a variety of models, schemes, diagrams, and symbols to support their mathematization, provided these instruments are meaningful for the students and have the potential for generalization and abstraction. The double number line is used, for example, to solve the contextual problem of addition of fractions. See section 3 for instructional activities in the hypothetical learning trajectory. 3. Using students’ own constructions and productions. It is assumed that what
students make on their own is meaningful for them. Hence, using students’
constructions and productions is promoted as an essential part of instruction. 4. Interactivity. Students’ own contributions can then be used to compare and
reflect on the merits of the different models or symbols. In our instructional activity, we provide small group discussion and mathematical congress, whole-class discussion. It is expected that students will learn from each other in small groups or in whole-class discussions.
17 theory is developed from solving problems. For instance, other domains related to our instructional sequence are multiplication of fraction and whole number, ¼ x 12, and also measurement of length.
2. Three principles of RME
In addition to those characteristics, there are three principles of RME for design in mathematics education, such as guided reinvention, didactical phenomenology, and emergent models (Gravemeijer, 1994).
The first principle: Guided reinvention. Reinvent mathematics occurs when students progressively mathematize their own mathematical activity under the guidance of teacher and the instructional design (Treffer, 1987). The first principle of RME, guided reinvention, which states that students should experience the learning of mathematics as a process similar to the process by which mathematics was invented (Gravemeijer, 1994).
There are three methods in guide reinvention, the first method is a ‘thought experiment’. In this method, we should think of how students could
have reinvented the mathematics at issue themselves. The second method is to study the history of the topic at issue. The third method, elaborated by, is to use students’ informal solution strategies as a source (Streefland, 1991). In our
design research, we use this method. We support students’ solutions in getting
18 The second principle: Didactical Phenomenology. Didactical
phenomenology is the study of concepts in relation to phenomena with a didactical interest. Our challenge is to find phenomena by the concepts that are to be taught (Freudenthal, 1983). For example, in sections 4.5 and 4.6, our conjecture about students’ thinking is that students add fractions through
addition of whole number and then move back to fraction by using the idea of fractions as measure and operator and double number line as model in computation strategy.
The third principle: Emergent Models. In second principle of RME about progressive mathematization, we try to find models that can help students make progress from informal to more formal mathematical activity. In case of addition of fractions, line (track) of racing in combination with whole number in bottom and fractions in above, next we call a double number line, that represent the track of bike racing will be envisioned to become model of situation to solve contextual problem and later a model for more formal reasoning (Fosnot & Dolk, 2003; Streefland, 1991). Gravemeijer (1994) described how models-of a certain situation can become model-for more formal reasoning.
19 Figure 2. l. Levels of emergent modeling from situational to formal reasoning
The implementation of the four levels of emergent modeling in this research is described as follows:
1. Situational level
Situational level is the basic level of emergent modeling where domain-specific, situational knowledge and strategies are used within the context of the situation. Measurement activity provides informal knowledge of addition of fractions to students when students have to determine the total part of track. There are some addition of fractions concepts that are elicited by this activity, such as interpretation of fractions, comparing fractions, equivalent of fractions, common denominator. In this level, students still use their own production of symbolizing and model of thinking related to the situation.
2. Referential level
The use of models and strategies in this level refers to the situation described in the problem or, in other words, referential level is the level of models-of. A class discussion encourages students to shift from situational
20 level to referential level when students need to make representations (drawings) as the models-of their strategies and measuring tools in the measuring activity. As an addition, the "draw number line" activity also served as referential activity in which students produced their own draw (line) to represent their way in measuring length. In this activity, student-made line became model-of the situation. See sections 3, chapter II.
3. General level
In general level, models-for emerge in which the mathematical focus on strategies dominates over the reference to the contextual problem. Student—made line produced in “making our own number line” became model-for measurement when they turned to be "blank number line" as means for measuring. In this level, the blank line were independent from the students’ strategies in the measuring activity.
4. Formal level
In formal level, reasoning with conventional symbolizations is no longer dependent on the support of model-for mathematics activity. The focus of the discussion moves to more specific characteristics of models related to the concept of addition of fractions.
21 comparing fractions. Furthermore, in grade IV semester 2, this topics are repeated and improved, including adding fractions. So in class IV semester 2, this is the first time students learn to add fractions, which then repeated and improved in class V and VI. The following submitted details of Standard Competence (SC) and Basic Standard (BS) per grade level that gave rise to the sum of learning fractions, as well as examples of indicators that are translated from the those BS.
Table 2.1. Addition of fractions for elementary school in the Indonesian curriculum
Standard Competence (SC)
Basic Competence (BC) The Second Semester of Grade IV
6.Use fractions in problem solving
6.1 Explain the meaning of fractions and sequence of fractions (repetition and improvement the topic and comparing fractions)
6.2 Simplifying the various forms of fractions. To achieve this KD then students should have competence about the concept of equivalent fractions, fractions familiar mix, and decimal fractions. But students have not learned to change the denomination of one form into another form.
6.3 Addition of fractions. Competencies students should be able to add fractions with same denominator and are not the same.
22 denominator.
6.4 Subtraction of fractions
6.5 Solving problems associated with Fractions
C.
Hypothetical Learning Trajectory
The design research presented in this research is particularly concerned with the collaboration between addition fractions as a theme and use Realistic Mathematics Education (RME) approach. It means that the aim is to develop a
local instruction theory on addition fractions under the guidance of the domain-specific instruction theory (RME theory), that serves as an empirically grounded theory on how a set of instructional activities can work, not merely to provide teachers with instructional activities that work in the classroom.
The local instructional theory consists of conjectures about a possible learning process, together with conjectures about possible means of supporting that learning process. Simon (1992) used a “hypothetical learning trajectory” as an instrument to bridge the gap between the instruction theory and teaching experiment.
23 A conjectured local instruction theory is made up of three components: (1) mathematical learning goals for students; (2) planned instructional activities and the tools that will be used; and (3) a conjectured learning process in which one anticipates how students’ thinking and understanding could evolve while
engaging in the proposed instructional activities (Gravemeijer, 2004).
1. Mathematical Learning Goals
There are two kind of the goal in our local instructional theory such as mathematical goals and learning goal for students. The both mathematical and learning goal we write as following table:
Table 2.2. The mathematical learning goals Goals
24 studies that we read, we decided to make sequence activities of learning fractions with partitioning and measuring context with the wood and rope, the number line as models. We chose measuring length as a context, because those are not too far different from the number line, since based on Fosnot & Dolk (2002), Streefland (1991) and Freudenthal (1973), the number line is the most valuable tools to teach arithmetic.
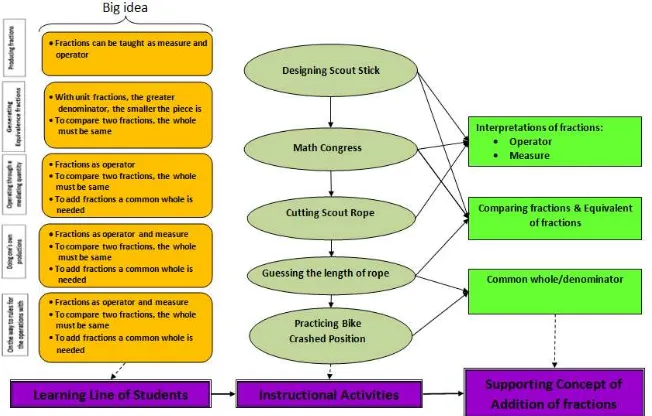
Analyzing students’ learning line or learning trajectory for a particular
domain is a crucial part in designing instructional activities for students. Every stage of instructional activities should be adjusted to the level of students. Consequently, the hypothesized students’ learning line for addition of
fractions was analyzed before designing a sequence of instructional activities for addition of fractions. The following is a general overview of students’ learning line for addition of fractions in grade 4:
25 There are five cluster that precede operation with fraction, namely producing fractions and their operational relations, Generating equivalencies, Operating through a mediating quantity, Doing one’s own productions, and On the way to rules for the
operations with fractions (Streefland, 1993). We elaborate them in section II;A. A set of instructional activities for addition of fractions was designed based on this hypothesized students’ learning line and thinking process. This set of instructional
activities was divided into six different activities that were accomplished in six days. Each day activity was aimed to achieve students’ understanding in one or more basic
concepts of addition of fractions. Similarly, some of basic concepts of addition of fractions were achieved from different activities. The relation among students` learning line, instructional activities and the basic concepts of linear measurement that need to be acquired is shown in the following diagram.
26 3. A Conjectured Learning Process
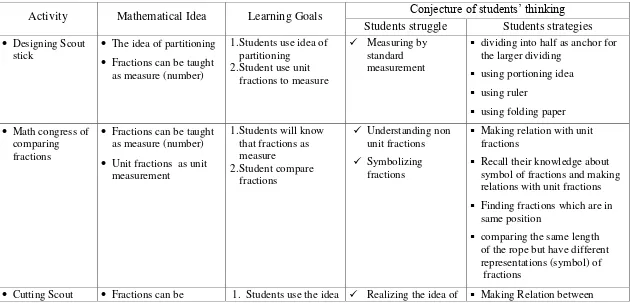
Based on the frame of sequence activities and learning line that is described in previous part, next we will describe our conjecture of the students’ struggles we anticipated and the conjecture of strategies that might be used by students in the sequence activities. See the following table:
Table 2.3. Conjecture of students’ learning process
Activity Mathematical Idea Learning Goals Conjecture of students’ thinking Students struggle Students strategies
dividing into half as anchor for the larger dividing
Finding fractions which are in same position
comparing the same length of the rope but have different representations (symbol) of fractions
27
length of part and length of whole
Measuring length by using unit fractions as unit measurement state on the same place on the line
Use fractions as operator and double number line model to
Use fractions as operator and double number line model to add fraction by using
measuring length strategy with unit fractions as unit
28
The instructional activities for addition of fractions in this research were designed based on the hypothesized students’ learning trajectory. The
instructional activities consist of six activities that will be conducted in three weeks period. The hypothetical learning trajectory is elaborated in the instructional activities as following:
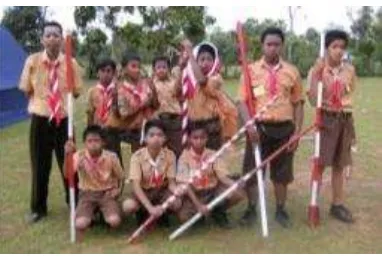
Activity 1: Coloring Scout Stick
Figure 2.4. Scout Stick Mathematical Learning Goal(s):
This activity aims students can interpret fractions as measure. Tools:
Students’ worksheet, Stick, Crayon, Pen.
Behind the context:
An idea of fractions as measurer occurs when students are asked to measure
the length of part(s) of the stick which are colored by them. Description of activity:
Teacher tells about her planning in designing Hanger. Teacher says that
29
scope stick? Today we want to design/color the mini scope stick in four different
types:
First type has three colors,
Second type has four colors,
Third type has six colors, and
Fourth type has eight colors,
Every group gets 1 stick measuring 60 centimeters and designs one type
randomly(by lottery). How do you design the stick? How much the length
each part?”
Conjecture of students’ thinking:
In designing the stick,
Some students might divide the stick into the number of colors (type of
the stick) by using ruler or by hand or by estimating.
Some students might use paper as ruler, and fold/divide the paper to
find the length.
In dividing or folding paper into two, they will easily to do that. In dividing or folding paper into four, some students might divide or fold the paper into two and fold into two again. But in dividing or folding paper into three, students might find difficulty in divide it. Some students might use try and error in dividing.
30
Some students might measure the length in the form of unit
measurement, i.e. centimeter. For instance the length is 3 centimeters, etc.
Some students might measure the length by using fractions as the
length/measure. For instance, the distance of part of the stick divided into 3 parts is third or one over three, etc.
The discussion will be continued about the interpretation of fractions. It expected that
Some students will realize that fractions is a measure/ the length of part
of the stick, for instance: 1/3 is the length (measure) of one part of the stick divided by 3, 2/3 is the length of two parts of the stick divided by three, etc.
Some students will realize that 1/3 is one part of stick divided by three,
2/3 is two parts of the stick divided by three, etc. Mathematical Congress
31
might also discuss about the relation between two fractions: 1/3 and 2/6 by comparing the length of each part.
Activity 2 : Comparing Coloring Stick Mathematical Learning Goal(s):
This activity aims to compare fractions and determine equivalence of fractions. Tools:
Coloring Stick, Students’ Worksheet.
Behind the context:
Comparing and equivalent of fractions (i.e. fractions as measure) occur when
student are asked to compare part(s) of some kinds of coloring stick. Description of activity:
Teacher starts discussion, by reminding students about what they did at the previous meeting. Teacher use the stick colored by students at the first activity to provoke students reach the idea of comparing and determining the equivalence of fractions by comparing four kind of stick directly and ask students to explain what can they see/conclude. Teacher gives four types of stick to every group and students’ worksheet consisting three kind of problems:
1. How to compare fractions?, for instance: 2/3 . . . ¾, fill with equal to, less than, or more than.
2. Short the following fractions: 5 / 6, 2 / 3 and ¾ start from the smallest!
32
In order to answer these problems, teacher ask students to use stick colored by them at the previous activity and explain their reason by drawing or make representation of their thinking/reasoning.
Conjecture of students’ thinking:
For the first problem, comparing fractions:
Some students might use 4 types of stick colored, stick divided into 3, 4, 6,
and 8 same parts, to compare fractions by comparing the length of each parts directly.
Some students might draw a line/bar/rectangle as representations of the
stick to compare fractions by comparing the length of each parts, for instance:
Etc.
Some students might draw a line as representations of the stick to compare
fractions by comparing the length of each parts, for instance :
33
Some students might use four types of the stick to order the fractions, 5 /
6, 2 / 3 and ¾. To solve this problem, they will compare first type (stick divided by 3 same parts), second type (stick divided by 3 same parts), and third type (stick divided by 6 same parts) directly.
Some students might compare all fractions, 5/6, 2/3 and ¾, by drawing
bar/rectangle as representations of stick. Some students might order those fractions through comparing the length as representations of the fractions. Some students might compare all fractions, 5/6, 2/3 and ¾, by number line. Some students might order those fractions through comparing the position of the fractions on the number line. For instance: In determining the equivalence of fractions:
Some students might compare two types of stick depend on the
denominator, for example: to answer this question:
, some students will use first type and third type of the stick.
Some students might compare by drawing two bars/rectangles and
finding the same position, for example: to answer this question:
34
Some students might compare by drawing two number lines and
finding the same position of both fractions, for example: to answer
this question:
, for example:
Mathematical Congress
In mathematical congress, students will discuss about the way in producing fractions such as interpretation of fractions. Students might get difficult or forget it. The discussion will be continued about the distance of each part and how to write the distance. Some students might use “a half”, “a third”,“a quarter”, etc,
35
discussion will be continued about the equivalent of fractions and strategy in making equal fractions.
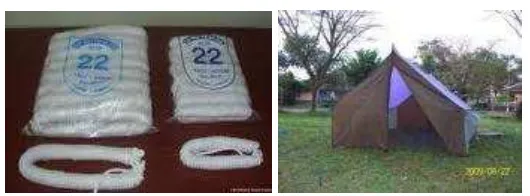
Activity 3: Cutting Scout Rope
Figure 2.5. Scout rope and Scout tent Mathematical Learning Goal(s):
This activity aims to stimulate students getting the idea of fractions as operator and measure and measuring length by using unit fractions as unit measurement.
Tools:
Ruler, poster, paper, and pen
Behind the context:
An idea of fractions as operator occurs when students are asked to cut a part
of rope and measure the length of it.
Description of activity
Teacher shows the scout rope measuring 12 meters. Teacher tells story about making scout tent. In order to make tent, we need some part of the scout rope, such as a half, one third and a quarter of scout rope. The problem is how do we get it and how many meters of scout rope which is cut:
36 b. One third of scout rope
c. A quarter of scout rope
What do you think about those parts of scout rope? Teacher also gives challenged problem,
if I cut the scout rope 3 meters, how much of length of rope the pieces?
if I cut the scout rope 5 meters, how much of length of rope the pieces?
if I cut the scout rope 7 meters, how much of length of rope the pieces?
Conjecture of students’ thinking:
Some students might divide 12 by 2 directly to get a half of scout rope.
From their division, they know that the length of scout rope which is cut by them is 4 meters. They also use this strategy in finding a third and a quarter of scout rope.
12 : 2 = 6 12 : 3 = 4 12 : 4 = 3
Some students might try to draw a line to represent the rope and write 12
37
For second question, some students might compare the draw directly. Some students might compare the whole numbers related to those fractions.
For the challenged questions:
Some students might use their answer at first question to answer. For
instance, 3 meter is ¼ of scout rope.
Some students might divide into 12 to find the position of three meters on
the rope, and finally he get the idea of 1/12-unit and then they use it to measure the position 3 meter, See following conjecture of students’ model:
To answer the second questions, some students might divide into 12 to get
1/12-unit and then they use it to measure the position 5 meter and 7 meter on the scout rope. After that they will determine the distance related to the length of scout rope. There are 5 of 1/12-units, so that is 5/12, etc. See following conjecture of students’ model:
38 Mathematical Congress
In mathematical congress, students will discuss about the way in getting pieces of scout rope. If students do division operation, the discussion will continued about the reason why they do that. If students do second conjecture (draw and divide the drawing), the discussion will continued about their perception about fractions. The aim this discussion is to provoke students to realize the idea fractions can be represent as operator, for instance 1/3 means 1/3 of rope, et cetera. The discussion also about the visualization of the track (a line), how they write the symbol of fractions and a whole number (the length) on the line. Through this discussion, we can introduce the name about the visualization, it called a double number line,
because there are two kind numbers such as fractions and whole number on the line.
Through discussion about challenged problem, students will discuss about relation between the length of part and the length of whole rope. Based on their strategies and answers, the discussion will be continued about relation among those fractions i.e. equivalent of fractions. For instance: ¼ and 3/12.
In order to answer the challenged questions, some student might feel difficult to answer. Discussion will be continued about how to find five meter on their draw (line).
39 Activity 4: Track of Bike Racing part Mathematical Learning Goal(s):
This activity aims to stimulate students choosing a common whole/denominator
Tools:
Ruler, poster, paper, and pen
Behind the context:
An idea of common denominator occurs after students are asked to choose a
whole number of their liking as the length of the track line.
Description of activity:
Teacher tells that “Last night my friends called me, he told me that he would
follow the bike race. He also told about the track. The track of bike racing has two
markers and four points (water supply place) on it with same distance. Could you draw the track?”
After that teacher gives challenged question: “My friend did not tell me about the
length of the racing. I just remember that the length of each marker is same and
the length of each point is also same. But I am still curious about the length of the
track. what do you think about the length of track? How much of the track the distance each point and the distance of each marker?“
Conjecture of students’ thinking:
At the first, student might try to make visualization of the track and draw
40
track. For instance, based on their visualization of the track, some students might realize that there are four points, it means that students partition into five same parts. So, the length of each points is 1/5 of the track. Some student might also know that there are two markers, it means that students partition into three same parts. So, the length of each points is 1/3 of the track.
In order to choose the length of track, some students might use try and
error strategy in finding number which can be divided by 3 and 5.
Some students might use the idea common multiply of 3 and 5 to choose
the length of track as follow:
If some students choose 15 km as the length of the track, they will know
that the distance of each point is 1/5 of 15 and the distance of each marker is 1/3 of 15. By using the idea of fractions as operator, they will use same strategy in third activity to determine it. So, 1/5 of 15 is 3 km and 1/3 of 15 is 5 km. Etcetera.
41
strategy in measuring length with unit fractions, students will know that 5 km is 5/15 of the track, see following conjecture of students figure:
Mathematical Congress
In mathematical congress, students will discuss about the problem. Students might get difficult to understand about the problem. The discussion will be continued about investigations the information and the questions in the context. Continued with first question, the question is aimed to provoke students to find common multiply of those denominator (common denominator). The mathematical thinking in this activity is finding common multiply.
Activity 5: Practicing Bike Mathematical Learning Goal(s):
1. Students choose a common denominator
2. Students use fraction as operator and measure
3. Students add fractions with same denominator
Tools: Ruler, poster, paper, and pen Behind the context:
A Double number line model __ a line with whole numbers on the top and
42
An idea of common denominator occurs after students are asked to choose a
common whole of their liking as the length of the line.
An idea of equivalence of fractions occurs when students examine the
relationship among their possible lengths for the race line.
Description of activity:
Questions are posed in class discussion:
“Yesterday, my friend practiced bike on the track. From the start line, he biked in
normal speed. After he passed the first point, he biked in fast speed as long as 2/5
of track. And then he stopped because he tired. How much of the track he practiced?”
Conjecture of students’ thinking:
o Some students might be confused about the problem, they just add the distance (whole number)
Some students might make visualization of the problem, See following conjecture of students’ model:
o Based on their visualization, they will realize that the distance is 1/5 plus 2/5 of race. Now, they will try to add those fractions.
43
+ 2/5 is 1 + 2 of 1/5-unit. It means that 1/5 + 2/5 is 3 of 1/5-unit or 3/5. See following conjecture of students’ model:
o Some students might choose a whole number as the length of the track. Students will find the length (whole number) of each part and add them. Finally, they will move back to the fractions by symbolizing using fractions. For instance:
Some students might choose 15 km as the length of race, because they have already chose at the previous meeting. Based on their visualization of track, the distance is 1/5 + 2/5 of track. See following conjecture of students’ model:
They might know that the first part is 3 and the second is 6. They just add up the 3 and the 6―that’s 9. Based on their strategy in measuring
length by using unit fractions
44
Some students might choose 30 km as the length of race. Based on their drawing, the distance is 1/5 + 2/5 of track. See following conjecture of students’ model:
They know that the first part is 6 and the second is 12. They just add up the 6 and the 12―that’s 18. By using their strategy in measuring length
by using fractions (1/30-units), students will know that the distance of the track between start line until second point is 18/30 of track. See following conjecture of students’ model:
et cetera.
Mathematical Congress
45
chosen such that can be divide by 5. Continued with first question, student are ask to determine the distance in whole number and then move back to fraction. Discussion will also be continued about the relation between denominator and result of addition of fractions with same denominator. Basic Math Concept: Common denominator, fractions as operator and measure, Addition of fraction with same denominator.
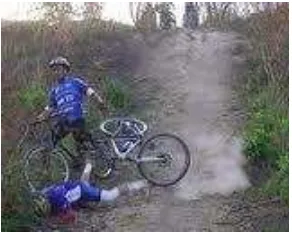
Activity 6: Crashed Position
Figure 2.6 . Crashed bike Mathematical Learning Goals:
1. Students can produce a common denominator
2. Students use fractions as operator and measure
3. Students can add fractions with different denominator by using a double number line
46 Planned Instructional Activities: Behind the context
A common denominator occurs when students try to choose the length of
track.
Addition of fractions occurs when student try to find the distance between
start line and crashed position.
A double number line model occur when students to represent their
strategy in Adding fractions.
Description of activity:
Children work in group (3-4 students). Teacher tells the story about her/his friend’s plan in joining bike racing. The story is “Yesterday, my friend told
about their experience in her participation on Bike Racing. In that racing, he
was injured because he crashed and could not continue the racing. He said
that he crashed at distance 2/5 of track after passing the first marker. Could
you find the position where biker is crashed? How much of the race has he done until he is crashed?”
47 Conjecture of students thinking:
The first problem
The first problem is to draw and find position where biker is crashed on the track.
Some students might draw a line to represent the track and make a sign to
where biker is crashed, See following conjecture of students’ model:
Some students might draw a line to represent the track and make a sign to
represent the point (water supply) and point where biker is crashed, See following conjecture of students’ model:
Based on their draw about the crashed position, teacher can ask student to solve the second problem.
The second problem
48
Some Students might choose 15 km as the length, because they work with
this number at the previous activity (track of bike racing).
o Based on the draw of the crashed position, the length of the track which has he done is 1/3 + 2/5 of track.
And they know that 1/3 of track is 5 and 2/5 of track is 6. They just add up the 5 and the 6― that is 11. So, by using unit fractions (1/15-units),
the length of the track which has he done is 11/15 of track. See following conjecture of students’ model:
Some students might choose 30 km as the length of race. See following
conjecture of students’ model:
49
fractions (1/30-units), students will know that the distance of the track between start line until second point is 22/30 of track. See following conjecture of students’ model:
et cetera.
By using double number line, students might choose number of their liking as the length of the line to fit the number. It is expected that they examine denominator and realize to the idea of common denominator.
Mathematical Congress
50
them. Then finally move back to fractions. And A double number line is good tool to do this strategy. Based on their result, the discussion can also about equivalence of fractions, 11/15 = 22/30.
51
Chapter III
Research Method
The method used in this research is called design research. It is a type of research methods with its core of research is formed by classroom teaching experiments that center on the development of instructional sequences and the local instructional theories that underpin them (Gravemeijer, 2004).
In this design research, there are three phases: developing a preliminary design, conducting a teaching experiment, and carrying out a retrospective analysis (Gravemeijer, 2004; Bakker, 2004). Each of these forms a cyclic process both on its own and in a whole design research. Therefore the design experiment consists of cyclic processes of thought experiments and instruction experiments (Freudenthal, 1991).
Figure 3.1. Reflexive relation between theory and experiments (Gravemeijer & Cobb,
52
Defining a Hypothetical Learning Trajectory (HLT) is needed before elucidating of these three phases. HLT is a design and research instrument that proved useful during all phases of design research (Bakker: 2004).
During the preliminary design, HLT guides the design of instructional materials that have to be developed or adapted. During teaching experiment, the HLT functions as a guideline for the teacher and researcher what to focus on in teaching, interviewing, and observing. And during the retrospective analysis, HLT functions as guideline determining what the researcher should focus on in the analysis (Bakker, 2004).
The following sections, we discuss the three phases of the design research according to Gravemeijer (2004), Bakker (2004), and Gravemeijer and Cobb (2006).
A. Phase 1: Preparation and Design
In this phase, we construct the Hypothetical Learning Trajectory (HLT) that developed potential sequence activities concerning the goal of the research. This HLT is called HLT I. In constructing this HLT, we explore and study prior research on fractions, elaborate with phenomenology related to fractions and also discuss with supervisor and expert.
B. Phase 2: Teaching Experiment
53
the starting point of the instructional activities and adjusting the initial HLT, (2) adjusting the HLT I, the HLT I is tried out and the observed actual learning process of students is employed to make adjustments of the HLT.
The teaching experiment aims at collecting data for answering the research questions. During the teaching experiments, we emphasize the ideas and conjectures could be modified while interpreting students’ reasoning and
learning in the classroom. The teaching experiments are conducted in six lessons in which the duration was 70 minutes for each lesson. Before doing teaching experiment, teacher and researcher discussed the upcoming activity.
C. Phase 3: Retrospective Analysis
In retrospective analysis phase, we will analyze the things that happened in the teaching experiment (see video and audio recording, students’ work). In this phase, HLT is used as guidelines and points of
reference: in answering research questions. The extensive description of the data analysis is explained in subchapter D, namely reliability and validity.
54
Table 3.1. Success indicators of designing the instructional activities (hypothetical learning trajectory) answering questions in students’ worksheet
answering questions in students’ worksheet
D. Reliability and Validity
Qualitative reliability is used to preserve the consistency of data analysis. The qualitative reliability is conducted in two following ways:
Data triangulation
The data triangulation engages different data sources such as the videotaping of the activities, the students’ works and some notes from
observer. All activities are video recorded and the students’ works are
collected. The combination of the videotaping and students’ works are
55
reconstruct the reasoning and to trace the arguments that underpin the conclusions
There are two methods of validity are used in the data analysis: Validity through HLT
The HLT is used in this retrospective analysis as a guideline and a point of reference in answering research questions. This aims to connect and evaluate the initial conjectures to the gathered data and prevented systematic bias. In this part, we continuously test and revise the HLT based on the result of retrospective analysis.
Cross interpretation
The parts of the data of this research, the video data, are cross interpreted with supervisors or expert. This is conducted to reduce the subjectivity of the researcher’s point of view.
E. Description of Experimental Subject and Time line
The research will be done in semester two of grade four of elementary school in SDI At Taqwa Surabaya, Indonesia. The school has been involved in the PMRI project, under the supervision of Surabaya State University.
The organization of this research is summarized in the following timeline:
Table 3.2. The timeline of the research
Date Description
56
teacher February 2011 of addition of fractions Classroom
Testing some activities on HLT Investigation students’ strategies
in solving problem of addition of fractions
Post-test Testing and investigating students’
knowledge and reasoning in adding
Testing and investigating pre-knowledge, attitude, and skill of students
Design Hanger Focusing on partitioning, the idea of fraction as measure and unit fraction as unit measurement
Math Congress
“Finding position
and distance”
Focusing on partitioning, the idea of fraction as measure and unit fraction as unit measurement
Cutting Scout Rope Focusing on measuring length, the idea of fraction as operator and operator and measure and using unit fraction as unit measurement
Track of Bike Racing part 2
Focusing on measuring length, using unit fraction as unit measurement, reasoning in adding fraction with same denominator
Crashed Position Focusing on measuring length, using unit fraction as unit measurement, reasoning in adding fraction with different denominator
Post-test Testing and investigating students’
57 F. Data Collection
Various data are collected from videotaping and written data to get a visualization of students’ thinking and reasoning in adding fractions.
The data collections of this research are described as follows:
1. Video recording
The strategies used by students when measuring length, comparing and adding fractions are more as practical data, instead of written data, therefore students’ strategies are more observable from video. Short
discussion with students during discussion in group, the class discussion, and also interview are also conducted and recorded as means to investigate students’ reasoning for their idea.
The video recording during the teaching experiments is recorded by two cameras; one camera as a static camera to record the whole class activities and the other camera as a dynamic camera to record the activities in some groups of students.
2. Written data
As an addition to the video data, the written data provided more information about students’ achievement in solving the measurement
58
learning processes were observed through videotaping and participating observatory.
The written data included students’ work during the teaching
experiment, observation sheets, the results of assessments including the final assessment and some notes gathered during the teaching experiment.
The data are collected through interviews with the teachers and the students, classroom observations, and students’ work. After that, we
analyze these data in the retrospective analysis. The outline of our data collection is represented in the following table:
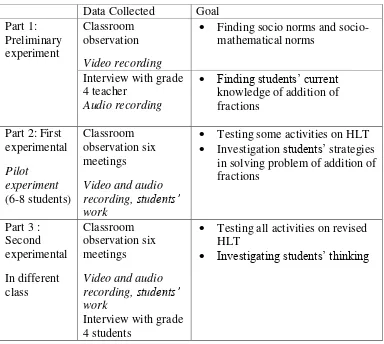
Table 3.3. Outline of data collection Data Collected Goal
Testing some activities on HLT Investigation students’ strategies
in solving problem of addition of fractions
Testing all activities on revised HLT
59
Chapter IV
Retrospective Analysis
The retrospective analysis in this design research encompasses the explanation of data both in general and in specific cases. The learning process addition of fractions of children will be analyzed, not only for the children as individuals, but also for their participation in and contribution to the development of classroom mathematical practice.
In this chapter, we compared our HLT and students’ actual learning
process during the experimental phase. We investigated if and how the HLT supported students’ learning. First, we looked at the video recordings, and
selected some critical moments in which students learned something or students did not learn as was expected in the HLT. Then we transcribed these critical moments we have observed in the classroom. These transcriptions were the empirical bases for our interpretations of students’ learning processes. We also analyzed students’ written work as another source to
investigate students’ learning. Moreover, we discussed what made successful
activities and what students have learned from those activities. In the case of unsuccessful activities, we investigated what caused such failure, and what needed to be done in the next HLT to improve students’ learning processes.
We should point out that during the teaching-learning experiment, we followed, observed and studied each lesson to find out whether the actual students’ learning process met the expectation in the HLT. Therefore, we