DEMOCRATIC REPUBLIC OF TIMOR - LESTE
General Budget of the State
2006- 07
Budget Document No1
Table of Contents
Table of Contents 2
Charts and Tables 3
Part 1 - Executive Summary 5
The Combined Sources Budget 5
General Budget of the State for Timor-Leste 6
Petroleum Fund 8
Domestic Revenue 9
Expenses of the State 9
Part 2 – Combating Poverty as a National Cause 10
Part 3 – Economic Overview 12
Domestic economy 13
Progress in Strengthening Public Finance 14
Part 4 – Revenue 17
Overview for the President of the Republic 42
Overview for the National Parliament 46
Overview for the Office of the Prime Minister and Presidency of the Council of Ministers 50
Overview for the Ministry of Defence 56
Overview for the Secretary of State of the Council of Ministers 60
Overview for the Ministry of State Administration 64
Overview for the Ministry of the Interior (Excluding the PNTL) 70
Overview for the National Police of Timor – Leste 74
Overview for the Ministry of Development 79
Overview for the Ministry of Justice 85
Overview for the Ministry of Agriculture, Forests and Fisheries 91
Overview for the Ministry of Education and Culture 103
Overview for the Ministry of Health 109
Overview for the Ministry of Labour and Community Reintegration 114
Overview for the Ministry of Foreign Affairs and Cooperation 120
Overview for the Ministry of Planning and Finance 124
Overview for the Ministry of Transport and Communications 131
Overview for the Ministry of Public Works 136
Overview for the Ministry of Natural Resources, Minerals and Energy Policy 140
Overview for the Secretary of State of Youth and Sport 144
Overview for the Tribunals 147
Overview for the Prosecutor General of Republic 151
Overview for the Public Broadcasting Service of Timor-Leste 153
Overview Provedor of Human Rights 156
Overview Electridade de Timor – Leste (EDTL) (Self Funding) 160
Overview Ports Authority of Timor-Leste (APORTIL) (Self Funding) 163
Overview Civil Aviation (ANATL) (Self Funding) 166
Overview Institute of Equipment Management (Self Funding) 169
Annex 1 General Budget of the State (Including Autonomous Agencies) ($000) 172 Annex 2 General Budget of the State (Excluding Autonomous Agencies) ($000) 173 Annex 3 General Budget of the State Appropriations for 2006-07 and Estimates for 2007-08 to 2009-10 by Ministry and Division ($000) 174
Annex 4 Appropriations for 2006-07 209
Annex 5 Capital and Development Plan for Timor-Leste 2006 – 07 TO 2009 – 2010 218
Annex 6 Staffing Profile 232
Permanent Staffing 232
Non Civil Servant 254
Autonomous Entities 256
Annex 7 Payment for Schools 2006-07 258
Annex 8 Payments to Primary Schools for Student Meals 2006-07 291
Annex 9 User Guide 297
Charts and Tables
Table 1.1 Combined Sources Budget 2005-06 to 2009-10 ($m) 5
Table 1.2 Financing of the Combined Sources Budget 2005-06 até 2009-10 ($m) 5
Chart 1.1 Fiscal Savings of Timor-Leste 2005-06 to 2009-10 6
Table 1.3 General Budget of the State Timor-Leste 2005-06 to 2009-10 ($m) 7 Table 1.4 Estimated Balances of the Petroleum Fund 2005-06 to 2009-10 ($m) 8
Table 1.5 Estimated Petroleum Revenue and Sustainable Income 8
Chart 1.2 Estimated Public Sector Savings for Timor-Leste 2005-06 to 2009-10 ($m) 8
Table 3.1 Selected Macro-Economic Indicators 2000-2005 13
Table 3.2 Public Finances for the Whole of State on a Combined Sources Basis 1999/00 to 2004/05 15
Table 3.3 Technical Assistance Orientation 1999/00 to 2004/05 16
Table 4.1 Total Revenue 2005-06 to 2009-10 ($m) 17
Table 4.2 World Oil Price Assumptions ($ per Barrel) 18
Table 4.3 Estimated Petroleum Revenue 2005-06 to 2009-10 ($m) 19
Chart 4.1 Changes in World Oil Price WTI Basis ($ Per Barrel) 19
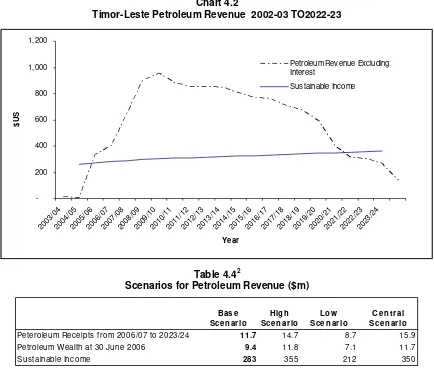
Chart 4.2 Timor-Leste Petroleum Revenue 2002-03 TO2022-23 20
Table 4.4 Scenarios for Petroleum Revenue ($m) 20
Table 4.5 Domestic Revenue ($m) 20
Table 4.6 Fees, User Charges and Other Revenue ($m) 21
Table 4.7 Autonomous Agency Revenue ($m) 21
Table 4.8 Direct Budget Support from Development Partners ($m) 21
Table 5.1 Estimated Petroleum Fund Savings 2005-06 to 2009-10 ($m) 22
Table 6.1 Combined Sources Budget 2005-06 to 2008-09 ($m) 23
Table 6.2 Budget of the State Whole of State Aggregate Figures 2005-06 to 2008-09 ($m) 24 Table 6.3 Budget of the State Whole of State Excluding Autonomous Agencies Aggregate Figures 2005-06 to 2008-09 ($m) 24 Table 6.4 Budget of the State Autonomous Agencies Aggregate Figures 2005-06 to 2008-09 ($m) 24
Table 6.5 2006-07 Combined Sources Budget by Ministry ($000) 25
Table 6.6 Grouping of Ministries within NDP Sectors 26
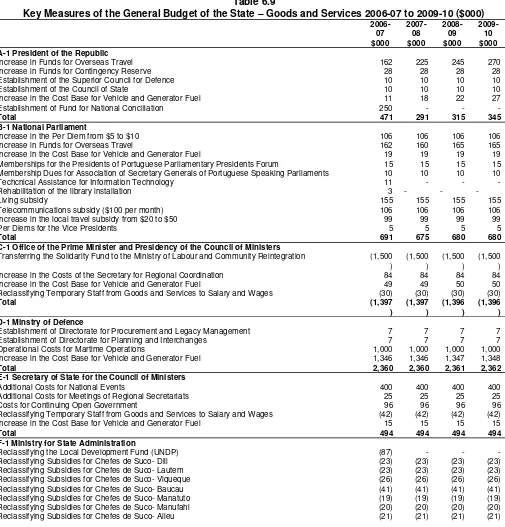
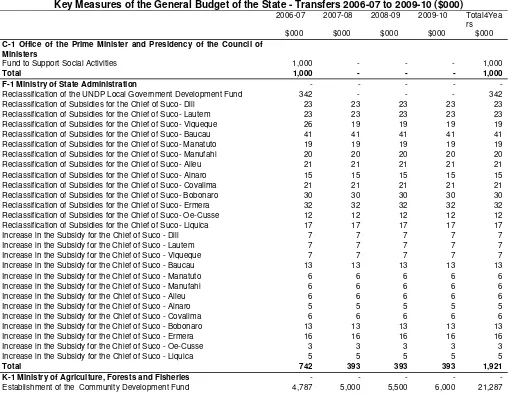
Table 6.7 General Budget of the State Total Allocations by Ministry 2006-07 27 Table 6.8 Key Measures of the General Budget of the State – Salaries and Wages 2006-07 to 2009-10 ($000) 28 Table 6.9 Key Measures of the General Budget of the State – Goods and Services 2006-07 to 2009-10 ($000) 32 Table 6.10 Key Measures of the General Budget of the State 2006-07 – Minor Capital to 2009-10 ($000) 36 Table 6.11 Key Measures of the General Budget of the State - Transfers 2006-07 to 2009-10 ($000) 39
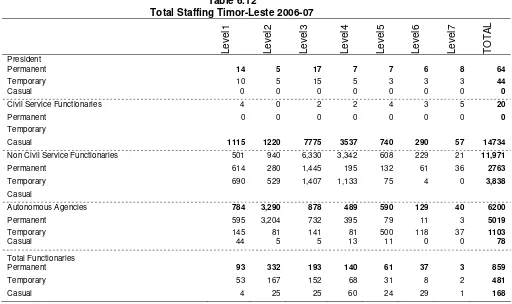
Table 6.12 Total Staffing Timor-Leste 2006-07 41
Table 6.13 Funding Overview President of the Republic ($000) 42
Table 6.14 Staffing Profile President of the Republic ($000) 42
Table 6.15 Confirmed Donor Funding President of the Republic ($000) 42
Table 6.16 Funding Overview National Parliament ($000) 46
Table 6.17 Staffing Profile National Parliament ($000) 46
Table 6.18 Confirmed Donor Funding National Parliament ($000) 46
Table 6.19 Funding Office of the Prime Minister and Presidency of the Council of Ministers ($000) 51 Table 6.20 Staffing Profile Office of the Prime Minister and Presidency of the Council of Ministers 51 Table 6.21 Confirmed Donor Funding Office of the Prime Minister and Presidency of the Council of Ministers ($000) 51
Table 6.22 Funding Overview Ministry of Defence ($000) 56
Table 6.23 Staffing Profile Ministry of Defence ($000) 57
Table 6.24 Confirmed Donor Funding Ministry of Defence ($000) 57
Table 6.25 Funding Overview Secretary of State of the Council of Ministers ($000) 61 Table 6.26 Staffing Profile Secretary of State of the Council of Ministers ($000) 61 Table 6.27 Funding Overview Ministry of State Administration ($000) 64 Table 6.28 Staffing Profile Ministry of State Administration ($000) 65 Table 6.29 Confirmed Donor Funding Ministry of State Administration ($000) 65 Table 6.30 Funding Overview Ministry of Interior (Excluding the PNTL) ($000) 70 Table 6.31 Staffing Profile Ministry of Interior (Excluding the PNTL) ($000) 70 Table 6.32 Confirmed Donor Funding Ministry of Interior (Excluding the PNTL) ($000) 71 Table 6.33 Funding Overview of National Police of Timor – Leste ($000) 74 Table 6.34 Staffing Profile National Police of Timor – Leste ($000) 74 Table 6.35 Confirmed Donor Funding National Police of Timor – Leste ($000) 74
Table 6.36 Funding Overview Ministry of Development ($000) 79
Table 6.37 Staffing Profile Ministry of Development ($000) 80
Table 6.38 Confirmed Donor Funding Ministry of Development ($000) 80
Table 6.39 Funding Overview Ministry of Justice ($000) 86
Table 6.40 Staffing Profile Ministry of Justice ($000) 86
Table 6.41 Confirmed Donor Funding Ministry of Justice ($000) 86
Table 6.46 Staffing Profile Ministry of Education and Culture ($000) 104 Table 6.47 Confirmed Donor Funding Ministry of Education and Culture ($000) 104
Table 6.48 Funding Overview Ministry of Health ($000) 109
Table 6.49 Staffing Profile Ministry of Health ($000) 110
Table 6.50 Confirmed Donor Funding Ministry of Health ($000) 110
Table 6.51 Funding Overview Ministry of Labour and Community Reintegration ($000) 115 Table 6.52 Staffing Profile Ministry of Labour and Community Reintegration ($000) 115 Table 6.53 Confirmed Donor Funding Ministry of Labour and Community Reintegration ($000) 115 Table 6.54 Funding Overview Ministry of Foreign Affairs and Cooperation ($000) 120 Table 6.55 Staffing Profile Ministry of Foreign Affairs and Cooperation ($000) 120 Table 6.56 Confirmed Donor Funding Ministry of Foreign Affairs and Cooperation ($000) 121 Table 6.57 Funding Overview Ministry of Planning and Finance (Excluding Whole of State Appropriations ($000) 125 Table 6.58 Staffing Profile Ministry of Planning and Finance ($000) 125 Table 6.59 Confirmed Donor Funding Ministry of Planning and Finance ($000) 125 Table 6.60 Funding Overview Ministry of Transport and Communications ($000) 131 Table 6.61 Staffing Profile Ministry of Transport and Communications ($000) 132 Table 6.62 Confirmed Donor Funding Ministry of Transport and Communications ($000) 132
Table 6.63 Funding Overview Ministry of Public Works ($000) 136
Table 6.64 Staffing Profile Ministry of Public Works ($000) 136
Table 6.65 Confirmed Donor Funding Ministry of Public Works ($000) 137 Table 6.66 Funding Overview Ministry of Natural Resources, Minerals and Energy Policy ($000) 140 Table 6.67 Staffing Profile Ministry of Natural Resources, Minerals and Energy Policy ($000) 141 Table 6.68 Confirmed Donor Funding Ministry of Natural Resources, Minerals and Energy Policy ($000) 141 Table 6.69 Funding Overview Secretary of State of Youth and Sport ($000) 144 Table 6.70 Staffing Profile Secretary of State of Youth and Sport ($000) 144
Table 6.71 Funding Overview of the Tribunals ($000) 147
Table 6.72 Staffing Profile Tribunals ($000) 147
Table 6.73 Confirmed Donor Funding Tribunals ($000) 147
Table 6.74 Funding Overview of the Prosecutor General of the Republic ($000) 151 Table 6.75 Staffing Profile Prosecutor General of the Republic ($000) 151 Table 6.76 Funding Overview Public Broadcasting Service of Timor-Leste ($000) 153 Table 6.77 Staffing Profile Public Broadcasting Service of Timor-Leste ($000) 153 Table 6.78 Funding Overview of the Provedor of Human Rights ($000) 156
Table 6.79 Staffing Profile Provedor of Human Rights ($000) 156
Table 6.80 Confirmed Donor Funding Provedor of Human Rights ($000) 156 Table 6.81 Funding Overview for Electricidade de Timor-Leste (EDTL – Self Funding) ($000) 160 Table 6.82 Staffing Profile Electricidade de Timor-Leste (EDTL – Self Funding) ($000) 160 Table 6.83 Funding Overview for Ports Authority of Timor-Leste (APORTIL) (Self Funding) ($000) 163
Table 6.84 Staffing Profile Ports Authority of Timor-Leste($000) 163
Part 1 - Executive Summary
The Combined Sources Budget
The Combined Sources Budget for 2006-07 is estimated to be $452.3m, this consists of $315.9m in expenditure proposed by the State Budget and $136.4m in confirmed donor financing by development partners. In the following for years from 2006-07 to 2009-10 the total expenditure on a combined sources basis is estimated to be $1,330.4m, $1,104.9 from the State Budget and $225.4m including confirmed financing from development partners.
Table 1.1
Combined Sources Budget 2005-06 to 2009-10 ($m)
05-06 06-07 07-08 08-09 09-10
(m ) (m ) (m ) (m ) (m )
Total Revenue 476.5 739.2 1,033.6 1,117.0 1,086.1 3,975.9 Total Expenditure 142.3 315.9 265.4 263.8 259.9 1,104.9 Fiscal Balance 334.2 423.3 768.2 853.2 826.2 2,870.9 Non Petroleum Fiscal Balance (84.6) (260.1) (204.2) (208.9) (201.4) (874.5) Donor Funding Confirmed 105.1 136.4 54.3 24.5 10.3 225.4 Total Combined Sources Spending 247.4 452.3 319.6 288.3 270.2 1,330.4 Further Funding Required 32.9 192.3 214.1 211.5 225.4 843.3 Total 4
years
Table 1.1 clearly illustrates the total funding required by Timor-Leste as identified in the Sector Investment Packages (SIP) and that an amount in excess of $843.3m in relation to the same period to guarantee that Timor-Leste stays on the path to achieve the objectives of the National Development Plan.
Table 1.2
Financing of the Combined Sources Budget 2005-06 até 2009-10 ($m)
05-06 06-07 07-08 08-09 09-10
(m ) (m ) (m ) (m ) (m )
Revenue 247.4 452.3 319.6 288.3 270.2 1,330.4 Domestic Revenue 36.7 39.1 42.9 46.1 48.9 177.0 Petroleum Revenue 84.6 - - - - -Transfer from the Petroleum Fund - 260.1 204.2 208.9 201.4 874.5 Direct Budget Support 10.3 10.3 10.0 - - 20.3 Autonomous Agency Revenue 10.7 6.5 8.3 8.8 9.6 33.1 Confirmed Donor Funding 105.1 136.4 54.3 24.5 10.3 225.4
Expenses 247.4 452.3 319.6 288.3 270.2 1,330.4 Recurrent Expenditure 167.3 300.0 207.4 201.6 201.9 911.0 State Budget Funding 103.6 196.2 177.1 184.3 195.7 753.3 Confirmed Donor Funding 63.7 103.8 30.3 17.3 6.2 157.7 Capital Expenditure 80.1 152.3 112.2 86.7 68.2 419.4 State Budget Funding 38.7 119.7 88.3 79.5 64.1 351.6 Confirmed Capital Funding 41.4 32.5 24.0 7.1 4.1 67.7
Further Funding Required 32.9 192.3 214.1 211.5 225.4 843.3 Recurrent Expenditure 25.8 71.8 80.2 74.8 66.0 292.9 Capital Expenditure 7.1 120.4 133.9 136.7 159.3 550.4 Total 280.3 644.6 533.7 499.8 495.5 2,173.6 Total 4
Table 1.2 illustrates clearly that increase in financing of the increase in expenditure is primarily due to the increase in the Timor-Leste State Budget. The increase in available sustainable income from the high level of petroleum receipts provided for an increase in $173.6m in expenditure by the State, an increase of 122% in relation to the previous year. Confirmed financing by development partners increased by $31.3 m (30%)
Expenditure on a combined sources basis shows a decline after 2006-07, this is basically the result of the decline in confirmed donor financing in the future. At the time of publication confirmed donor financing for 2009-10 was $10.3m.
General Budget of the State for Timor-Leste
Table 1.3 shows the fiscal position of the Budget of the State of Timor-Leste for 2005-06 is estimated at $334.2m in 2005-06 rising to $423.3m in 2006-07, and reaching $826.2m in 2009-10. In 2005-06 the non petroleum fiscal estimated is expected to be a deficit of $84.6m which will be financed by cash balances held in the Treasury account, the Consolidated Fund of Timor-Leste (CFET). The non petroleum fiscal balance for 2006-07 is estimated to be a deficit of $260.1 m which will be financed by the Petroleum Fund.
Chart 1.1
Fiscal Savings of Timor-Leste 2005-06 to 2009-10
-400 -200 -200 400 600 800 1,000
05-06 06-07 07-08 08-09 09-10
Fiscal Year
$m
Whole of State Fiscal Balance
Table 1.3
General Budget of the State Timor-Leste 2005-06 to 2009-10 ($m)
05-06 06-07 07-08 08-09 09-10
(m ) (m ) (m ) (m ) (m )
General Governm ent
Revenue 465.8 732.7 1,025.3 1,108.2 1,076.5 3,942.8 Petroleum Revenue 418.8 683.3 972.4 1,062.1 1,027.6 3,745.5 Taxes and Royalties 386.0 635.6 896.9 947.8 873.0 3,353.3 Petroleum Fund Interest 16.3 39.6 69.6 108.4 148.7 366.4 Other Petroleum Revenue 16.5 8.1 5.9 5.9 5.9 25.8
Domestic Revenue 36.7 39.1 42.9 46.1 48.9 177.0 Direct Tax 6.6 7.9 8.2 8.7 9.5 34.3 Indirect Tax 20.4 21.4 24.2 25.9 28.0 99.5 User Fees 9.7 9.8 10.5 11.5 11.4 43.2
Direct Budget Support 10.3 10.3 10.0 - - 20.3
Expenses 123.6 289.8 243.0 241.3 236.7 1,010.8 Salaries and Wages 28.8 37.4 38.7 40.0 44.7 160.9 Goods and Services 52.7 103.9 94.0 97.8 100.8 396.6 Minor Capital 5.6 16.9 7.1 7.8 9.7 41.5 Capital and Development 36.7 113.3 85.9 77.2 61.8 338.2 Current Transfers - 18.2 17.3 18.4 19.6 73.6
Subsidies 7.9 19.7 14.2 13.9 13.7 61.5 Operational Subsidies for Autonomous Agencies 5.9 13.3 11.9 11.5 11.3 48.0 Capital Investment for Autonomous Agencies 2.0 6.4 2.4 2.4 2.4 13.3
General Governm ent Budget Balance 334.2 423.2 768.1 853.1 826.1 2,870.5
Autonom ous Agencies
Revenue 18.6 26.2 22.5 22.7 23.3 94.6 Subsidies from General Government 7.9 19.7 14.2 13.9 13.7 61.5 Autonomous Agencies Charges 10.7 6.5 8.3 8.8 9.6 33.1
Expenses 18.6 26.1 22.4 22.6 23.2 94.2 Salaries and Wages 0.7 0.8 0.7 0.8 0.9 3.3 Goods and Services 14.9 18.1 18.6 18.7 19.1 74.5 Minor Capital 1.0 0.7 0.7 0.7 0.8 2.9 Capital and Development 2.0 6.4 2.4 2.4 2.4 13.5 Current Transf ers - - -
-Autonom ous Agencies Budget Balance - 0.1 0.1 0.1 0.1 0.4 Total Expenditure - Whole of Governm ent 142.3 315.9 265.4 263.8 259.9 1,104.9 Fiscal balances
Whole of State Fiscal Balance 334.2 423.3 768.2 853.2 826.2 2,870.9 Whole of State Fiscal Balance Non Petroleum (84.6) (260.1) (204.2) (208.9) (201.4) (874.5) Petroleum Fund Requirem ent
Cash Required f rom the Petroleum Fund na 260.1 204.2 208.9 201.4 874.5 Total 4
Petroleum Fund
As of 31 March 2006 the market value of the Petroleum Fund was $508.1m. The opening balance of the fund transferred at the beginning of September 2005 was $204.6 m. For the period September 2005 through March 2005 payments from the petroleum operations total $300.5m, where as the return from the investments in this period was $3.2m. The estimated balance of the fund at the end of 2005-06 is estimated to be $623.4m.
Financing of the Budget for 2006-07 will require a transfer from the Petroleum Fund to the Treasury Account (CFET) of $260.1m.
Table 1.4
Estimated Balances of the Petroleum Fund 2005-06 to 2009-10 ($m)
05-06 06-07 07-08 08-09 09-10
(m ) (m ) (m ) (m ) (m )
Opening Balanc e 204.6 623.4 1,046.7 1,814.9 2,668.1 Peteroleum Rev enue 402.5 643.7 902.8 953.7 878.9 Interes t 16.3 39.6 69.6 108.4 148.7 Withdraw l - 260.1 204.2 208.9 201.4 Clos ing Balanc e 623.4 1,046.7 1,814.9 2,668.1 3,494.3
The petroleum wealth, including that estimated to be in the petroleum fund as at 30 June 2006 is calculated at $9.4 billion, the sustainable level of petroleum income for the 2006-07 fiscal year is estimated at $283m. The withdrawal of $260.1m is below the sustainable petroleum income level, the estimates of the Government show that financing required for the period 2006-07 to 2009-10 is below the level of sustainable income. This is illustrated in Table 1.5 and Chart 1.1
Table 1.5
Estimated Petroleum Revenue and Sustainable Income
05-06 06-07 07-08 08-09 09-10
(m ) (m ) (m ) (m ) (m )
Sustainable Revenue 271.4 283.3 290.4 297.2 303.3
Estimated Withdraw ls 0.0 260.1 204.2 208.9 201.4
Chart 1.2
Estimated Public Sector Savings for Timor-Leste 2005-06 to 2009-10 ($m)
0 50 100 150 200 250 300 350
05-06 06-07 07-08 08-09 09-10
Fiscal Year
$m
Domestic Revenue
Tax rates and fees will generally remain unchanged. Non-petroleum revenue is estimated to generally increase in line with the growth in the non-oil economy. Improvements in the collection of some taxes and fees will, however, lead to a stronger growth in some of the revenues.
Expenses of the State
The State of Timor-Leste is estimated to spend $315.9m1, of which almost $120m consists of Capital Development investments. The State will also transfer almost $18.2m to provide Public Grants to schools and community groups and Personal Benefit Payments to veteran combatants of the Independence movement which will have immediate economic benefits. A significant increase on the previous year in all categories of expenditure will be realized in 2006-07, including:
as set out in Table 6.2, Budget of the State, page 23
• Salaries and Wages $8.8m (30%)
• Goods and Services $54.5m (81%)
• Minor Capital $11.1m (171%)
• Capital and Development $81m (209%)
Additionally there is a new category of expenditure in 2006-07, Public Transfers ($18.2m), shown as a new line of expenditure in Goods and Services. These transfers consist of two forms of expenditure, public grants and personal benefit payments. Public grants are monies which provided amongst others, schools for small repairs and organised civil society groups to execute small development projects.
Part 2 – Combating Poverty as a National Cause
Timor-Leste has made impressive gains since Independence in its transition from a post-conflict country. Most of the institutions provided for in the Constitution have now been established. Capacity building programs for institutional and human development have been expanded, and there has been good progress in providing growing numbers of people with access to education and health services. Moreover, in the past two years the economy has begun to recover from the contraction that followed the departure of large numbers of UN and other personnel beginning in 2002. Non-oil gross domestic product (GDP) is estimated to have grown by about 2% in real terms in 2005. There has been a significant increase in food production since the drought in 2002/03 that has contributed to the decline in domestic inflation and reduced levels of food imports in the past two years. With continued good performance in agriculture, and a large increase in public spending, the non-oil GDP growth rate is expected to rise to about 5% in 2006.
Despite these impressive gains, the fact is that far too many people remain in poverty, or remain vulnerable to poverty and food insecurity. With the prospect of substantially larger financial resources from oil and gas revenues, the Government believes that the Nation must now be mobilized to combat persistent widespread poverty. Among the many challenges that face the Nation, the following stand out.
• High levels of poverty, especially in rural areas, where there is continued heavy dependence on subsistence agriculture and vulnerability to food shortages
• Large numbers of people who still do not have access to basic services of adequate quality, including education, health, safe water and adequate sanitation
• Insufficient productive employment opportunities for the rapidly growing labor force
• Weak private sector and low levels of private investment needed for job creation
• Poor infrastructure services in combination with rapid urbanization
• Inadequate human resources and institutional capacities The Government has a four-pronged strategy for poverty reduction:
• promoting opportunities for the poor;
• improving access of the poor to basic social services;
• enhancing security, including reducing vulnerability to shocks, and improving food security; and
• empowering the poor and vulnerable groups.
A stronger economic growth performance is central to the campaign to combat poverty. International experience over the past half century indicates that economic growth is the single most important factor that influences poverty reduction outcomes. In the year ahead, the Government will launch a major step-up in public spending that, in combination with rising levels of private investment, will lift economic growth to 7-8 % a year from 2010. Given that population and the labour force will continue to grow rapidly for another decade or more, the Government believes that a non-oil GDP growth rate of 7% a year or more in real terms will be required to ensure a sustained decline in the incidence of poverty in Timor-Leste.
Domestic and export markets are both expected to play an important role in providing the demand basis for accelerated growth. A major increase in government spending in the next five years will be an important source of domestic demand that, in combination with rising real household incomes, will have important implications for local business activities. Ongoing programs to improve the business climate and encourage private investment will be intensified. Increased levels of private investment in a range of opportunities that produce goods and services for the international market will also play an increasingly important role. These include further development of commercial agriculture for export markets, development of the near-shore and onshore oil and gas industry that will also have important multiplier effects for the local economy, and steady growth in services such as tourism.
investment level to somewhere in the range of 40% of non-oil GDP by 2010. International experience indicates that with continued sound macroeconomic management, these levels of investment will permit sustained strong economic growth, increased productive employment opportunities, and declining levels of poverty.
The third key element of the national campaign to combat poverty is increased emphasis on promoting greater balance in the development of the country. This report sets out the main principles that will guide the Government’s approach to achieving a more equitable balance in development. These are as follows:
• The benefits of strong economic growth must be broadly shared among all groups in society regardless of their geographic location.
• There is a need to promote several growth poles within the country to slow the growth in population in and around Dili and create a more balanced pattern of urbanization.
• There must be continued strong emphasis on improved access to basic services throughout the country, in both rural areas and small towns. These include health and education services, improved water supply and sanitation, electricity and increased access to transport and communications services at affordable costs.
• The bulk of the poverty in the country is in rural areas and is heavily concentrated among households that depend primarily on subsistence farming for their livelihood. There would be strong emphasis on programs that provide these families with increased opportunities for Participation in the monetized Parte of the economy.
• There is a need for improved access to financial services, including microfinance programs for the poor that can facilitate production of marketable surpluses and involvement in trading activities. A more extensive banking network will be essential for sustained strong growth of the business community as well.
• The various initiatives that promote growth and employment must be complemented with targeted interventions that will afford additional protection to vulnerable groups, including those affected by seasonable variability. A number of programs are already underway. These are to be expanded.
The fourth element of the strategy for poverty reduction is continued prudence in macroeconomic management that will ensure a stable environment for growth and investment. The Government is committed to the prudent management of the increasingly large revenues that will flow from the development of the country’s oil and gas resources. On many occasions, the Government has reiterated the importance that it attaches to avoiding the mistakes made by other resource rich countries that have led to macroeconomic instability and worse. Consistent with this commitment to sound economic management of the country’s rich resource endowment, the Government has put in place a savings policy that will ensure effective management of petroleum revenues. Central to effective implementation of this policy is the Petroleum Fund, which was established in August 2005, and which is widely regarded as an application by Timor-Leste of best international practice.
Part 3 – Economic Overview
The state of the world economy is generally good. Even if growth in 2005 was somewhat lower than the previous year the world output grew at close to 5 per cent which is above trend. Growth is expected to remain at this level in 2006 and 2007.
The sustained strong global growth, in particular in Asia, has led to higher commodity prices. Demand for petroleum has been particularly strong and markets seem to have priced in a structural change in the balance between demand and supply, bringing the futures prices up to unprecedented levels. The International Energy Agency assesses both upstream and downstream investments to be below desirable levels. Recently increased geopolitical uncertainties in Iraq and Iran, and threats to oil production in Nigeria have contributed to high and volatile oil prices. Contracts of West Texas Intermediate in 2011 were (beginning of May) traded at about $US68 per barrel.
Global imbalances are increasing. The current account of the United States of America has continued to rise, whereas some of the major Asian economies continue to run significant surpluses. These imbalances are not sustainable and rebalancing of demand across regions might have significant consequences for exchange rates, with the U.S. dollar depreciating from current levels and currencies in surplus countries, such as some Asian countries, may appreciate. Unlike previous periods of high growth, the inflationary impact has been modest and monetary policy has been accommodating. Recently interest rates in a number of countries have, however, been increased. In the United States short term interest rates are 2 percentage points higher than in the beginning of 2005. Interbank rates (3 months) were 5 per cent at the beginning of May 2006. Long term interest rates are more stable and the yields on 10 year US Government bonds were 5 per cent at the beginning of May 2006.
There is continued strong development in our part of the world. Growth in China this year is expected to be close to 10 per cent, which is the same level as in 2004 and 2005. GDP in ASEAN-4, Indonesia, Thailand, the Philippines and Malaysia, grew slightly more than 5 per cent in 2005, a level that is expected to be maintained in 2006. Primarily due to higher energy prices inflation in these countries is expected to increase from a relatively high level of 7.5 per cent to closer to 9 per cent in 2006. Inflation in Indonesia, which was 10.5 per cent in 2005, is expected to be about 14 per cent in 2006. Growth in Australia is expected to be relatively good, about 3 per cent in 2006, and inflation is expected to remain around 2.7 per cent. At the beginning of May Australia’s central bank increased its official interest rate a quarter percentage points to 5.75 per cent, as strong growth and rising price pressures threatened to accelerate inflation.
The strong performance of the world economy has a substantial positive impact on Timor-Leste. Not only are petroleum revenues affected, growth in demand and increasing prices for raw materials may have an impact on the development of Timor-Leste’s other natural resources.
The development of the international financial markets has an impact on the Timor-Leste economy. As the US dollar is the legal tender of Timor-Leste, the domestic credit market is affected when there is a change in US interest rates, and the international value of the US dollar. As discussed above US interest rates have increased, in particular for short term loans and deposits. This has lead to increased cost of borrowing in Timor-Leste. On the other hand the Petroleum Fund is invested in US government bonds with 0-5 year maturity, and the return on these investments are somewhat higher than a year ago.
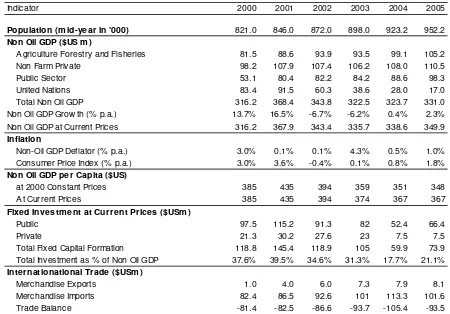
Domestic economy
Table 3.1
Selected Macro-Economic Indicators 2000-2005
Indicator 2000 2001 2002 2003 2004 2005
Population (m id-year in '000) 821.0 846.0 872.0 898.0 923.2 952.2
Non Oil GDP ($US m )
Agriculture Forestry and Fisheries 81.5 88.6 93.9 93.5 99.1 105.2
Non Farm Private 98.2 107.9 107.4 106.2 108.0 110.5
Public Sector 53.1 80.4 82.2 84.2 88.6 98.3
United Nations 83.4 91.5 60.3 38.6 28.0 17.0
Total Non Oil GDP 316.2 368.4 343.8 322.5 323.7 331.0
Non Oil GDP Grow th (% p.a.) 13.7% 16.5% -6.7% -6.2% 0.4% 2.3% Non Oil GDP at Current Prices 316.2 367.9 343.4 335.7 338.6 349.9 Inflation
Non-Oil GDP Deflator (% p.a.) 3.0% 0.1% 0.1% 4.3% 0.5% 1.0% Consumer Price Index (% p.a.) 3.0% 3.6% -0.4% 0.1% 0.8% 1.8% Non Oil GDP per Capita ($US)
at 2000 Constant Prices 385 435 394 359 351 348
At Current Prices 385 435 394 374 367 367
Fixed Investm ent at Current Prices ($USm )
Public 97.5 115.2 91.3 82 52.4 66.4
Private 21.3 30.2 27.6 23 7.5 7.5
Total Fixed Capital Formation 118.8 145.4 118.9 105 59.9 73.9 Total Investment as % of Non Oil GDP 37.6% 39.5% 34.6% 31.3% 17.7% 21.1% Internationational Trade ($USm )
Merchandise Exports 1.0 4.0 6.0 7.3 7.9 8.1
Merchandise Imports 82.4 86.5 92.6 101 113.3 101.6
Trade Balance -81.4 -82.5 -86.6 -93.7 -105.4 -93.5
Over the past two years, there has been a steady improvement in the macroeconomic framework of the country and encouraging signs of a recovery from the sharp economic contraction in 2002 and 2003 that stemmed from the withdrawal of UN personnel. As Table 2 indicates, non-oil GDP is estimated to have increased by about 2% in real terms last year. The recovery has been helped by a strong performance in food production in the agriculture sector following the drought in FY2002/03, and substantial growth in bank lending to the private sector. Credit to the private sector rose from 2% of non-oil GDP at end 2002 to 25% at end 2005, made possible by a notable increase in demand and time deposits in the banking system. This measure of broad money supply has increased from $20 million in 2000 to about $95 million at end 2005, equivalent to about 28% of non-oil GDP. The past year has also seen a significant increase in recurrent spending by the Government that has stimulated domestic economic activity. Macroeconomic stability has been further strengthened by a decline in domestic inflation, with the consumer price index for Timor-Leste increasing by a total of less than 3% in the past three years. External competitiveness has also improved with the depreciation of the $US in real terms. The real effective exchange rate vis-à-vis Timor-Leste’s main trading partners, Australia and Indonesia, is now at the same level as it was at end 2002.
However, the pace of recovery has been restrained by a sharp decline in the level of fixed investment in the past four years. From the peak of $145 million in 2001 (equal to 40% of non-oil GDP), fixed capital formation is estimated to have declined to about $60 million in 2004 – equivalent to about 18% of non-oil GDP. Last year saw the beginnings of a recovery in capital spending as the Government placed increased emphasis on the role of construction activity as a means of creating employment throughout the economy and a number of new private investment projects got underway.
surveys of the incidence of income poverty in the country, the weak growth performance, together with an annual increase in population of 3%, has almost certainly led to a rise in the incidence of income poverty. Surveys in 2001 indicated that about 40% of the population – almost 335,000 people – was below the income poverty line. Informal estimates suggest that perhaps 41% of the population may now be below the poverty line – an increase of some 50,000 people since 2001.
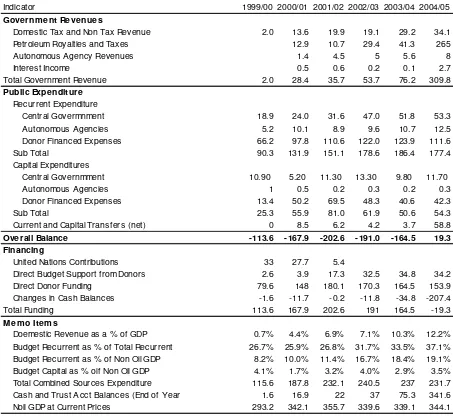
Progress in Strengthening Public Finance
An important achievement since the restoration of Independence has been the steady improvement in the public finances of the country. Table 3.2 provides a summary of receipts and expenditures on a combined sources basis for the past six years. A number of important points emerge:
• There has been a steady increase in tax and non-tax revenues of the government to $42.1m last fiscal year – equivalent to 12.2% of non-oil GDP. This revenue performance is only marginally lower than the average for low income developing countries around the world.
• Petroleum revenues rose sharply last year to $265m as a result of rising production from the Bayu Undan field and higher world prices for petroleum.
• Recurrent spending on a combined sources basis has levelled off in the past three years, averaging about $180m a year. There has, however, been a steady increase in CFET recurrent expenditures, which accounted for 37% of total recurrent outlays last year. A further sharp rise in the share funded by CFET is expected this fiscal year.
• CFET funding of recurrent expenditures last year was equivalent to about 19% of non-oil GDP – a level that is comparable to the average for all low income developing countries around the world.
• Capital expenditures by CFET (net of transfers to BPA and other entities) have remained at about $12m a year for the past three years – equivalent to about 3.6% of non-oil GDP. Donor funded capital expenditures have declined from the high levels of FY2000/01 and FY2001/02. The Government is concerned about the decline in public investment on a combined sources basis and is taking steps to increase these outlays in the coming years to lay the foundations for a stronger growth performance in the economy.
Table 3.2
Public Finances for the Whole of State on a Combined Sources Basis 1999/00 to 2004/05
Indicator 1999/00 2000/01 2001/02 2002/03 2003/04 2004/05
Governm ent Revenues
Domestic Tax and Non Tax Revenue 2.0 13.6 19.9 19.1 29.2 34.1
Petroleum Royalties and Taxes 12.9 10.7 29.4 41.3 265
Autonomous Agency Revenues 1.4 4.5 5 5.6 8
Interest Income 0.5 0.6 0.2 0.1 2.7
Total Government Revenue 2.0 28.4 35.7 53.7 76.2 309.8
Public Expenditure Recurrent Expenditure
Central Govermnment 18.9 24.0 31.6 47.0 51.8 53.3
Autonomous Agencies 5.2 10.1 8.9 9.6 10.7 12.5
Donor Financed Expenses 66.2 97.8 110.6 122.0 123.9 111.6
Sub Total 90.3 131.9 151.1 178.6 186.4 177.4
Capital Expenditures
Central Governmment 10.90 5.20 11.30 13.30 9.80 11.70
Autonomous Agencies 1 0.5 0.2 0.3 0.2 0.3
Donor Financed Expenses 13.4 50.2 69.5 48.3 40.6 42.3
Sub Total 25.3 55.9 81.0 61.9 50.6 54.3
Current and Capital Transfers (net) 0 8.5 6.2 4.2 3.7 58.8
Overall Balance -113.6 -167.9 -202.6 -191.0 -164.5 19.3
Financing
United Nations Contributions 33 27.7 5.4
Direct Budget Support from Donors 2.6 3.9 17.3 32.5 34.8 34.2
Direct Donor Funding 79.6 148 180.1 170.3 164.5 153.9
Changes in Cash Balances -1.6 -11.7 -0.2 -11.8 -34.8 -207.4
Total Funding 113.6 167.9 202.6 191 164.5 -19.3
Mem o Item s
Doemestic Revenue as a % of GDP 0.7% 4.4% 6.9% 7.1% 10.3% 12.2% Budget Recurrent as % of Total Recurrent 26.7% 25.9% 26.8% 31.7% 33.5% 37.1% Budget Recurrent as % of Non Oil GDP 8.2% 10.0% 11.4% 16.7% 18.4% 19.1% Budget Capital as % oif Non Oil GDP 4.1% 1.7% 3.2% 4.0% 2.9% 3.5% Total Combined Sources Expenditure 115.6 187.8 232.1 240.5 237 231.7 Cash and Trust Acct Balances (End of Year 1.6 16.9 22 37 75.3 341.6 Noil GDP at Current Prices 293.2 342.1 355.7 339.6 339.1 344.1
Table 3.3
Technical Assistance Orientation 1999/00 to 2004/05
1999/00 2000/01 2001/02 2002/03 2003/04 2004/05 Developm ent and Techcnical Assistance
On Budget 72.3 118.1 147 139.3 134.6 135.8
Off Budget 7.3 29.9 33 31 29.9 18.1
Sub Total 79.6 148 180 170.3 164.5 153.9
Humanitarian Assistance 82 29.6 11.9 3.5 3.1 1.1
Budget and Commodity Suppport 35.6 31.6 22.7 32.5 34.8 34.2
UN PKF 65.6 231.1 145 104.4 74.7 12.9
UN POL 33.1 51.9 45.4 26.7 15.7 5.1
Donor Administrative Expenses 1.1 7 4.9 4.6 7.5 5.2
Total Assistance 297 499.2 409.9 342 300.3 212.4
Mem o Item
Part 4 – Revenue
The Petroleum Sector
Table 4.1
Total Revenue 2005-06 to 2009-10 ($m)
05-06 06-07 07-08 08-09 09-10 T otal 4 ye ar s
(m ) (m ) (m ) (m ) (m ) (m )
T o tal Re ve n u e 476.5 739.2 1,033.6 1,117.0 1,086.1 3,975.9 Petroleum Rev enue 418.8 683.3 972.4 1,062.1 1,027.6 3,745.5 Domes tic Rev enue 36.7 39.1 42.9 46.1 48.9 177.0 A utonomous A genc ies 10.7 6.5 8.3 8.8 9.6 33.1 Direc t Budget Support 10.3 10.3 10.0 - - 20.3
Petroleum Production and Exploration
Currently there are two fields in operation, both of them in the Joint Development Area. The Elang Kakatua North is expected to be in its final stages of production whereas production on the Bayu-Undan field is in its early stages. The pipeline from Bayu-Undan to Darwin is in operation and the first cargo of LNG was shipped from the Darwin plant in February 2006. Compared to the assumption in the 2005/06 Budget the operator has increased the reserve estimate by about 45 per cent and the field is expected to produce for another 20 years, or even longer.
The government has signed an agreement with Australia where the revenues from the Greater Sunrise field will be split evenly between Timor-Leste and Australia. This agreement will be submitted to Parliament for ratification. Licenses of acreages on the exclusive Timor-Leste offshore jurisdiction are planned to be awarded in May and further licenses in the Joint Development Area will be awarded later in the year. The government also plans to award licenses for exploration onshore.
Petroleum Revenues, Petroleum Wealth and Sustainable Income
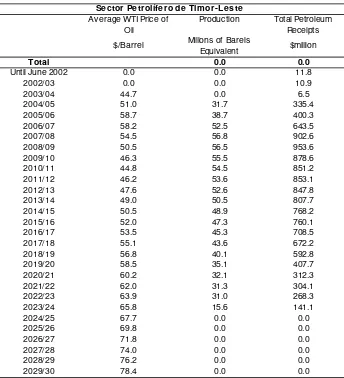
Due to higher oil production and high oil prices petroleum revenues in the current fiscal year will be higher than assumed in the Mid-Year Budget Update. Assuming that oil prices (West Texas Intermediate) will average $58 during 2006/07 fiscal year the oil revenues are estimated at $643m, and will remain high during the coming four year term.
Review of methodology
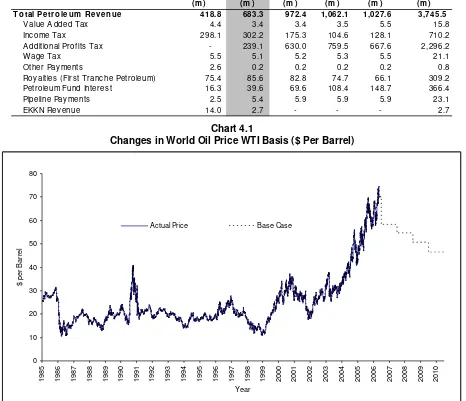
Oil price assumption in the 2005/06 budget papers were based on the futures prices observed in the market. Prices in the Bayu-Undan contracts are, however, not related to these prices but to the highly volatile spot market prices. Futures prices are at an all time high, reflecting the fact that growth in demand for energy for a while has been higher than growth in production. Geopolitical uncertainty has also had an impact on these prices. For 2006 the highly
respected International Energy Agency (IEA) has forecast a higher growth in production than in demand, and it expects a better balance between supply and demand in the years ahead than seen over the past year. If the perceived
geopolitical uncertainty is lower, a significant downwards adjustment of oil prices should not be ruled out. IEA forecasts oil prices in 2010 at $44 [1], whereas the futures prices are about $69 (prices at the beginning of May). Against this background the Ministry of Planning and Finance uses the IEA prices for calculating the Petroleum Wealth[2].
The operator on the Bayu-Undan field, ConocoPhillips, has submitted three scenarios for production on this field. In the “base” case the chances of a higher production are approximately in line with the chances of a lower production. In the “high” case the chances of a higher production are 10 per cent, whereas the chances of a lower production are 90 per cent. In the “low” case the chances of a lower production are estimated to be 10 per cent. Against the parameters specified in the Petroleum Fund Act for calculating the Petroleum Wealth (in particular the interest rate for discounting the cash flow) it seems prudent to use the low case production when calculating the cash flow.
The Petroleum Fund Act presupposes that the nominal yield on a US Government bond should be used when calculating the present value of the future cash flow from the petroleum sector. At the beginning of the budget process (beginning of February) this rate was about 4.5 per cent. These rates have, however, increased by about ½ a percentage point to about 5 per cent. The calculations in this document are based upon the markets at the beginning of the budget process.
The Petroleum Wealth, including the estimated value of the Petroleum Fund at 30 June 2006, is estimated at $9.4 b, and sustainable use of petroleum revenues for 2006/07 fiscal year is estimated at $283m.
Table 4.2
World Oil Price Assumptions ($ per Barrel)
Average WTI Price of Oil
Production Total Petroleum Receipts $/Barrel Millons of Barels
Equivalent $million
Total 0.0 0.0
Until June 2002 0.0 0.0 11.8
2002/03 0.0 0.0 10.9
2003/04 44.7 0.0 6.5
2004/05 51.0 31.7 335.4
2005/06 58.7 38.7 400.3
2006/07 58.2 52.5 643.5
2007/08 54.5 56.8 902.6
2008/09 50.5 56.5 953.6
2009/10 46.3 55.5 878.6
2010/11 44.8 54.5 851.2
2011/12 46.2 53.6 853.1
2012/13 47.6 52.6 847.8
2013/14 49.0 50.5 807.7
2014/15 50.5 48.9 768.2
2015/16 52.0 47.3 760.1
2016/17 53.5 45.3 708.5
2017/18 55.1 43.6 672.2
2018/19 56.8 40.1 592.8
2019/20 58.5 35.1 407.7
2020/21 60.2 32.1 312.3
2021/22 62.0 31.3 304.1
2022/23 63.9 31.0 268.3
2023/24 65.8 15.6 141.1
2024/25 67.7 0.0 0.0
2025/26 69.8 0.0 0.0
2026/27 71.8 0.0 0.0
2027/28 74.0 0.0 0.0
2028/29 76.2 0.0 0.0
2029/30 78.4 0.0 0.0
Table 4.3
Estimated Petroleum Revenue 2005-06 to 2009-10 ($m)
05-06 06-07 07-08 08-09 09-10
Total 4 ye ar s
(m ) (m ) (m ) (m ) (m ) (m )
Total Pe tr ole um Re ve nue 418.8 683.3 972.4 1,062.1 1,027.6 3,745.5 V alue A dded Tax 4.4 3.4 3.4 3.5 5.5 15.8 Inc ome Tax 298.1 302.2 175.3 104.6 128.1 710.2 A dditional Prof its Tax - 239.1 630.0 759.5 667.6 2,296.2 Wage Tax 5.5 5.1 5.2 5.3 5.5 21.1 Other Pay ments 2.6 0.2 0.2 0.2 0.2 0.8 Roy alties (Firs t Tranc he Petroleum) 75.4 85.6 82.8 74.7 66.1 309.2 Petroleum Fund Interes t 16.3 39.6 69.6 108.4 148.7 366.4 Pipeline Pay ments 2.5 5.4 5.9 5.9 5.9 23.1 EKKN Rev enue 14.0 2.7 - - - 2.7
Chart 4.1
Changes in World Oil Price WTI Basis ($ Per Barrel)
0 10 20 30 40 50 60 70 80
1985 1986 1987 1988 1989 1990 1991 1992 1993 1994 1995 1996 1997 1998 1999 2000 2001 2002 2003 2004 2005 2006 2007 2008 2009 2010
Year
$ per
B
ar
rel
Actual Price Base Case
There is a risk, however small, of a major disruption in the production, and hence TL revenues. Against this
background we should be cautious in taking expenditures up to sustainable income levels as long as Timor-Leste has only one field in production.
Sensitivity
There are a range of risks and uncertainties in any forecast of petroleum revenues. The most sensitive assumption is oil price, meaning that the forecast of petroleum revenues changes substantially even from a relatively small change in assumed oil prices. Other uncertainties include LNG contract volume and pricing terms, condensate and LPG spot sales prices relative to oil prices, operating costs and inflation. The MOPF has endeavoured to adopt prudent assumptions in all cases.
Chart 4.2
Timor-Leste Petroleum Revenue 2002-03 TO2022-23
-Peteroleum Rec eipts f rom 2006/07 to 2023/24 11.7 14.7 8.7 15.9
Petroleum Wealth at 30 June 2006 9.4 11.8 7.1 11.7
Sus tainable Inc ome 283 355 212 350
Tax rates and fees will generally remain unchanged. Non-petroleum revenue is estimated to generally increase in line with the growth in the non-oil economy. Improvements in the collection of some taxes and fees will, however, lead to a stronger growth in some areas of revenue.
Table 4.5
Domestic Revenue ($m)
05-06 06-07 07-08 08-09 09-10 Total 4 ye ar s
(m ) (m ) (m ) (m ) (m ) (m )
Taxes and users fees
Fees and other charges are expected to increase overall, reflecting improvements in the collection of fees. A reduction in the ordinary cash balances (CFET-account) with the Banking and Payments Authority will lead to a significant reduction in the interest receipts from the CFET account.
Land and property fees are expected to increase as the Government will increase its efforts to collect rents from tenants in Dili as well as outside Dili. It is also expected that some of the properties of the Government not currently being used will be leased to private companies and individuals.
It is expected that:
• University fees will increase in line with an expected increase in the number of students.
• Water fees will increase as more subscribers in Dili will start to pay fees for water supply. A significant increase is expected from this revenue source in 2006/07 as a result of the implementation licensing system Hospital fees will remain unchanged.
ID and Passport Fees will increase due to a process of issuing identification cards to all citizens of Timor-Leste. Even though business registrations offices will be established in the districts, revenue will remain unchanged.
Table 4.6
Fees, User Charges and Other Revenue ($m)
05-06 06-07 07-08 08-09 09-10
05-06 06-07 07-08 08-09 09-10 Total 4 y
(m ) (m ) (m ) (m ) (m ) (m )
Total Revenue 10.7 6.5 8.3 8.8 9.6 33.1
ANATL 1.0 0.9 0.9 0.9 0.9 3.6
APORTIL 1.3 1.3 1.4 1.5 1.7 5.9
EDTL 8.3 4.0 5.6 5.8 6.1 21.5
Institute of Material and Equipment 0.1 0.2 0.3 0.5 0.8 1.8
SAMES 0.1 0.1 0.1 0.1 0.4
Table 4.8
Direct Budget Support from Development Partners ($m)
05-06 06-07 07-08 08-09 09-10 T otal 4 y
(m ) (m ) (m ) (m ) (m ) (m )
Dir e ct Bu dg e t Su p p o r t 10.3 10.3 10.0 0.0 0.0 20.3
Part 5 Petroleum Fund
The Petroleum Fund was established by an initial transfer of $205m in September 2005. The Petroleum Fund is the Government’s vehicle for a prudent, transparent and long-term management of Timor-Leste’s petroleum revenues. A good management of petroleum revenues is critical for ensuring sustained economic growth to alleviate poverty. The Petroleum Fund builds on international best practice and is a tool that contributes to sound fiscal policies.
The Government has responsibility for the overall management of the Petroleum Fund, and the Minister of Planning and Finance exercises key functions and competences. The operational management is delegated to the Banking and Payments Authority in accordance with a management agreement. The Fund is currently invested through the Federal Reserve Bank of New York in US Government Bonds. The Banking and Payments Authority issues quarterly reports on the management of the Fund. These reports are available at http://www.transparency.gov.tl.
As of 31 March 2006 the market value of the Petroleum Fund was $508.1m. The opening balance of the Fund, transferred in the beginning of September 2005, was $204.6m. For the period September 2005 through March 2005 payments from the petroleum operations total $300.5m, where as the return from the investments in this period was $3.2m. The return for this period is adversely affected by unrealized market revaluations, reflecting increases in the US interest rates in this period. The Banking and Payments authority has in accordance with the Management Agreement with the Ministry of Planning and Finance debited the Petroleum Fund account with $180,000 in management expenses.
The Investment Advisory Board has been established and advises the Minister of Planning and Finance on the management of the Petroleum Fund. The Investment Advisory Board will among other things consider the investment mandate given in the Management Agreement. Currently, the investment mandate defines a very narrow range of investment alternatives. As the Banking and Payments Authority builds up competencies in the management of the Petroleum Fund it may be appropriate to amend the Management Agreement to include more of the qualifying instruments listed in the Petroleum Fund Act (article 15).
The Ministry of Planning and Finance is in the final stages in the process of appointing an independent auditor in accordance with the Petroleum Fund Act. It is expected that an internationally recognized audit company will start its work in June.
In the 2005/06 fiscal year the government will finance the budget by non-oil revenues and withdrawals of the CEFT cash account. In 2006/07 fiscal year the government plans to withdraw up to $259.7m. As discussed above the estimated Sustainable Income from the Petroleum Sector is estimated at $283m. Prior to transfer of funds from the Fund the Government will in accordance with article 8 of the Petroleum Fund Act provide Parliament with reports from the independent auditor certifying the amount of estimated sustainable income.
Table 5.1
Estimated Petroleum Fund Savings 2005-06 to 2009-10 ($m)
05-06 06-07 07-08 08-09 09-10
(m ) (m ) (m ) (m ) (m )
- 23 -
Part 6 – Expenses
Introduction
At the Timor-Leste Development Partners meeting held on 3-4 April 2006, the Government outlined its policy framework to attack the causes of poverty. A four-pronged strategy for poverty reduction would be adopted to:
• promote opportunities for the poor;
• improve access of the poor to basic social services;
• enhance security, including reducing vulnerability to shocks, and improving food security; and
• empower the poor and vulnerable groups.
A key underlying principle in the strategy to combat poverty is to encourage stronger economic growth performance. The 2006-07 State Budget will allow the Government to launch a major step-up in public spending that, in combination with rising levels of private investment, will lift economic growth to 7-8 % a year from 2010.
On a combined sources basis the Government anticipates that the $315.5m of the expenditure in 2006-07 will be supplemented by $136.4 which is provided by the development partners. The needs of Timor-Leste continue to be considerable, and this is shown by the $192.3m in projects requiring financing in 2006-07.
Table 6.1
Combined Sources Budget 2005-06 to 2008-09 ($m)
05-06 06-07 07-08 08-09 09-10
(m ) (m ) (m ) (m ) (m )
Total Revenue 476.5 739.2 1,033.6 1,117.0 1,086.1 3,975.9 Total Expenditure 142.3 315.9 265.4 263.8 259.9 1,104.9 Fiscal Balance 334.2 423.3 768.2 853.2 826.2 2,870.9 Non Petroleum Fiscal Balance (84.6) (260.1) (204.2) (208.9) (201.4) (874.5) Donor Funding Confirmed 105.1 136.4 54.3 24.5 10.3 225.4 Total Combined Sources Spending 247.4 452.3 319.6 288.3 270.2 1,330.4 Further Funding Required 32.9 192.3 214.1 211.5 225.4 843.3 Total 4
years
The significant increase in State Budget expenditure for 2006-07 is evident. There have been increases on the previous year (2005-06) in all categories of expenditure, including:
• Salaries and Wages $8.8m (30%)
• Goods and Services $54.1m (80%) (not including transfers)
• Minor Capital $11.1m (171%)
• Capital and Development $81m (209%)
Additionally there is a new category of expenditure in 2006-07, Public Transfers ($18.2m), shown as a line of expenditure in the Goods and Services category. Transfers consist of two forms of expenditure, Public Grants and Personal Benefit Payments. Public Grants are acquittable payments made to organizations such as schools, non governmental organizations, community organizations and other levels of government. Personal Benefit Payments are for non acquittable payments to individuals such as pensions or welfare payments.
Table 6.2 shows expenditure for the Whole of the State from 2005-06 to 2009-10. The State of Timor-Leste is estimated to spend $315.5m, of which almost $120m consists of Capital Development investments. The State will also transfer almost $18.2m to provide Public Grants to schools and community groups and Personal Benefit Payments to veteran combatants of the Independence movement which will have immediate economic benefits.
- 24 - Table 6.2
Budget of the State Whole of State Aggregate Figures 2005-06 to 2008-09 ($m)
05-06 06-07 07-08 08-09 09-10
(m ) (m ) (m ) (m ) (m )
Total Expenditure 142.3 315.9 264.4 263.3 259.9 1103.4
Salary & Wages 29.5 38.3 39.4 40.8 45.6 164.2
Good & Services 67.5 122.0 112.6 116.6 119.9 471.1
Minor Capital 6.5 17.6 7.7 8.5 10.6 44.4
Capital Development 38.7 119.7 87.3 79.0 64.1 350.1
Transfers 0.0 18.2 17.3 18.4 19.6 73.6
Total 4 years
Table 6.3
Budget of the State Whole of State Excluding Autonomous Agencies Aggregate Figures 2005-06 to 2008-09 ($m)
05-06 06-07 07-08 08-09 09-10
(m ) (m ) (m ) (m ) (m )
Total Expenditure 130.1 302.2 255.4 253.8 249.5 1060.9
Salary & Wages 29.2 37.4 38.7 40.0 44.7 160.9
Good & Services 58.3 116.1 106.4 110.4 113.6 446.5
Minor Capital 6.0 17.2 7.1 7.8 9.7 41.8
Capital Development 36.7 113.3 85.9 77.2 61.8 338.2
Current Transfers 0.0 18.2 17.3 18.4 19.6 73.6
Total 4 years
Table 6.4
Budget of the State Autonomous Agencies Aggregate Figures 2005-06 to 2008-09 ($m)
05-06 06-07 07-08 08-09 09-10
(m ) (m ) (m ) (m ) (m )
Total Expenditure 12.1 13.7 9.0 9.5 10.4 42.5
Salary & Wages 0.3 0.8 0.7 0.8 0.9 3.3
Good & Services 9.3 5.9 6.2 6.2 6.3 24.6
Minor Capital 0.5 0.4 0.7 0.7 0.8 2.7
Capital Development 2.0 6.4 1.3 1.8 2.3 12.0
Transfers 0.0 0.0 0.0 0.0 0.0 0.0
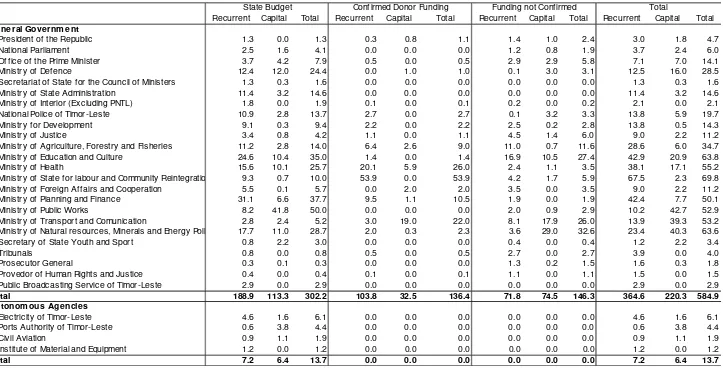
- 25 - Table 6.5
2006-07 Combined Sources Budget by Ministry ($000)
Recurrent Capital Total Recurrent Capital Total Recurrent Capital Total Recurrent Capital Total General Governm ent
President of the Republic 1.3 0.0 1.3 0.3 0.8 1.1 1.4 1.0 2.4 3.0 1.8 4.7
National Parliament 2.5 1.6 4.1 0.0 0.0 0.0 1.2 0.8 1.9 3.7 2.4 6.0
Off ice of the Prime Minister 3.7 4.2 7.9 0.5 0.0 0.5 2.9 2.9 5.8 7.1 7.0 14.1
Ministry of Def ence 12.4 12.0 24.4 0.0 1.0 1.0 0.1 3.0 3.1 12.5 16.0 28.5
Secretariat of State for the Council of Ministers 1.3 0.3 1.6 0.0 0.0 0.0 0.0 0.0 0.0 1.3 0.3 1.6
Ministry of State Administration 11.4 3.2 14.6 0.0 0.0 0.0 0.0 0.0 0.0 11.4 3.2 14.6
Ministry of Interior (Excluding PNTL) 1.8 0.0 1.9 0.1 0.0 0.1 0.2 0.0 0.2 2.1 0.0 2.1
National Police of Timor-Leste 10.9 2.8 13.7 2.7 0.0 2.7 0.1 3.2 3.3 13.8 5.9 19.7
Ministry for Development 9.1 0.3 9.4 2.2 0.0 2.2 2.5 0.2 2.8 13.8 0.5 14.3
Ministry of Justice 3.4 0.8 4.2 1.1 0.0 1.1 4.5 1.4 6.0 9.0 2.2 11.2
Ministry of Agriculture, Forestry and Fisheries 11.2 2.8 14.0 6.4 2.6 9.0 11.0 0.7 11.6 28.6 6.0 34.7
Ministry of Education and Culture 24.6 10.4 35.0 1.4 0.0 1.4 16.9 10.5 27.4 42.9 20.9 63.8
Ministry of Health 15.6 10.1 25.7 20.1 5.9 26.0 2.4 1.1 3.5 38.1 17.1 55.2
Ministry of State for labour and Community Reintegratio 9.3 0.7 10.0 53.9 0.0 53.9 4.2 1.7 5.9 67.5 2.3 69.8
Ministry of Foreign Af fairs and Cooperation 5.5 0.1 5.7 0.0 2.0 2.0 3.5 0.0 3.5 9.0 2.2 11.2
Ministry of Planning and Finance 31.1 6.6 37.7 9.5 1.1 10.5 1.9 0.0 1.9 42.4 7.7 50.1
Ministry of Public Works 8.2 41.8 50.0 0.0 0.0 0.0 2.0 0.9 2.9 10.2 42.7 52.9
Ministry of Transport and Comunication 2.8 2.4 5.2 3.0 19.0 22.0 8.1 17.9 26.0 13.9 39.3 53.2
Ministry of Natural resources, Minerals and Energy Poli 17.7 11.0 28.7 2.0 0.3 2.3 3.6 29.0 32.6 23.4 40.3 63.6
Secretary of State Youth and Sport 0.8 2.2 3.0 0.0 0.0 0.0 0.4 0.0 0.4 1.2 2.2 3.4
Tribunals 0.8 0.0 0.8 0.5 0.0 0.5 2.7 0.0 2.7 3.9 0.0 4.0
Prosecutor General 0.3 0.1 0.3 0.0 0.0 0.0 1.3 0.2 1.5 1.6 0.3 1.8
Provedor of Human Rights and Justice 0.4 0.0 0.4 0.1 0.0 0.1 1.1 0.0 1.1 1.5 0.0 1.5
Public Broadcasting Service of Timor-Leste 2.9 0.0 2.9 0.0 0.0 0.0 0.0 0.0 0.0 2.9 0.0 2.9
Total 188.9 113.3 302.2 103.8 32.5 136.4 71.8 74.5 146.3 364.6 220.3 584.9
Autonom ous Agencies
Electricity of Timor-Leste 4.6 1.6 6.1 0.0 0.0 0.0 0.0 0.0 0.0 4.6 1.6 6.1
Ports Authority of Timor-Leste 0.6 3.8 4.4 0.0 0.0 0.0 0.0 0.0 0.0 0.6 3.8 4.4
Civil Aviation 0.9 1.1 1.9 0.0 0.0 0.0 0.0 0.0 0.0 0.9 1.1 1.9
Institute of Material and Equipment 1.2 0.0 1.2 0.0 0.0 0.0 0.0 0.0 0.0 1.2 0.0 1.2
Total 7.2 6.4 13.7 0.0 0.0 0.0 0.0 0.0 0.0 7.2 6.4 13.7
- 26 - Table 6.6
Grouping of Ministries within NDP Sectors
Basic Services Sector Production Related Sector Basic Infrastructure Sector Governance Related Sectors
Health Care Agriculture, Forests and Fisheries Communications Public Sector Management
Ministry of Health Ministry of Agriculture Forests Minister of Transport and Ministry of Planning and Finance
and Fisheries Communications Ministry of State Administration
Education and Training
Ministry of Education and Culture
Natural Resources and Environment
Power Local Government
Ministry of Labour and Solidarity Ministry of Youth and Sport
Ministry of Natural Resources, Minerals and Energy Policy
Ministry of Natural Resources, Minerals and Energy Policy
Ministry of State Administration
Social, Civil and Heritage Protection Private Sector Development Transportation Rights, Equality and Justice Ministry of Labour and Solidarity Ministry of Development Minister of Transport and
Communications
Office of the Adviser to the Prime Minister on the promotion of Human Rights
Office of the Prime Minister and Presidency of the Council of Ministers
Office of the Adviser to the Prime Minister
on the promotion of Equality
Ministry of Justice
Water Supply and Sanitation Provedor of Human Rights Ministry of Natural Resources, Prosecutor General Minerals and Energy Policy Tribunals
Security, Peace building and Reconciliation
Ministry of Defence
National Police of Timor-Leste
Housing and Urban Development External Relations and Cooperation
Ministry of Public Works Ministry of Foreign Affairs and Cooperation
Other Pillars of State
Office of the President of the Republic
National Parliament
Banking and Payments Authority
Ministry of Labour and Solidarity
Office of the Prime Minister and Presidency
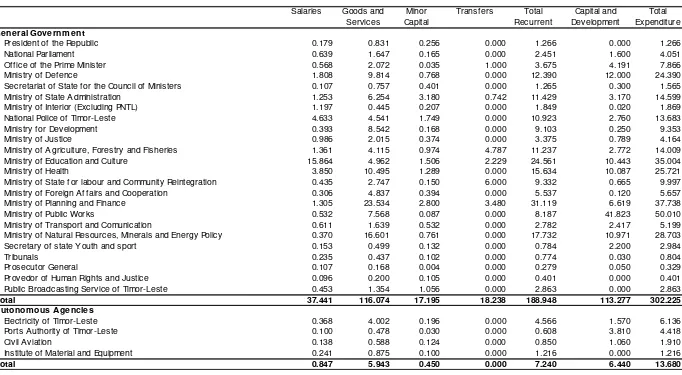
- 27 - Table 6.7
General Budget of the State Total Allocations by Ministry 2006-07
Salaries Goods and Services
Minor Capital
Transfers Total Recurrent
Capital and Development
Total Expenditure General Governm ent
President of the Republic 0.179 0.831 0.256 0.000 1.266 0.000 1.266
National Parliament 0.639 1.647 0.165 0.000 2.451 1.600 4.051
Of fice of the Prime Minister 0.568 2.072 0.035 1.000 3.675 4.191 7.866
Ministry of Def ence 1.808 9.814 0.768 0.000 12.390 12.000 24.390
Secretariat of State f or the Council of Ministers 0.107 0.757 0.401 0.000 1.265 0.300 1.565
Ministry of State Administration 1.253 6.254 3.180 0.742 11.429 3.170 14.599
Ministry of Interior (Excluding PNTL) 1.197 0.445 0.207 0.000 1.849 0.020 1.869
National Police of Timor-Leste 4.633 4.541 1.749 0.000 10.923 2.760 13.683
Ministry f or Development 0.393 8.542 0.168 0.000 9.103 0.250 9.353
Ministry of Justice 0.986 2.015 0.374 0.000 3.375 0.789 4.164
Ministry of Agriculture, Forestry and Fisheries 1.361 4.115 0.974 4.787 11.237 2.772 14.009
Ministry of Education and Culture 15.864 4.962 1.506 2.229 24.561 10.443 35.004
Ministry of Health 3.850 10.495 1.289 0.000 15.634 10.087 25.721
Ministry of State f or labour and Community Reintegration 0.435 2.747 0.150 6.000 9.332 0.665 9.997
Ministry of Foreign Aff airs and Cooperation 0.306 4.837 0.394 0.000 5.537 0.120 5.657
Ministry of Planning and Finance 1.305 23.534 2.800 3.480 31.119 6.619 37.738
Ministry of Public Works 0.532 7.568 0.087 0.000 8.187 41.823 50.010
Ministry of Transport and Comunication 0.611 1.639 0.532 0.000 2.782 2.417 5.199
Ministry of Natural Resources, Minerals and Energy Policy 0.370 16.601 0.761 0.000 17.732 10.971 28.703
Secretary of state Youth and sport 0.153 0.499 0.132 0.000 0.784 2.200 2.984
Tribunals 0.235 0.437 0.102 0.000 0.774 0.030 0.804
Prosecutor General 0.107 0.168 0.004 0.000 0.279 0.050 0.329
Provedor of Human Rights and Justice 0.096 0.200 0.105 0.000 0.401 0.000 0.401
Public Broadcasting Service of Timor-Leste 0.453 1.354 1.056 0.000 2.863 0.000 2.863
Total 37.441 116.074 17.195 18.238 188.948 113.277 302.225
Autonom ous Agencies
Electricity of Timor-Leste 0.368 4.002 0.196 0.000 4.566 1.570 6.136
Ports Authority of Timor-Leste 0.100 0.478 0.030 0.000 0.608 3.810 4.418
Civil Aviation 0.138 0.588 0.124 0.000 0.850 1.060 1.910
Institute of Material and Equipment 0.241 0.875 0.100 0.000 1.216 0.000 1.216