Gravity
Some Gravity Basics
Newton’s Law of Gravitation states that the force of attraction Fbetween two
masses m1and m2whose dimensions are small with respect to the distance r
between them is given by the equation below, where G is the Gravitational Constant (6.67x10⁻¹¹m3kg-1s-2).
m1 m2
r
•The attractive force between two small masses is proportional to the product of their masses – doubling either mass doubles the force, doubling both masses quadruples the force.
•The attractive force is inversely proportional to the square of the separation – doubling the separation reduces the attraction by a quarter.
Some Gravity Basics
For the case of a mass above the earth we can re-write the previous equation
using MEas the mass of the Earth, msas the mass of the object, and REas
the distance between the centers of the objects
2
•Force is related to mass by acceleration, and the term g is known as the gravitational acceleration.
•In the case of a uniform sphere, it can be approximated to a “point mass” of smaller radius but equal mass.
•The attractive force of an irregular body can be calculated by approximating it as a series of smaller bodies.
ms RE
ME
Some Gravity Basics
•On a spherically symmetric earth the value of g would be the same everywhere.
• We would not know anything about the composition of the earth – it could be a hollow shell, have a hollow center, etc.
•Luckily the earth is highly heterogeneous.
What is the mass of the earth?
Radius at equator = 6378160 m
G = 6.672x10⁻¹¹m3kg-1s-2
g = 9.78 ms-2
The Mass of the Earth
kg
What assumptions are made??
Using this mass, we can calculate that the average density of the earth is about 5500 kg m-3(5.5 Mg m-3).
What is wrong with this number given the values in the adjacent table?
F
rom
Kear
ey
Rock Densities
•In the case of a homogeneous, spherically symmetric earth, gravity is constant. This is obviously not the case in reality. Gravity varies over the earth’s surface for a number of reasons, one of which is variations in density.
•Density is typically measured in units of kg m-3– how do we measure density?
•Most common rocks range in density from 1500-3000 kg m-3(e.g. granite =
2500-2800 kg m-3, basalt = 2700-3000 kg m-3). A few metalliferous ores have densities well
above 3000 kg m-3(e.g. magnetite ore = 4900-5300 kg m-3).
•Densities of common rocks overlap, so they have limited use for lithological identification.
•Densities of weathered and/or exposed rocks tends to be less than their buried counterparts, so care has to be taken when collecting samples for density measurements and when interpreting gravity surveys -- WHY??
•Gravity anomalies are the result of density contrasts. 2400 kg m-3
2700 kg m-3
•In this example, the density contrast, Δρ,
= 300 kg m-3. What might these rock types
be??
Gravity Units
Gravity variations are very small. Suppose that in the previous example the center of the sphere is at a depth of 100 m and it has a radius of 50 m.
•If an object is dropped on the ground above the sphere it will fall with a little greater acceleration than an object dropped to the side. The excess gravity due to the sphere is:
Δρ= 300 kg m-3
•As would be expected, this is a very small value, and rather inconvenient to use. To make things easier, we use mGal (note that G is capitalized to honor Galileo).
1 mGal = 10-5m s-2
Measuring Gravity
1. Time the fall of an object – this can be done accurately in the lab, but it is not practical for the field. Absolute gravity.
2. Measure the period of a pendulum – the period depends on the dimensions of the pendulum and the value of gravity. Same problems as 1. Accuracy of 0.001 mGal. Absolute gravity.
3. Measure relative gravity using the principles of a spring balance. This can be converted to absolute gravity by taking a measurement at a point where absolute gravity is known.
Here, an increase in gravity has caused an increase in the weight of a mass, resulting in a spring of length s being
stretched by an amount Δs. The extension of the spring is
proportional to the extending force (Hooke’s Law).
g
k
m
s
s
k
g
m
Δ
=
Δ
and
Δ
=
Δ
kis the elastic spring constantMeasuring Gravity
Δs, the extension of the spring, must be measured to an accuracy of 1:108for
gravity surveying on land. This is the same as, measuring the distance from here to Birmingham (assuming 80 km) to an accuracy of 0.8 mm.
In this example, the fact that the spring acts as a
measuring device and a support for the mass restricts the accuracy of the instrument. This was however the basis of
early instruments known as stable gravimeters From
Kear
ey
Unstable Gravimeters
The problem of a dual role spring is overcome in an unstable gravimeter, an example of which is the LaCoste and Romberg gravimeter.
•The meter consists of a hinged beam carrying a mass supported by a spring attached immediately above the hinge.
•The magnitude of the moment exerted by the spring on the beam is dependant upon the extension of the spring and the sine of the angle θ.
•By suitable design of the spring and beam geometry the magnitude of the increase in restoring force with increasing gravity can be made as small as possible.
•A zero-length spring is used -- pre-tensioned in manufacture so that the restoring force is proportional to the physical length of the spring rather than the extension.
•The instrument is read by restoring the beam to horizontal by altering the vertical location of the spring attachment. The number of screw turns is the reading.
F
rom
Kear
ey
et al., 2002
Unstable Gravimeters
As changes in temperature can cause changes in the length of the spring, a thermostat keeps the instrument at a constant temperature. Other things to worry about:
•Make sure the meter is perfectly level.
•Check the meter temperature.
•In a micro-gravity survey make sure that you always take the
measurements from the same side of the meter.
•Take notes about the terrain immediately surrounding the meter (e.g. are you next to a boulder).
•Don’t take readings following an earthquake.
•Don’t bump the meter.
Unstable Gravimeters
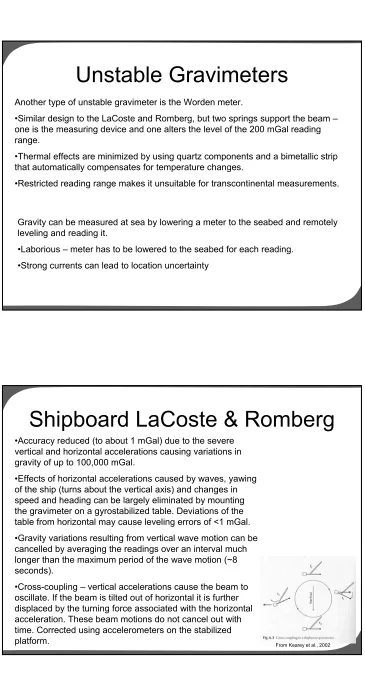
Another type of unstable gravimeter is the Worden meter.
•Similar design to the LaCoste and Romberg, but two springs support the beam – one is the measuring device and one alters the level of the 200 mGal reading range.
•Thermal effects are minimized by using quartz components and a bimetallic strip that automatically compensates for temperature changes.
•Restricted reading range makes it unsuitable for transcontinental measurements.
Gravity can be measured at sea by lowering a meter to the seabed and remotely leveling and reading it.
•Laborious – meter has to be lowered to the seabed for each reading.
•Strong currents can lead to location uncertainty
Shipboard LaCoste & Romberg
•Accuracy reduced (to about 1 mGal) due to the severe vertical and horizontal accelerations causing variations in gravity of up to 100,000 mGal.
•Effects of horizontal accelerations caused by waves, yawing of the ship (turns about the vertical axis) and changes in speed and heading can be largely eliminated by mounting the gravimeter on a gyrostabilized table. Deviations of the table from horizontal may cause leveling errors of <1 mGal.
•Gravity variations resulting from vertical wave motion can be cancelled by averaging the readings over an interval much longer than the maximum period of the wave motion (~8 seconds).
•Cross-coupling – vertical accelerations cause the beam to oscillate. If the beam is tilted out of horizontal it is further displaced by the turning force associated with the horizontal acceleration. These beam motions do not cancel out with time. Corrected using accelerometers on the stabilized
Bell BGM3 Gravimeter
•Mounted on a stable platform.
•Accelerometer (34 mm high, 23 mm in diameter) consists of a mass wrapped in a coil that is constrained to move only vertically between two permanent magnets.
•A DC current passed through the coil causes the mass to act as a magnet.
•In the null position the weight of the mass is balanced by the forces exerted by the permanent magnets.
•When the mass moves vertically due to waves or a change in gravity the motion is detected by a servo loop which regulates the current in the coil, driving the mass back to the null position.
•The varying current is a measure of the change in gravity.
•Lower drift rate than many meters.
F
rom
Kear
ey
et al., 2002
Field G Reading
Processing step: 1
Scaling
Feedback Corr.
Eq. Height Corr.
Tidal corr.
Drift corr.
Base Network corr.
Absolut G
1
2 2
3
3
1
4
5
Field Base PSE Base Field
4
Gravity Reduction
Tidal Correction
•Gravity measured at a fixed location will vary with time because of periodic variations in the gravitational effects of the Sun and Moon.
•These gravitational effects also cause the shape of the earth to vary in much the same way that the celestial attractions cause tides in the sea.
•Solid earth tides are smaller than oceanic tides and lag further behind lunar motion (the effect of the moon is greater than that of the sun).
•Solid earth tides cause the elevation of a point to vary by a few cm, thus varying its distance from the center of the earth.
•Maximum amplitude of 0.3 mGal.
•Tidal variations are predictable and can be easily calculated.
Gravity Reduction
Drift Correction
•Over time the spring in a LaCoste and Romberg gravimeter will gradually extend.
•If at the end of every day we take a reading at a base station we can track the drift rate of the meter.
•If we assume that the meter drifts linearly, we can remove the effect of drift from measurements taken during the day
•The more accurate the survey, the more frequently you should visit the base station.
F
rom
G
oodliff
e
,
1
Gravity Reduction
Latitude Correction
• Gravity varies with latitude because:
1. The Earth is not spherical. Centrifugal force has given it an equatorial bulge. Thus a point on the equator is further away from the center of the earth. This acts to reduce gravity. The amplitude of this effect is reduced by the fact that the mass underlying equatorial regions is greater than that underlying polar regions.
2. The angular velocity of a point on the earth’s surface decreases from a maximum at the equator to zero at the poles. This acts to fling bodies away from its rotation axis.
• Gravity at the poles exceeds gravity at the equator by ~5,186 mGal.
F
rom
Kear
ey
et al., 2002
Gravity Reduction
Latitude Correction (continued)
• As both effects vary with latitude they can be combined into a single formula,
Caliraut’s formula.
)
2
sin
0000059
.
0
sin
0053924
.
0
1
(
8
.
978031
2θ
2θ
θ
=
+
−
g
Where gθis the predicted value of gravity at latitude θand 978031.8 is the value of gravity at the equator. The equation with the above constants is also know as the International Gravity Formula 1967.
The value gθgives the predicted value of gravity at sea-level at any point on the
Processing step: 2
Absolute G
Normal G Corr.
Free air Corr.
Simple Bouguer Correction
Height
B density 2.69*
*Nettleton (1976) **Forsberg (1984) Topo & Bathymetri
Correction** GTOPO30
Complete G Bouguer anomaly
Regional Corr. Modelling
WGS’84
•The free-air correction is one of three topographic corrections. Two more will follow.
•The free-air correction (FAC) corrects for the decrease in gravity with height that is due to an increased distance from the center of the earth – remember:
•To reduce to datum an observation taken at height h:
meters)
•The FAC is positive for an observation point above the datum to correct for the decrease in gravity with elevation.
Gravity Reduction
•The second topographic correction is the Bouguer correction. The FAC takes into account the height of the station – the gravitational attraction of the rock between the observation point and the station is ignored.
•The Bouguer correction removes the effect by approximating the rock layer beneath the observation point as an infinite horizontal slab with a thickness equal to the elevation of the observation above the datum.
•On land the Bouguer correction must be subtracted, as the gravitational attraction of the slab needs to be removed.
•At sea the correction is positive to account for the lack of rock between the surface and the sea bead – the water is replaced by rock. The above equation becomes:
z
•The final topographic correction. The Bouguer correction make the assumption that the topography around the observation point is flat – this is rarely the case.
•This correction is always positive.
•The regions designated A forms part of the Bouguer correction slab although they do not exist. The Bouguer correction has hence overcorrected and their effect must be restored.
•Region B consists of rock that has been excluded from the Bouguer correction. It exerts an upward attraction at the observation point causing gravity to decrease. Its attraction thus must be added.
F
rom
Kear
ey
Gravity Reduction
Terrain Correction (cntd)
•Terrain corrections are classically carried out using a Hammer chart.
•Divided by radial and concentric lines into 130 compartments.
•Outermost zone extends to almost 22 km – beyond this topographic effects are usually negligible.
•Chart is laid on a map with the observation point at its center – the average elevation of each compartment is calculated and the elevation of the observation point subtracted.
•Gravitational attraction of each compartment is determined by reference to tables.
•The terrain correction is the sum of all the compartments
•It is difficult to fully automate this step, especially for the inner rings of the hammer chart
Gravity Reduction
F
rom
Kear
ey
et al., 2002
F
rom
Kear
ey
et al., 2002
F
rom
Mus
s
ett
and Kha
n
, 20
Gravity Reduction
Eötvös Correction
•Applied to gravity measurements taken on a moving vehicle, e.g., a ship or a helicopter.
•Depending on the direction of travel of the vehicle, the motion will generate a centripetal acceleration which either reinforces or opposes gravity
•The correction is:
mGal
•The correction is positive for motion from east to west.
•Approximately 2.5 mGal for each kph in an east-west direction at 55oN
Free-air and Bouguer Anomalies
)
Gravity Anomalies
2 r Gm gr= Δ
The gravitational attraction in the direction of the mass is given by:
Since a gravity meter only measures the vertical component of the attraction Δgz, the gravity anomaly Δgcaused by the mass is:
3 2 cos or
r Gmz g r
Gm
g= Δ =
Δ θ
F
rom
Kear
ey
et al., 2002
Gravity Anomalies
3 r Gmz g=
Δ
This equation can be used to build up the gravity anomaly of many simple geometric shapes by constructing them from a suite of small elements which correspond to point masses and then summing (integrating) the attractions of these elements to derive the anomaly of the whole body.
Integration of the above equation in the horizontal direction provides the equation for a line mass extending to infinity in that direction:
2
2
r
Gmz
g
=
Indirect Density Determination
Nettleton’s Method
Now that we have defined the Bouguer anomaly we can discuss an alternative method for regional density determination.
•Gravity data over an isolated prominence are reduced using a series of different densities for the Bouguer and terrain corrections.
•The density that yields a Bouguer anomaly with the least correlation (+ve or –ve) with the
topography is taken to represent the average density of the
prominence.
F
rom
Kear
ey
et al., 2002
Indirect Density Determination
P-Wave Velocities
F
rom
Kear
ey
Regional and Residual Anomalies
The gravity anomaly of interest may be superimposed on a regional anomaly.
•Estimation and removal of the regional field may be done graphically, or by analytically calculating and removing a trend surface. A high-pass filter could also be used to isolate the trend surface.
•It is necessary that the regional anomaly be removed prior to modeling the anomaly so that we are sure that the gravity anomaly is not due to any other factors.
F
rom
Kear
ey
et al., 2002
Direct Interpretation
The shape and size of the anomaly provides some information on the anomalous body independent of the true shape of the body.
Half-width method
•The half-width of the anomaly (x1/2) is the horizontal distance from the
anomaly maximum to the point at which the anomaly has reduced to half its maximum value.
•If the anomaly results from a point mass the depth is:
1 4 3
2 1
−
= x
z
•As this is the depth to the center of mass it is an
overestimate of the depth to the top of the body.
F
rom
Kear
ey
Direct Interpretation
•The excess mass (the difference in mass between the body and the mass of the country rock that would otherwise occupy the space) can be uniquely determined.
•The survey is divided into ngrid squares of area Δaand the mean residual
anomaly Δgis found for each. The excess mass is then given by:
•To compute the actual mass Mof the
body the densities of both the
anomalous body (ρ1) and the country
•This method can be used to estimate, for example, the tonnage of an ore body.
F
•The location of an inflection point on gravity anomaly, i.e. the position where the horizontal gravity gradient changes most rapidly, can provide information on the nature of the edge of an anomalous body.
•Over structures with outward dipping contacts the inflection points lie near the base of the anomaly
•Over structures with inward dipping contacts (sedimentary basins) the inflection points lie near the uppermost edge of a body.
•Over a tabular body, the inflection points delineate the body.
F
rom
Kear
ey
Indirect Interpretation
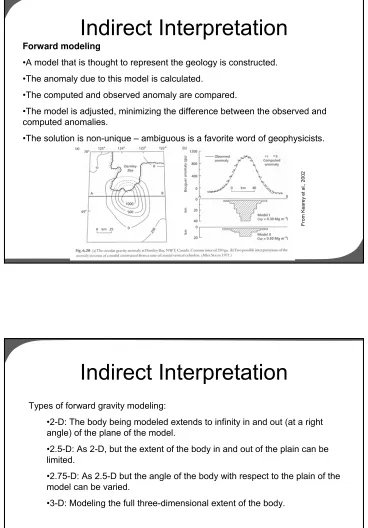
Forward modeling
•A model that is thought to represent the geology is constructed.
•The anomaly due to this model is calculated.
•The computed and observed anomaly are compared.
•The model is adjusted, minimizing the difference between the observed and computed anomalies.
•The solution is non-unique – ambiguous is a favorite word of geophysicists.
Fig. 6.20
F
rom
Kear
ey
et al., 2002
Indirect Interpretation
Types of forward gravity modeling:
•2-D: The body being modeled extends to infinity in and out (at a right angle) of the plane of the model.
•2.5-D: As 2-D, but the extent of the body in and out of the plain can be limited.
•2.75-D: As 2.5-D but the angle of the body with respect to the plain of the model can be varied.
•3-D: Modeling the full three-dimensional extent of the body.
Inverse modeling
Sedimen Paleogen (2.63 gr/cc)
Pre-Tersier (2.75 gr/cc) Sedimen Neogen (2.5 gr/cc) Sedimen Kuarter (1.59 gr/cc)
Batuan Terobosan (2.78 gr/cc)
F.Semilir – Neogen2 (2.54 gr/cc)
F.KeboButak- Neogen1 (2.1 gr/cc) F. Nglanggran – Neogen3 (2.5 gr/cc) F. Wonosari (2.0 gr/cc)
F. Oyo (2.21 gr/cc)