48
In this chapter, the writer presented the data which had been collected from the research in the field of study. The data were the result of observation, the result of English learning motivation and reading comprehension test, the result of data analysis, and discussion.
A. The Result of Students‟ English Learning Motivation Test
In the study, the writer did observation for twice, at the first observation, the writer observed the number of first semester students of English study program. It was 101 students. But, in the study, the writer just taken 94 students as participants because 7 students could not attend to the test. Then the second observation, the writer observed the place of female‟ dormitory and male‟ dormitory, and decided the time to do the test.
English Learning Motivation Test done at Sunday, 23 September 2012 in Darussalam Mosque after morning activity of Ma‟had Al Jami‟ah. After finding the data of students‟ English learning motivation test, the writer calculated the score. The result of the test could be seen in appendix 1. Then, based on the data, it could be seen that the students‟ highest score was 99 and the student‟s lowest score was 68. To determine the range of score, the class of interval, interval of temporary, the writer calculated using formula as follows:
The lowest score (L) = 68
The range of score (R) = H-L+1
= 99 – 68 + 1
= 31 + 1
= 32
The class interval = 1 + 3.3 log n (Sturgess formula)
145
= 1 + 3.3 log (94)
= 1 + 3.3 (1. 9731278535)
=1 + 6. 51132191655
=7. 51132191655 = 8
So, the range of score was 32 and the class of interval was 8.
To know the interpreted of motivation of each student, the writer
calculated the percentage of student‟s motivation ( see in appendix 3 ) where the
interpretation score was rated as follow146:
145
Riduwan, Metode dan Teknik, p. 188.
146
Table 4.1 The Interpretation of Motivation presented using frequency distribution in the following table:
Figure 4. 1 The Frequency Distribution of Motivation Score of Each Student.
learning English, there were 28 students that indicated as strong motivation and there is no student that indicated moderately, low, and very low motivation. B. The Result of Students‟ Reading Comprehension Test
In the study, the writer did two times for test, the first test was held on Saturday, September 29, 2012; at 07.00 p.m. up 09.00 p.m in dormitory of female, and the second test was held on Saturday, October 06, 2012; at 07.00 p.m up 09.00 p.m in dormitory of male. The next step, the writer calculated the reading comprehension test score that the result of the test could be seen in appendix 3.
Based on the reading comprehension test score as data, it could be seen that
the students‟ highest score was 74 and the student‟s lowest score was 20. To
determine the range of score, the class interval, and interval of temporary, the writer calculated using formula as follows:
The Highest Score (H) = 74
The lowest Score (L) = 20
The Range of Score (R) = H-L+1
= 74 – 20 + 1
= 54 + 1
= 55
Interval (I) = = (10-20)
So, the range of score was 55, the class interval was 11, and interval of temporary was 5. It was presented using frequency distribution in the following table:
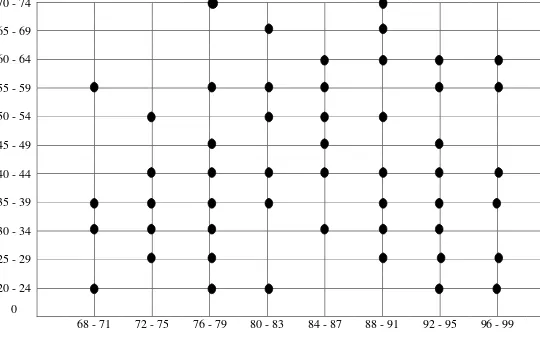
Figure 4. 2 The Frequency Distribution of Score of Reading
Comprehension Test
It could be seen from the figure above, the frequency distribution of
students‟ score of reading comprehension test. There were two students who got
score 69. 5 – 74. 5 and two students who got 64. 5 – 69. 5. There were eight students who got score 59. 5 – 64. 5 and eight students who got 54. 5 – 59. 5. There were five students who got score 49. 5 – 54. 5. There were four students who got score 44. 5 – 49. 5. There were fifteen students who got score 39. 5 – 44. 5. There were thirteen students who got score 34. 5 – 39. 5. There were nineteen students who got score 29. 5 – 34.5. There were nine students who got score 24. 5
C. Testing Hypotheses
a. Testing Hypotheses Using Manual Calculation The hypotheses of the study are:
Ha : There is a significant positive correlation between the learning
motivation and the students‟ reading comprehension.
Ho : There is not significant positive correlation between the learning
motivation and the students‟ reading comprehension.
To test the hypothesis of the study, the writer used rtable statistical
Map of correlation “r” product moment
Figure 4.3 Map of Correlation „r‟ Product Moment
From Map of correlation “r” product moment above, it is known that:
N ̀ ̀ ̀ ̀ ̀
94 13 2 420 -116 798
Where:
N = Number of students
̀ ̀ = Multiplication result between cell frequency (f) with x‟ and y‟
̀ = Multiplication result between the frequency of the midpoint of each
interval
̀ = Multiplication result between the frequency of each interval with x‟2
̀ = Multiplication result between the frequency of the midpoint of each
interval
= Multiplication result between the frequency of each interval with y‟2
Then, calculated the result of calculation of scatter figure of correlation „r‟ product moment in the following formula:
̀ = ̀ =
= 0. 021277
̀ = ̀ =
= -1. 234043
̀ = √ ̀ ( ̀)
= √
( )
= √ ( )
√
= √
= 2. 113677
̀ = √ ̀ ( ̀)
= √
(
)
= √ ( )
= √
= √
= 2. 639413
=
̀ ̀ ( ̀) ( ̀)
( ̀) ( ̀)
=
– ( ) ( )
( ) ( )
= ( )
=
= 0. 029496
= 0. 029
The last step, the writer compared the r observed with r table to see whether
there was a correlation or not between the students English learning motivation and their reading comprehension of English text. Firstly, the writer accounted the degree of freedom (df) with the formula:
df = N – nr
= 94 – 2
= 92
so, df = 92, because there is no df for 92, it is used df for 100 where it found in “r” table (rt) in 5% of the significance level is 0. 195. Then, it found that ro (0.029) is
conclusion that HO was received and Ha was rejected. It meant that student‟s English learning motivation did not influence to the student‟s reading
comprehension of English text.
In other interpretation, the result of correlation calculation between learning motivation and reading comprehension still had relationship in very low level, although it was neglected. Therefore, the student‟s learning motivation may
influence the student‟s reading comprehension in a little bit. It is according to the
interpretation below147: variable but it is very low, then it is neglected.
0.20 – 0. 40
There is a very strong variable between X variable and Y variable.
147
It also can be seen in the correlation map or scatter diagram below that the
students‟ learning motivation and the students‟ reading comprehension had very
low correlation which showed by spreading of the scatter points out on the map further away from the linear line. It based statement that either positive or negative correlation is said to be moderate correlation and a low correlation, if the scatter points on the correlation map is much more spread out or away from the linear line.148
Figure 4.4 Scatter Diagram
148
Ibid, p. 182. 70 - 74
65 - 69 60 - 64 55 - 59 50 - 54 45 - 49 40 - 44 35 - 39 30 - 34 25 - 29 20 - 24
0
b. Testing Hypotheses Using SPSS Statistic 19 Calculation
In testing the hypotheses of the study, the writer also applied SPSS Statistic 19 to calculate correlation „r‟ product moment as supporting the result of manual calculation. Then, the result of calculation correlation „r‟ product moment using SPSS Statistic 19 could be seen as follow:
Reading Motivation
Reading Pearson Correlation 1 .025
Sig. (2-tailed) .809
N 94 94
Motivation Pearson Correlation .025 1
Sig. (2-tailed) .809
N 94 94
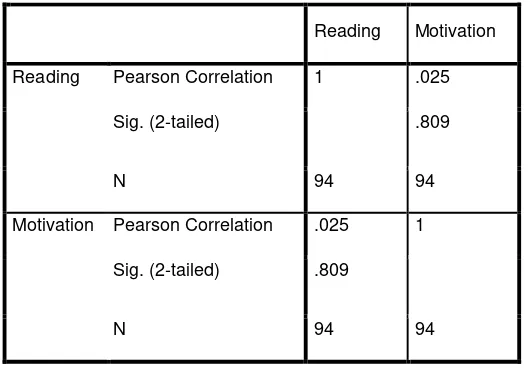
Table. 4. 5 The Result of Correlation ‘r’ Product Moment Using SPSS
Statistic 19 Program.
From the table, it can be seen that Pearson „r‟ product moment for the
correlation between Reading Comprehension and English Learning Motivation is 0. 025 where the correlation is significance at the 0. 01 level (2-tailed). So, the Pearson Correlation close to „0‟ which means the changes in one variable are not
correlated with changes in second variable149. It could conclude that the variables
149
help-for-were not correlated where in Statistic SPSS 19 calculation robserved was lower than
rtable at 0. 01 significance level or 0. 025 < 0. 195.
D. Discussion
The research problem of the study was “What is the relationship between
the learning motivation and the students‟ reading comprehension?”. Then, to find
the answer of the question in the research problem, the writer applied the
correlation “r” product moment formula.
The result of the data which found by calculating the students‟ learning
motivation score and the students‟ reading comprehension score used the
correlation “r” product moment formula showed that the relationship between the
learning motivation and the students‟ reading comprehension was negative. It
meant that there was no relationship between the learning motivation and reading comprehension of the students.
Although motivation is the most basic aspect of the human mind and it has a very important role in determining success or failure in any situation.150 The result of the study was different with the theory, where there was not significant relationship between the learning motivation and the reading comprehension. In other word, learning motivation did not affect the reading comprehension of the students.
students.com/How_do_I_interpret_data_in_SPSS_for_Pearsons_r_and_scatterplots.htm#.UXimE EqCZDU (accessed on Thursday, April 25, 2013).
150
Based on the result of hypotheses calculation, it was found the value of robserved was lower than the value of rtable in 5 % significant level, it was 0. 029 < 0.
195. It meant Ha was rejected and Ho was accepted. Then, the calculation was be
strengthened by SPSS statistic 19 calculation which the result 0. 025 < 0. 195 where meant Ho was accepted or there is not significant positive correlation
between the learning motivation and the students‟ reading comprehension. Therefore, the high motivation or the low motivation did not give effect to the
students‟ comprehension on English text.
The result of study is supported by scatter diagram or map of correlation which showed the spreading out of the scatter points further linear line. The spreading out of the scatter points further linear line means that the students‟
learning motivation and the students‟ reading comprehension have very low
correlation then it is considered nothing. In sum up, the students‟ learning
motivation does not give effect to the students‟ reading comprehension, if it has only in a little bit.
The different result of study to the theory which stated that someone will be success in studying everything if there is desire (motivation) to learn might be caused the supporting factors in foreign language learning was very little or nothing. There were other factors which affected the students‟ achievement, such as the background of family, the condition of school, etc.151 Whereas based on Zoltan Dornyei, human behavior is very complex, influenced by a great number of factors ranging from basic physical needs through well- being needs to higher
151
level values and beliefs.152 Then, the writer related the result of study where the high motivation or low motivation did not affect the students‟ reading
comprehension to the mastery of students‟ reading strategies.
Reading strategies is considered as facilitating the reading process and giving the student a clear sense of what they are reading.153 The strategies are also result the reading comprehension when the reader knows and understands which strategies and skill are appropriate to apply.154 In addition, there are eight important reading comprehension skills that help the students to read more systematically, they are comprehending main ideas, determining the author‟s purpose, distinguish between main idea and supporting details, making inference, distinguish facts and opinions, analyzing structures, annotating, paraphrasing and summarizing.155 Then, the students as the participant of the study came from different area of Borneo center where the progress of teaching learning process cannot be generalized. It might be caused many students did not mastery the reading strategies well where their teacher did not teach them or was not able to teach them reading strategies and other skill in reading. Therefore, the students got difficulties to comprehend English text.
152
Zoltan Dornyei, Motivational in the, p. 7.
153 Lia Agustina, “The Importance of, p. 76.
154
Ibid, p. 75.
In other reason, the integrative and instrumental motivation refer to the purpose for learning and not refer to the intensity of one‟s impetus to learn.156 So, the effect of students‟ motivation in integrative and instrumental were not too
enough to upgrade the students‟ ability in comprehending English text. In sum up,
a wish to reach the success and ambition itself are not enough without existing work hard.
156