WASTE REDUCTION IN THE PRODUCTION PROCESS PLATE PRODUCT
TYPE PC 27 C USING VALUE STREAM MAPPING METHOD PT. XYZ
Iphov Kumala Sriwana, Arie Wijaya
Department of Industrial Engineering, Faculty of Engineering, Esa Unggul University [email protected]
ABSTRACT
PT. XYZ is a ceramic or porcelain manufacture. One product that is made is the plate with type PC 27 C. One problem that occurs is the detection of high waste by increasing the amount of WIP inventory (products white body), so the analysis using value stream mapping in order to identify the waste that occurs in the manufacture of ceramic production activity with 27 C-type PC and the ratio of value added analysis. The result showed that the value of an increase in the ratio of value added is from 12:10% to 70.93%.
Keywords : Value Stream Mapping, ratio of value added
1. INTRODUCTION 1.1. Background
PT. XYZ is a ceramic or porcelain manufacture. To produce the products according to customers requirements, it is very important to ensure any activity that occurs in the production activities carried out effectively and efficiently. It required an approach that can identify and eliminate waste activities.
Waste that occurs in PT XYZ was never properly taken into account because companies only focus on the use of gas fuel system for the kiln. Efficient use of gas for the production of excessive corporate conduct without taking into account the cost savings arising from excessive WIP storage.
In an effort to identify and eliminate waste, there are several types of waste that is disguised or interconnected with other waste within or between the various processes and activities although some waste is another fairly easy to recognize and measure. Therefore, efforts to eliminate a particular type of waste sometimes even improve other types of waste. Problems of this kind are sometimes causes difficulty identifying and eliminate waste.
1.2. Purpose
To identify waste in the production process of ceramic
To analysis the ratio of value added
2. THEORETICAL BACKGROUND 2.1. Lean management
Lean is a business philosophy, not just techniques or tools. Lean means doing things in a simple way and efficient as possible, but still provide the best quality and very fast service to customers. Management of the organization needs to absorb Lean thinking It needs to be invested in the form of culture, measures, policies, procedures and in the end is on the tools or techniques of lean. The basic concept of lean manufacturing are: identify waste, pull
production, standardize processes, quality at the source, continues flow and continues improvement.
Lean Production means "doing more and more with less and less”. Application of Lean Production will create the production process flows are drawn and controlled in accordance with customer requests and to eliminate excess inventory.
2.2. Value stream mapping
value added if it adds value for the end handling. According Gaspersz (2012), the non-value added but necessary, though not necessarily immediately, as much as possible reduced or eliminated while the non-value added and not Necessary should be prioritized to be eliminated. Based on the Toyota production system, there are seven kinds of waste are as follows : waste ofOver production, waiting time (delay), excessive transportation, Inappropriate processing,
excessive inventory, unnecessary motion, defect.
3. RESULT AND DISCUSSION 3.1. Data Processing
To determine the flow of information through which the material in the production of porcelain plates with the type of PC 27 C, we can use the SIPOC Chart (Supplier, Input, Process and Output Customer) as shown in Table 1.
SIPOC chart in Table 1 illustrate that to produce a plate product with type PC 27 C occurred approximately 8 major processes that must be passed. That is material processing, forming processes, process
bisque kiln, glazing process, the process of decoration, decal firing process, and the final packing process. Observations will be conducted at 8 activity contained in the main process.
Table 1 Supplier Input Process Output Customer (SIPOC)
Supplier Input Process Output Customer
Production
3.2. Detail Mapping
Based on observations of activity in 8 major processes (SIPOC diagram), then created detailed maping using map Process activity mapping can be seen in Table 2.
Table 2. Process Activity Mapping
NO ACTIVITY TIME (in sec) MECHINE /TOOLS
1 Transportation of raw materials
warehouse to the weight 133.2 Forklift 1 112.48
2 weighing process 124.3 Weight 2
3 Transport from the weight to materials /
milling process 121.5
Cargo lift &
lorries 2 18.5
4 Materials wait in front of the machine
Ball Mil 86,400
5 Ball Mill processing 28,800 Ball Mill 3
6 Mixing process 86,400 Mixing machine
7 filter press machine disassembly 367.4 Filter Press
machine 2 8 Transportation from filter press
Table 2. Process Activity Mapping
NO ACTIVITY TIME (in sec) MECHINE /TOOLS
QTY OF LABOR
WITHIN (meters)
O T I S D
14 Forming process 23.7 Forming 1
15 Drying process 1,380 Dryer
16 Kerik process 22.1 Cuter 1
17 Green ware finishing process 11.6 Finishing
machine 1
18 Transportation to kiln bisque machine 26.6 Conveyor 20.2
19 Loading green ware to the train 25.8 Train 4 2
20 Waiting for kiln bisque process 43,962.5
21 kiln bisque process 48,000 Kiln
machine 1
22 Waiting to unloading bisque from train 1,182.5
23 unloading bisque 429.2 3 1.7
24 Bisque inspection 18.94 2
25 Store bisque impermanent 86,400
26 Transportation to spray process 64.8 Hand Lift 1 5
27 Spray process 7.4 Compress
or 1
28 Transportation from sprayer to glaze
process 44.8 Conveyor 17
29 Glaze process 7.9 Liquid
glaze 1
30 Transportation to glaze kiln machine 27.0 Conveyor 11
31 loading bisque to the train 40.0 Train 4 1.3
32 Waiting to glaze kiln process 1,260
33 glaze kiln process 18,480 Kiln
machine
34 Cooling process of glaze kiln 420 Fan
35 unloading white body to the train 109.4 2 1.3
36 Grinder process 5.1 Grinding
machine 1 37 Transportation to quality inspection
process 441.0 Conveyor 27.7
38 Waiting for inspection process 791.8
39 Quality inspection process 7.0 1
40 Transportation from inspection process to loading area 58.0 Conveyor 4
41 Moved to other conveyer 43.0 Conveyor 1 3.6
42 loading white body to train 17.6 Train 3
43 Transportation to white body warehouse 47.7 Hand Lift 2 4.4
44 unloading & loading white body from
train to pallet 1,839.3 Pallet 2
45 Store white body in white body
warehouse 2,592,000
46 Transportation to decoration process 292.3 Hand Lift 2 14
47 decoration process 43.7 1
48 Loading plate to train 321.8 Firing train 1 3
49 Firing process 10,800 Firing train
50 unloading plate from train 207.2 1
51 Transportation to decoration area 53.0 Conveyor 2 16
52 Store in decoration area 28,800
53 Transportation from decoration area to
packaging section 300.3 Hand Lift 2 23
54 Prepare packaging cardboard 34.1
2
55 Packaging process 11.2
56 Transportation to finished good warehouse 216 1 45
Total 197,020.07 2,978.01 25.94 2,793,911.23 133,596.83 3,127,532.08
Table 3. Value Added Activity Value added
1 weighing process 124.3 Sec
2 Materials wait in front of the machine Ball Mil 86,400.0 Sec
3 ball mill processing 28,800 Sec
4 Mixing process 86,400 Sec
5 filter press machine disassembly 367.4 Sec
6 Stored cake in cake area 86,400 Sec
7 Extruder process 17 Sec
8 Forming process 23.7 Sec
9 Drying process 1,380 Sec
10 Kerik process 22 Sec
11 green ware finishing process 11.6 Sec
12 kiln bisque process 48,000 Sec
*13 Store bisque impermanent 10,800 Sec
14 Spray process 7.4 Sec
15 Glaze process 7.9 Sec
16 glaze kiln process 18,480 Sec
17 Cooling process of glaze kiln 420 Sec
18 Grinder process 5.1 Sec
19 Decoration process 44 Sec
20 Firing process 10,800 Sec
21 Packing process 11 Sec
TOTAL 378,521.78 Sec
3.3. Analysis
To facilitate the identification of waste the 56 activity in process activity mapping activities are grouped into value added, non-value added activities and non-non-value added activities but Necessary.
In table 3 (value added activity), 21 activities with the time it takes 378,521.78 seconds. At number 13, the activity retention time required to avoid defects in the next process is 3 hours, or 10,800 seconds.
Table 4 (non-value added activity but Necessary) as 30 activities with the time
required is 78,424.91 seconds and Table 5 (non-value added activity and not Necessary) as 6 activity with the time required is 2,670,585.39 seconds.
Activity number 13 in Table 3 and number 2 in table 5 is the same activity. Stored time required to avoid defects in the subsequent process is 3 hours. In fact, the storage activity performed during 1 day (24 hours). So that activities are divided into value added and non-value added, 3 hours being value added activities while the next 21 hours as a non-value added activities.
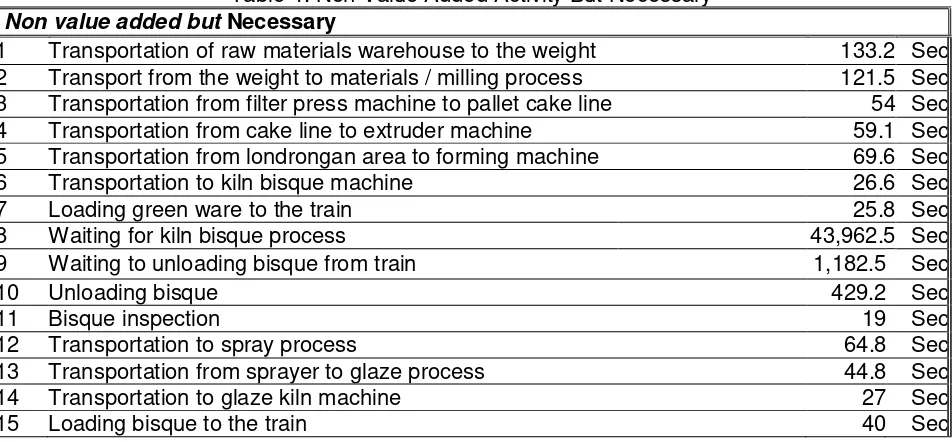
Table 4. Non Value Added Activity But Necessary
Non value addedbut Necessary
1 Transportation of raw materials warehouse to the weight 133.2 Sec 2 Transport from the weight to materials / milling process 121.5 Sec 3 Transportation from filter press machine to pallet cake line 54 Sec
4 Transportation from cake line to extruder machine 59.1 Sec
5 Transportation from londrongan area to forming machine 69.6 Sec
6 Transportation to kiln bisque machine 26.6 Sec
7 Loading green ware to the train 25.8 Sec
8 Waiting for kiln bisque process 43,962.5 Sec
9 Waiting to unloading bisque from train 1,182.5 Sec
10 Unloading bisque 429.2 Sec
11 Bisque inspection 19 Sec
12 Transportation to spray process 64.8 Sec
13 Transportation from sprayer to glaze process 44.8 Sec
14 Transportation to glaze kiln machine 27 Sec
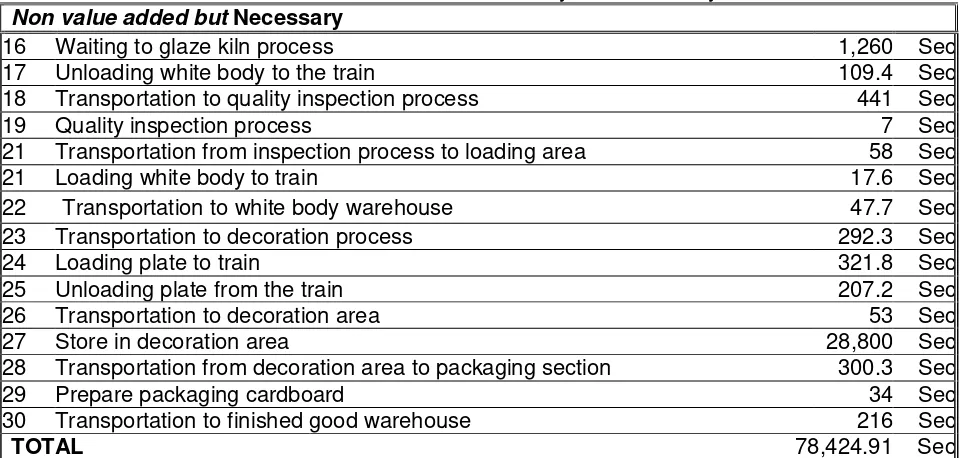
Table 4. Non Value Added Activity But Necessary
Non value addedbut Necessary
16 Waiting to glaze kiln process 1,260 Sec
17 Unloading white body to the train 109.4 Sec
18 Transportation to quality inspection process 441 Sec
19 Quality inspection process 7 Sec
21 Transportation from inspection process to loading area 58 Sec
21 Loading white body to train 17.6 Sec
22 Transportation to white body warehouse 47.7 Sec
23 Transportation to decoration process 292.3 Sec
24 Loading plate to train 321.8 Sec
25 Unloading plate from the train 207.2 Sec
26 Transportation to decoration area 53 Sec
27 Store in decoration area 28,800 Sec
28 Transportation from decoration area to packaging section 300.3 Sec
29 Prepare packaging cardboard 34 Sec
30 Transportation to finished good warehouse 216 Sec
TOTAL 78,424.91 Sec
Table 5. Nonvalueadded Activity and notnecessary
Non value addedand not Necessary
1 Store londrong in londrongan area 311.2 Sec
2* Store bisque impermanent 75,600 Sec
3 Waiting for inspection process 791.8 Sec
4 Moved to other conveyer 43 Sec
5 unloading & loading white body from train to pallet 1,839.3 Sec
6 Store white body in white body warehouse 2,592,000 Sec
TOTAL 2,670,585.39 Sec
From Table 3-5, the time requires by the product of the material delivered to the warehouse until the product can be stored in the warehouse of finished goods or Process lead time can be calculated as follows : Process Lead Time
PLT = VA + NVA
= 378,521.78+78,424.91+ 2,670,585.39
= 3,127,532.08
Value Process lead time required by the material sent from the warehouse to the product can be stored in the warehouse of finished goods to be sent to the Customer is 3,127,532.08 seconds.
By knowing the value of process lead time it can be calculated ratio value added as follows :
Ratio Value added
RVA =
=
= 12.10 %
Value added ratio shows the percentage of time spent in adding value to a product is a 12:10%.
3.4. Analysis of Current state VSM
To increase the value of the ratio of value added and reduce non-value added
value, it’s necessary improvement actions
by reducing waste that occurs during the production activity. Analysis using value stream mapping are known to occur several waste that result in a waste that should be and can be reduced.
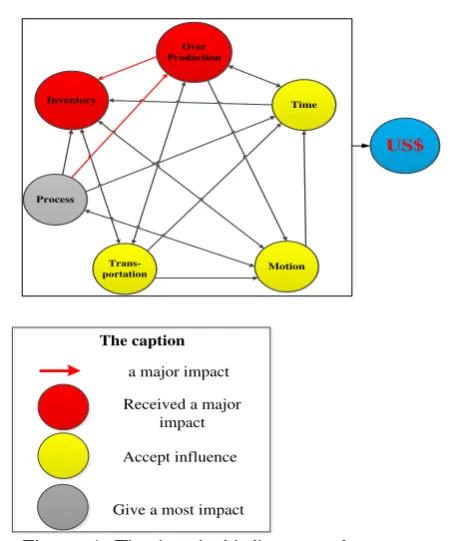
Over
Figure 1. The level of influence of waste to other waste to produce with the maximum capacity. It is done without taking into account the mature waste that would result.
Policies for excess production that result in high levels of inventory, especially in semi-finished goods inventory, it’s shown in Table 6. Waste of Overproduction greatly affect the occurrence of a high level of inventory both in row material inventory and work in process inventory at the product.
The process is not exactly a major impact on the waste of Overproduction where the company produces the whole ability to optimize resources (machines) which resulted in the excess production.
Table 6 the data in and out of the warehouse white body (in pieces)
Date In Out Stored warehouse white body (in pieces)
Date In Out Stored
To reduce the waste that has occurred it is necessary to know the cause of the waste. From the picture 1 it is known that waste of overproduction is affected by inappropriate process that occurs when a process kiln with a lot size that exceeds the actual capacity demand, it’s resulting in unnecessary inventory.
One way to reduce this waste is produced in accordance with customer orders or produce according to the forecasting results. Waste will not be generated until the next process, that influence the level of waste can be deducted as shown below.
Figure 2. Effect of waste to other waste reduction
1. Reduction of waste of overproduction with the value that can be reduced as shown in Table 7
2. Eliminating the intermediate product storage activity (activity 45 in Table 2). Because they are made products to meet all customer needs so that there is no semi-finished products to be stored. Moreover, it can save the cost savings and saves storage space
3. Company automatically eliminate transportation to the warehouse a half finished (activity 43 in table 2) for semi-finished products are not stored. Some processes can be eliminated. Activity eliminated is the activity 43th until 45th in Table 2. From these data the company saving processing time for 2,593,887 seconds.
4. In addition to saving as points 2 and 3, if withdrawn the previous activity then the savings are as follows:
Reducing the frequency of transportation of raw materials warehouse to weigh as 8 times per day
Reducing the use of ball mill machine as many as 135 machines per month 5. On the 25th of activity in the table 2, It
can reduce savings time and reducing the use of pallet.
6. In a material transfer activity between the conveyor (41 activities in Table 2) can be reduced by making improvements layouts that can accommodate the needs of the operator QC
7. The process of unloading and loading (activity 44 in Table 2) can be reduced by replacing the use of lorries with pallet, so that material handling can run smoothly without any handover process and re-calculation
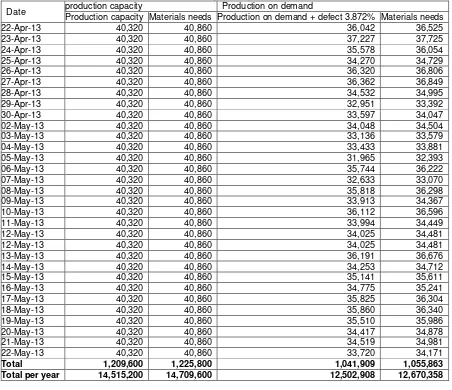
Table 7. Material Requirements appropriate production capacity vs Production on demand (pieces)
Date production capacity Production on demand
Production capacity Materials needs Production on demand + defect 3.872% Materials needs
22-Apr-13 40,320 40,860 36,042 36,525
23-Apr-13 40,320 40,860 37,227 37,725
24-Apr-13 40,320 40,860 35,578 36,054
25-Apr-13 40,320 40,860 34,270 34,729
26-Apr-13 40,320 40,860 36,320 36,806
27-Apr-13 40,320 40,860 36,362 36,849
28-Apr-13 40,320 40,860 34,532 34,995
29-Apr-13 40,320 40,860 32,951 33,392
30-Apr-13 40,320 40,860 33,597 34,047
02-May-13 40,320 40,860 34,048 34,504
03-May-13 40,320 40,860 33,136 33,579
04-May-13 40,320 40,860 33,433 33,881
05-May-13 40,320 40,860 31,965 32,393
06-May-13 40,320 40,860 35,744 36,222
07-May-13 40,320 40,860 32,633 33,070
08-May-13 40,320 40,860 35,818 36,298
09-May-13 40,320 40,860 33,913 34,367
10-May-13 40,320 40,860 36,112 36,596
11-May-13 40,320 40,860 33,994 34,449
12-May-13 40,320 40,860 34,025 34,481
12-May-13 40,320 40,860 34,025 34,481
13-May-13 40,320 40,860 36,191 36,676
14-May-13 40,320 40,860 34,253 34,712
15-May-13 40,320 40,860 35,141 35,611
16-May-13 40,320 40,860 34,775 35,241
17-May-13 40,320 40,860 35,825 36,304
18-May-13 40,320 40,860 35,860 36,340
19-May-13 40,320 40,860 35,510 35,986
20-May-13 40,320 40,860 34,417 34,878
21-May-13 40,320 40,860 34,519 34,981
22-May-13 40,320 40,860 33,720 34,171
Total 1,209,600 1,225,800 1,041,909 1,055,863
After the reduction of the waste, it can be made a map of the future state VSM. So it can be compared to the ratio between the current state and future state.
Process lead time (Current state)
PLT = VA + NVA = 378,521.78+78,424.91 +2,670,585.39
= 3.127,532.08
Ratio value added (Current state) RVA =
=
= 12.10 %
Process lead time (Future state) PLT = VA + NVA
= 533,645.08
Ratio Value added (Future state)
RVA =
=
= 70.93 %
4. CONCLUSION
From the analysis carried out by using value stream mapping waste that occurs is unknown waste processing resulting in waste of overproduction. Waste of overproduction result in unnecessary inventory.
To eliminate waste production activity is carried out at the request of the customer or according to the forecasting results from the production planning.
value added at current state VSM is
12:10%. In the event of elimination / reduction of the waste then the current state value added ratio would increase to to 70.93%.
5. REFERENCES
(a) Gaspersz, V. (2012). Production and Inventory Mamagement Vinchistro Publication
(b) Jay Heizer, B. R. (2007). Operation Management : Student Lecture Guide.
Pearson Prentice Hall.
(c) Liker, J.K and Meier D. (2006). The Toyota Way Fieldbook. US: McGraw-Hill.
Mekong Capital. (2004). Introduction to Lean Manufacturing. Vietnam.
(d) Rother, M dan Shook, J. (2003).