TE
AM
The Six Sigma Project Planner
A Step-by-Step Guide to Leading
a Six Sigma Project Through DMAIC
Thomas Pyzdek
McGraw-Hill
New York Chicago San Francisco Lisbon London Madrid Mexico City Milan New Delhi San Juan
Copyright © 2003 by The McGraw-HIll Companies, Inc. All rights reserved. Manufactured in the United States of America. Except as permitted under the United States Copyright Act of 1976, no part of this publication may be reproduced or distributed in any form or by any means, or stored in a data-base or retrieval system, without the prior written permission of the publisher.
0-07-142555-1
The material in this eBook also appears in the print version of this title: 0-07-141183-6.
All trademarks are trademarks of their respective owners. Rather than put a trademark symbol after every occurrence of a trademarked name, we use names in an editorial fashion only, and to the benefit of the trademark owner, with no intention of infringement of the trademark. Where such designations appear in this book, they have been printed with initial caps.
McGraw-Hill eBooks are available at special quantity discounts to use as premiums and sales pro-motions, or for use in corporate training programs. For more information, please contact George Hoare, Special Sales, at [email protected] or (212) 904-4069.
TERMS OF USE
This is a copyrighted work and The McGraw-Hill Companies, Inc. (“McGraw-Hill”) and its licensors reserve all rights in and to the work. Use of this work is subject to these terms. Except as permitted under the Copyright Act of 1976 and the right to store and retrieve one copy of the work, you may not decompile, disassemble, reverse engineer, reproduce, modify, create derivative works based upon, transmit, distribute, disseminate, sell, publish or sublicense the work or any part of it without McGraw-Hill’s prior consent. You may use the work for your own noncommercial and personal use; any other use of the work is strictly prohibited. Your right to use the work may be terminated if you fail to comply with these terms.
THE WORK IS PROVIDED “AS IS”. McGRAW-HILL AND ITS LICENSORS MAKE NO GUAR-ANTEES OR WARRANTIES AS TO THE ACCURACY, ADEQUACY OR COMPLETENESS OF OR RESULTS TO BE OBTAINED FROM USING THE WORK, INCLUDING ANY INFORMA-TION THAT CAN BE ACCESSED THROUGH THE WORK VIA HYPERLINK OR OTHERWISE, AND EXPRESSLY DISCLAIM ANY WARRANTY, EXPRESS OR IMPLIED, INCLUDING BUT NOT LIMITED TO IMPLIED WARRANTIES OF MERCHANTABILITY OR FITNESS FOR A PARTICULAR PURPOSE. McGraw-Hill and its licensors do not warrant or guarantee that the func-tions contained in the work will meet your requirements or that its operation will be uninterrupted or error free. Neither McGraw-Hill nor its licensors shall be liable to you or anyone else for any inac-curacy, error or omission, regardless of cause, in the work or for any damages resulting therefrom. McGraw-Hill has no responsibility for the content of any information accessed through the work. Under no circumstances shall McGraw-Hill and/or its licensors be liable for any indirect, incidental, special, punitive, consequential or similar damages that result from the use of or inability to use the work, even if any of them has been advised of the possibility of such damages. This limitation of lia-bility shall apply to any claim or cause whatsoever whether such claim or cause arises in contract, tort or otherwise.
Contents
List of Figures vi
List of Tables vii
List of Worksheets vii
Preface xi
Introduction xii
How to Use The Six Sigma Planner xii
1. Planning 1
Develop the Project Charter 1
Project Charter 1
The Project Charter Document 1
Conduct a Feasibility Analysis 5
Is This a Valid Project 5 Feasibility Analysis Study 8
The Project Plan 16
Project Metrics 16
Refining the Dollar Opportunity Estimates 20
How Will I Monitor Satisfaction with Project Success? 22
Identify Human Resources Need to Complete the Project 24 Identify Other Resources Needed to Complete the Project 27
Work Breakdown Structures 29
Creating the WBS 29 Integration and Test 32
Project Schedule Development 32 Activity Definition 35
Activity Dependencies 38 Estimating Activity Duration 40 Gantt Charts 42
Network Diagrams 46
Resource Availability 51
Calendars 51
Schedule Improvement 54
Estimating Project Duration Statistically 60 Calculating the Cost of a Schedule 66
Scope Change Control Plan 90
Change Control System 90
2. Define 95
What Is the Current State? 95
What’s Wrong with the Way Things are Now? 96
Quantify the Undesirable Effects 97 Tools and Techniques 97
Failure Mode and Effect Analysis (FMEA) 100
FMEA Process 100
Process Metrics 106
Other Key Factors and Metrics 110
How Does This Project Move the Organization Toward Its
Strategic Goals and Objectives? 111
3. Measure
Measurement Reliability and Validity 113
Dimension Measurement Analysis 113
Attribute Measurement Analysis 115
4. Analyze 119
Quantify the Current Process 119
Catalog of Data Sources for This Process 119 Exploratory Data Analysis 121
Descriptive Data Analysis 122
Example of Using Worksheet 124
Quantify the Capability of the Current Process 125
Conduct a Process Audit 125
Prepare an Audit Report 129
Determine Sigma and DPMO Levels CTx’s 129 Process Capability and Process Actual Sigma Levels Continuous CTx Characteristics 129
Measuring Process Capability for Variables Data 129
Measuring Actual Process Performance for Variables Data 130
Process Capability and Process Actual Sigma Levels for Attribute CTx Characteristics 131
Measuring Process Capability for Attributes Data 132
Measuring Actual Process Performance for Variables Data 132
5. Improve 139
Optimize the Process 139
What are the Best Practices in This Area? 144 Create a Future State Process Map 150
Six Sigma Project Activities Template 152 Presentation and Acceptance of Deliverables 154
6. Control 157
Control Failure Mode and Effect Analysis (FMEA) 157
Business Process Control Systems 159
How Will We Maintain the Gains Made? 159
7. A Tutorial on Project Selection and Management 165
Choosing the Right Projects 165
Customer Value Projects 166
Using QFD to Link Six Sigma Projects to Strategies 166 The Strategy Deployment Plan 168
Using Customer Demands to Design For Six Sigma 174
Structured Decision-Making 175
Shareholder Value Projects 184 Other Six Sigma Projects 184
Analyzing Project Candidates 184
Other Methods of Identifying Promising Projects 184
Using Pareto Analysis to Identify Six Sigma Candidates 185 Throughput-Based Project Selection 186
Multitasking and Project Scheduling 190
Critical Chain Project Portfolio Management 191
Summary and Preliminary Project Selection 192
Tracking Six Sigma Results 194
Financial Results Validation 196
Types of Savings 196
Lessons Learned: Capture and Replication 196
Appendices 199
Attribute Measurement Error Analysis 210
Normalized Yield and Sigma Level 227
Analytic Hierarchy Process (AHP) Using MS Excel 230
Additional Resources on Six Sigma Project Management 232
Figures
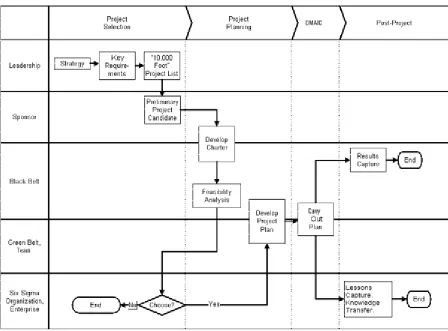
Figure 1. The Six Sigma Project Process Flow xiii
Figure 2. Map of Six Sigma Project Flow xv
Figure 3. Six Sigma Project DMAIC Cycle Questions xvi
Figure 4. Example of Project Validation Analysis 6
Figure 5. Example of Cost-Benefit Opportunity Calculations 20
Figure 6. WBS Creation Process Flowchart 29
Figure 7. Example of a WBS 30
Figure 8. Types of Activity Dependencies 38
Figure 9. Gantt Chart of Schedule 42
Figure 10. Gantt/Milestone Chart of Actual vs. Scheduled Performance 42
Figure 11. Example of Computer Gantt/Milestone Chart 43
Figure 12. Example of Network Diagram 48
Figure 13. Example of a Computer-Generated Network Diagram 49 Figure 14. Example of a Computer-Generated Human
Resource Calendar 52
Figure 15. Computer Screen for Entering Task Duration Data 63
Figure 16. Results of Simulation for Example 64
Figure 17. Simulation Results: Probability of Meeting Due Date 65
Figure 18. Example of Cross-Functional Process Map 95
Figure 19. Define Gate Criteria 112
Figure 20. Measure Gate Criteria 118
Figure 21. Some EDA Techniques 121
Figure 22. Example of Combined DDA and EDA Analysis 122
Figure 23. Example of Evaluating a Hypothesis 124
Figure 24. Analyze Gate Criteria 137
Figure 25. Example of a Future State Process Map 150
Figure 26. Improve Gate Criteria 156
Figure 27. Control Gate Criteria 164
Figure 28. Strategy Deployment Plan 167
Figure 29. Strategy Deployment Matrix 168
Figure 30. QFD Relationship Weights and Symbols 169
Figure 31. Phase II Matrix: Differentiators 171
Figure 32. Phase III Matrix: Six Sigma Projects 173
Figure 33. Linkage Between Six Sigma Projects and Stakeholders 174
Figure 34. Customer Demand Model 178
Figure 35. Matrix of Categories for Pairwise Comparisons 180
Figure 36. Completed Top-Level Comparison Matrix 181
Figure 39. Lithography Inspection Station Table, Stool,
and Magnifying Glass 215
Figure 40. Attribute Gauge R&R Dialog Box and Data Layout 219
Figure 41. MINITAB “Agreement Within Appraiser” 220
Figure 42. Plot of “Agreement Within Appraiser” 220
Figure 43. MINITAB “Agreement of Appraiser with Standard” 221 Figure 44. Plot of “Agreement of Appraiser with Standard” 221
Figure 45. MINITAB “Appraiser Disagreement” 222
Figure 46. MINITAB “Agreement Between Appraisers” 222
Figure 47. MINITAB “Assessment vs. Standard Agreement
Across All Appraisers” 223
Figure 48. Excel Spreadsheet for RTY 225
Figure 49. Excel Spreadsheet for Calculating Normalized Yield 227
Figure 50. Finding RTY Using Simulation Software 229
Tables
Table 1. Instructions for Completing the Project Charter
Statement Form 4
Table 2. Strategies for Meeting the Project Goals 24
Table 3. Tools Useful in Risk Assessment 75
Table 4. Risk Planning vs. Impact and Likelihood of
Threatening Events 75
Table 5. Risk Response Planning Tools 78
Table 6. FMEA Severity, Likelihood, Detectibility Rating Guidelines 102
Table 7. FMEA Information 104
Table 8. Phases in Process Optimization 141
Table 9. Typical DMAIC Project Tasks and Responsibilities 152
Table 10. Local and Global Importance Weights 182
Table 11. Example of Using Global Weights in Assessing Alternatives 183 Table 12. Dysfunctional Process Symptoms and Underlying Diseases 185 Table 13. Illustration of the Pareto Priority Index (PPI) 186 Table 14. Throughput Priority of CTx Projects That Affect
the Constraint 189
Table 15. Project Throughput Priority vs. Project Focus 189
Table 16. Possible Information to Be Captured 195
Table 17. A Typical View of Six Sigma Projects 195
Table 18. Attribute Measurement Concepts 210
Table 19. Methods of Evaluating Attribute Inspection 213
Table 20. Results of Lithography Attribute Inspection Study 215
Table 21. Inspector Accuracies 216
Table 22. Repeatability and Pairwise Reproducibility for
Both Days Combined 216
Table 23. Stability Analysis 217
Worksheets
Worksheet 1. Project Charter Statement 2
Worksheet 2. Project Validation Analysis 7
Worksheet 3. Six Sigma Project Evaluation 9
Worksheet 4. Six Sigma Project Evaluation Guidelines 10
Worksheet 5. Project Budget Development 17
Worksheet 6. Deliverables Metrics 19
Worksheet 7. Dollar Opportunity Estimate 21
Worksheet 8. Project Progress Satisfaction Metrics 23
Worksheet 9. Human Resources Assessment 26
Worksheet 10. Project Resource Planning 28
Worksheet 11. Project Work Breakdown Structure 31
Worksheet 12. List of Penalties for Missing Deadline 33
Worksheet 13. Major Milestones and Target Dates 34
Worksheet 14. Historical Research Summary 36
Worksheet 15. Constraint Analysis 37
Worksheet 16. Activity Dependenciesa 39
Worksheet 17. Activity Duration Estimates 41
Worksheet 18. List of Activities 44
Worksheet 19. Project Gantt/Milestone Chart Template 45
Worksheet 20. Project Gantt/Milestone Chart
(Freehand Drawing Format) 46
Worksheet 21. Network Diagram for Project 50
Worksheet 22. Resource Availability Information 53
Worksheet 23. Schedule Improvement Evaluation 55
Worksheet 24. Best-Case, Expected, and Worst-Case
Schedule Completion Dates 59
Worksheet 25. Statistical Analysis of Project Duration 62
Worksheet 26. Estimated Cost by Activity Duration 67
Worksheet 27. Cost-Optimization Spreadsheet Results 68
Worksheet 28. Cost-Optimization Graphical Analysis 69
Worksheet 29. Resource Leveling 71
Worksheet 30. Risk Event Classification 76
Worksheet 31. New Opportunities 77
Worksheet 32. Risk Response Plans 79
Worksheet 33. Quality Plan Items 82
Worksheet 34. Project Budget Reports and Reporting Frequency 86
Worksheet 35. Activity Status Management Report 89
Worksheet 36. Change Control Information 90
Worksheet 37. Controlled Documents List 90
Worksheet 38. Current Process Map 96
Worksheet 41. FMEA Worksheet 105
Worksheet 42. CTQ Characteristics 108
Worksheet 43. CTS and CTC Characteristics 109
Worksheet 44. Other Key Factors and Metrics 110
Worksheet 45. Linkages to Enterprise Strategic Goals 111
Worksheet 46. Gauge R&R Results 114
Worksheet 47. Attribute Inspection System Results 116
Worksheet 48. Attribute Inspection Results by Inspector 117
Worksheet 49. Information Resource Catalog 120
Worksheet 50. DDA/EDA-Based Theories to Investigate Further 123
Worksheet 51. Process Audit Check Sheet 126
Worksheet 52. Actual CTx DPMO and Sigma Levels 134
Worksheet 53. Capability Levels of Performance 135
Worksheet 54. Rolled Throughput Yield Analysis 136
Worksheet 55. Optimum Levels of Performance 142
Worksheet 56. Optimum Rolled Throughput Yields 143
Worksheet 57. Benchmarking Step 1: Identify What Is
to Be Benchmarked 144
Worksheet 58. Benchmarking Step 2: Identify
Comparative Companies 145
Worksheet 59. Benchmarking Step 3: Determine Data
Collection Methods 146
Worksheet 60. Benchmarking Step 4: Collect Data on Benchmark 147 Worksheet 61. Benchmarking Step 5: Determine the
Current Performance Gap 148
Worksheet 62. Benchmarking Step 6: Identify Causes of
the Performance Gap 148
Worksheet 63. Benchmarking Step 7: Estimate Future
Performance Levels 149
Worksheet 64. Benchmarking Step 8: Establish Functional
Goals and Gain Acceptance of Stakeholders 149
Worksheet 65. Alternative Future State Process Maps 151
Worksheet 66. Future State Improvement Estimates 151
Worksheet 67. Deliverables Acceptance Report 155
Worksheet 68. Control FMEA Worksheet 158
Worksheet 69. Additional Business Process Change
Control Mechanisms 162
Worksheet 70. Project Assessment Summary 194
Worksheet 71. Issues List 200
This page intentionally left blank.
TE
AM
xi
Preface
My goals for The Six Sigma Project Planner are:
• Help the user identify worthy projects and move them steadily to successful
completion.
• Help the user identify poorly conceived projects before devoting any time or
resources to them.
• Help the user identify stalled projects and provide them with the attention they
need to move forward again.
• Help the user decide when it’s time to pull the plug on dead projects before
they consume too much time and resources.
• Provide a record for the user that helps improve the project selection,
management, and results tracking process.
Notice that I use the word “user,” not “reader.” The Planner isn’t a textbook to be read; it is a working guide. Too often we read books or sit in classrooms and passively absorb the material. But a huge chasm exists between understanding the material intellectually and knowing how to use it to achieve results. Think of the Planner as a bridge over that chasm.
In the classroom the instructor says, “You must carefully evaluate a project proposal before deciding to pursue the project.” Upon hearing this, your likely response would be to think, “Of course. That’s obvious.” However, you may not actually translate this thought into action when the proper time comes.
If you use the Planner properly, you’ll be guided through a rigorous feasibility analysis (Figure 3, p. xvi) where you will assign a numerical rating to the project’s sponsorship, benefits, timetable, resource availability, and much more. The proposed project will be assigned an overall score that can be used to compare it with other projects. You might choose to have the project evaluated by others on the team, providing a basis for discussion and consensus-building. In the end, you will make an informed decision. That decision may well be to pursue another project, thereby avoiding a false start and a waste of your time. If the decision is to go ahead with the project, it will be because the chances for success are excellent.
In other words, the Planner is about getting results rather than merely learning for the sake of knowledge acquisition. It’s about using what you learned in your Black Belt or Green Belt training. The Planner provides brief overviews of some topics, but for the most part it is assumed that you have received training in the tools and
Introduction
One day, several years ago, I received a call from a colleague who was organizing a conference on quality improvement in the healthcare industry. He asked if I could help him find a speaker who had successfully completed an improvement project involving healthcare processes. I had just begun consulting for an integrated healthcare organization that had been pursuing TQM for a number of months, so I called the Manager of Continuous Improvement and asked her. “No problem,” she said. “We have over 50 projects in the works, and some have been underway for several months. I’m sure that we can find one to showcase at the conference.”
She was wrong. Not a single project had produced tangible results. The organization had top-level commitment, the resources had been allocated and spent, people had been trained, teams were in place and empowered, but nothing had come from all of the effort. Research has shown that this situation is not uncommon with TQM deployments. Is it any wonder that TQM fell out of favor with the business community?
Six Sigma is different. It demands results. These results are delivered by projects that are tightly linked to customer demands and enterprise strategy. The Six Sigma Project Planner is designed to help the serious Six Sigma organization choose and complete projects that pay off. The Planner is designed specifically for use with Six Sigma projects. It integrates the project management body of knowledge as defined by the Project Management Institute and the Define-Measure-Analyze-Improve-Control (DMAIC) Six Sigma format for process improvement projects. It combines project management and business process improvement in a way that greatly improves the chances for success.
How to Use
The Six Sigma Project Planner
TheSix Sigma Project Planner is designed to implement the Project Planning and DMAIC phases of the process shown in Figure 1. It also addresses some issues encountered in the post-project phase. The assumption is that the enterprise has completed the project selection phase and that Six Sigma Green Belts and Black Belts are choosing their projects from a portfolio of project candidates approved by Senior Leadership.1
The Planner is not a textbook on Six Sigma tools and techniques. It is assumed that the user of the Planner has been through the appropriate training class for his or her role in the project. For example, the project Black Belt will have
received training as a Black Belt and knows what is meant when the Planner tells him or her to perform a gauge R&R study. For the trained individual, the Planner
provides direction on when a particular Six Sigma tool or technique should be employed, assuming that the project team includes personnel who understand the tools. It also provides numerous worksheets and summary pages to implement the tools effectively.
1
Figure 1. The Six Sigma Project Process Flow
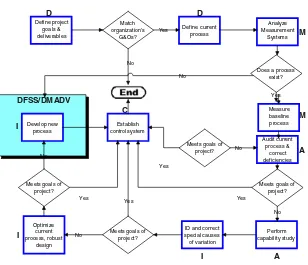
The Planner is designed to guide the project along a path that will lead to meeting the project’s goals with minimum expenditure of effort and resources. There are several checkpoints built into the Planner where the project may be terminated successfully without completing the entire Planner or DMAIC cycle. The logical process flow is as follows:
1. Define the project’s goals and deliverables.
a. If these are not related to the organization’s strategic goals and objectives, stop. The project is not a Six Sigma project. This does not necessarily mean that it isn’t a “good” project or that the project shouldn’t be done. There are many worthwhile and important projects that are not Six Sigma projects. 2. Define the current process.
3. Analyze the measurement systems.
4. Measure the current process and analyze the data using exploratory and descriptive statistical methods.
5. Audit the current process and correct any deficiencies found.
a. If the corrected process meets the goals of the project, establish control systems and stop, else …
6. Perform a process capability study using SPC. a. Identify and correct special causes of variation.
b. If the controlled process meets the goals of the project, establish control systems and stop, else …
7. Optimize the current process by applying statistically designed experiments. a. If the optimized process meets the goals of the project, establish control
systems and stop, else …
8. Employ breakthrough strategy to develop and implement an entirely new process that meets the project’s goals.
9. Establish control and continuous improvement systems and stop.
Figure 2. Map of Six Sigma Project Flow2
It will often happen that there are unresolved issues relating to one or more items in a particular worksheet. At the bottom of many worksheets you will find a box where you can assign a number for the issue. The Appendix provides an Issues List (p. 200) where you can describe issues in greater detail, as well as provide information on the issue resolution plan.
Some projects don’t require all of the detail in the Planner. The documentation
required for all projects is called the official project plan. Those sections of the Planner that are part of the official project plan are identified with a superscript asterisk (*
) and a footnote. These materials, at a minimum, should be included for all projects. The Planner is designed to provide complete documentation for any Six Sigma project. The worksheets in the Planner can be photocopied and placed in a three-ring binder after completion. The completed project document provides a ready reference for others pursuing similar projects. A library of such documents provides a wealth of information about how to conduct successful projects in the organization.
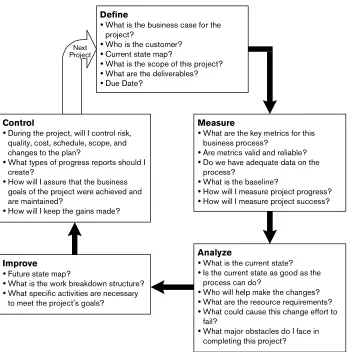
Figure 3. Six Sigma Project DMAIC Cycle Questions
Define
What is the business case for the project?
Who is the customer?
Current state map?
What is the scope of this project?
What are the deliverables?
Due Date?
Measure
What are the key metrics for this business process?
Are metrics valid and reliable?
Do we have adequate data on the process?
What is the baseline?
How will I measure project progress?
How will I measure project success?
Control
During the project, will I control risk, quality, cost, schedule, scope, and changes to the plan?
What types of progress reports should I create?
How will I assure that the business goals of the project were achieved and are maintained?
How will I keep the gains made?
Analyze
What is the current state?
Is the current state as good as the process can do?
Who will help make the changes?
What are the resource requirements?
What could cause this change effort to fail?
What major obstacles do I face in completing this project?
Improve
Future state map?
What is the work breakdown structure?
What specific activities are necessary to meet the project's goals?
1
Chapter 1
Planning
Develop the Project Charter
Project Charter
*Project charters (sometimes called project scope statements) should be prepared for each project and subproject. The project charter includes the project justification, the major deliverables, and the project objectives. It forms the basis of future project decisions, including the decision of when the project or subproject is complete. The project charter is used to communicate with stakeholders and to allow scope management as the project moves forward.
The Project Charter Document
The project charter is a written document issued by the project sponsor. The project charter gives the project team authority to use organizational resources for project activities. Use Worksheet 1 to document the charter for this project. Instructions for completing the Project Charter Statement follow the form.
*
Worksheet 1. Project Charter Statement
Project Name/Number
Sponsoring Organization
Project Sponsor Name: Phone:
Office Location: Mail Stop:
Project Black Belt Name: Phone:
Office Location: Mail Stop:
Project Green Belt Name: Phone:
Office Location: Mail Stop:
Team Members (Name) Title / Role Phone Office Location Mail Stop
Principal Stakeholders Title / Role Phone Office Location Mail Stop
Date Chartered:
Project Start Date:
Target Completion Date:
Revision: N/C Number: 0 Date:
Project Name/Number: Project Mission Statement
Problem Statement
Project Scope
Business Need Addressed by This Project
Product or Service Created by This Project (Deliverables)
Table 1. Instructions for Completing the Project Charter Statement Form
Field Contents
Project Name/Number
Enter a short title for the project. If your organization has a project numbering system, include the assigned number. Sponsoring
Organization
Enter the name of the lowest-level organization that includes all processes changed by the project. This organizational unit must agree to sponsor the project.
Project Sponsor The sponsor should be the process owner
or line management at a level that can allocate resources for the project.
Project Black Belt Enter the name and contact information of
the Six Sigma Black Belt assigned to this project. If the project is being worked by a team of Black Belts, enter the name of the lead Black Belt responsible for the project.
Project Green Belt Enter the name and contact information of
the Green Belt project leader whose area is most directly impacted by the project.
Team Members Enter the names and contact information of
the core team members. Principal
Stakeholders
Enter the names and contact information of the people, other than the sponsor, who have a direct interest in the outcome of the project. E.g., customer, supplier, functional area manager, supervisor, responsible engineering authority, union leaders, etc.
Date Chartered Enter the date that the charter was
accepted and signed by the sponsor.
Project Start Date Enter the date that the project is scheduled
to begin. Update when the actual start date is known.
Target Completion Date
Enter the date when the project’s
deliverables are expected to be completed.
Revision Charter revision tracking information.
Sponsor Approval Signature
Obtain the signature of the sponsor. Before signing, the sponsor should enter all project-related meetings into his or her schedule.
TE
AM
Project Name/Number
Since the charter is a two-page document, the project’s ID information is repeated.
Project Mission Statement
State in clear and concise terms what this project will accomplish for the organization or its customers. Do not begin until every member of the project team and the sponsor are in agreement with the mission.
Problem Statement Describe the “burning platform” for this
project. Why is this project necessary?
Project Scope Define the boundaries for this project. What
will be addressed? What will not be addressed?
Business Need Addressed by This Project
Why should the problems described in the problem statement be solved? How will the business or its customers benefit from this project? How will this project improve quality, cycle time, costs, customer satisfaction, or competitiveness? Product or Service
Created by This Project (Deliverables)
Specifically, what will be created by this project? E.g., increased sales, reduced warranty expense, lower costs, shorter cycle time, etc.
Resources
Authorized for This Project
List significant resources that must be made available and those that will be consumed to support this project. Examples: raw materials, machine time, overtime pay, operations personnel, etc.
Conduct a Feasibility Analysis
Is This a Valid Project?
Before launching a significant effort to solve a business problem, be sure that it is the correct problem and not just a symptom. Is the “defect” you are trying to eliminate something the customer cares about or even notices? Is the design requirement really essential, or can
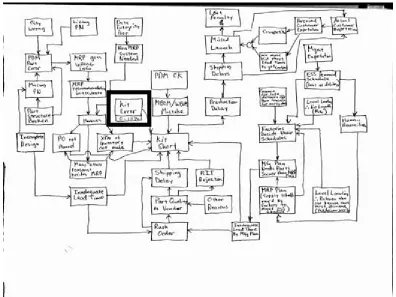
Figure 4. Example of Project Validation Analysis
Note: In this real-life example, the originally proposed Six Sigma project is indicated in
the box labeled “Kit Error,” which is enclosed in a bold box in Figure 4. The true problem was that kits were arriving at the assembly process with parts missing,1
shown in the box labeled “Kit Short.” This project validation analysis indicated that kitting errors accounted for only a small percentage of the kits that arrived at the assembly process incomplete or incorrect. Several Six Sigma projects must be initiated to deal with the root causes of this problem.
Feasibility Analysis Summary
So, Mr. or Ms. Black Belt, you have a valid project, one that addresses the causes of an important effect. But should you pursue it? Before you begin actual project planning, you should take some time to assess the probability that the project will succeed. Assessing Six Sigma projects is an art as well as a science. It is also critical to the success of Six Sigma and to the individual Black Belt. Far too many Black Belts fail because they are not discriminating enough in selecting projects. If project selection is systematically sloppy, the entire Six Sigma effort can fail.
Feasibility analysis is a combination of quantitative and qualitative analysis. It is
quantitative in that numerical ratings are used and an overall project score is calculated. It is qualitative and subjective to a degree, because it requires interpretation of the situation and estimating probabilities, costs, commitments, etc. However, the rigor that goes with completing the assessment process will help you make better judgments regarding projects.
The numbers (weights, scores, acceptable length of projects, dollar cutoffs, etc.) are based on my own personal judgments from my experience and discussions with
consulting clients. While I believe that they are valid, you should feel free to assign your own values or those of your leadership. The scale for each criterion ranges from 0 to 9 and the weights sum to 1.00, so the highest possible weighted score for a project is 9. By dividing your scores by 9 and multiplying by 100, you can convert them into
Worksheet 2. Six Sigma Project Evaluation
Project Name: Project Number:
Black Belt: Master Black Belt:
Overall Project Weighted Score: Date of Assessment:
Criterion Score Weight Weighted
Score2
1. Sponsorship 0.23
2. Benefits (specify main beneficiary)
2.1 External Customer:
2.2 Shareholder:
2.3 Employee or Internal Customer:
2.4 Other (e.g., supplier, environment):
Overall Benefit Score
0.19
3. Availability of resources other than team 0.16
4. Scope in terms of Black Belt effort 0.12
Note: Any criterion scores of zero must be addressed before project is approved.
2
Worksheet 3. Six Sigma Project Evaluation Guidelines Sponsorship
Score Interpretation
9 Director-level sponsor identified, duties specified, and sufficient
time committed and scheduled in advance
3 Director-level sponsor identified, duties specified, and sufficient
time committed but not scheduled
1 Willing director-level sponsor who has accepted charter
statement
0 Director-level sponsor not identified or sponsor has not accepted
the charter
2.0 Stakeholder Benefits3
“Tangible and verifiable benefits for a major stakeholder”
2.1 Stakeholder: External Customer
2.1.1 Customer Satisfaction
Score Interpretation
9 Substantial and statistically significant increase in overall
customer satisfaction or loyalty
3 Substantial and statistically significant increase in a major
subcategory of customer satisfaction
1 Substantial and statistically significant increase in a focused area
of customer satisfaction
0 Unclear or no customer satisfaction impact
2.1.2 Quality Improvement (CTQ 4)
Score Interpretation
9 10x or greater improvement in CTQ metric
5 5x to 10x improvement in CTQ metric
3 2x to 5x improvement in CTQ metric
1 Statistically significant improvement in CTQ metric, but less than
2x magnitude
0 Project’s impact on CTQ metrics undefined or unclear
2.2 Stakeholder: Shareholder
2.2.1 Financial Benefits
Score Interpretation
9 Hard net savings (budget or bid model change) greater than
$500K. Excellent ROI.5
5 Hard net savings between $150K and $500K. Excellent ROI.
3 Hard net savings between $50K and $150K or cost avoidance
greater than $500K. Good ROI.
1 Hard savings of at least $50K or cost avoidance between $150K
and $500K. Acceptable ROI.
0 Project claims a financial benefit but has hard savings less than
$50K, cost avoidance less than $150K, or unclear financial benefit.
2.2.2 Cycle Time Reduction
Score Interpretation
9 Cycle time reduction that improves revenue, bid model, or budget
by more than $500K. Excellent ROI.
5 Cycle time reduction that improves revenue, bid model, or budget
by $150K to $500K. Excellent ROI.
3 Cycle time reduction that improves revenue, bid model, or budget
by $50K to $150K or creates a cost avoidance of more than $500K. Good ROI.
1 Cycle time reduction that results in cost avoidance between
$150K and $500K. Acceptable ROI.
4
Critical to quality.
5
0 Project claims a cycle time improvement but has hard savings less than $50K, cost avoidance less than $150K, or unclear financial benefit from the improvement in cycle time.
2.2.3 Revenue Enhancement
Score Interpretation
9 Significant increase in revenues, excellent ROI.
3 Moderate increase in revenues, good ROI.
1 Measurable increase in revenues, acceptable ROI.
0 Unclear or no revenue impact.
2.3 Stakeholder: Employee or Internal Customer
2.3.1 Employee Satisfaction
Score Interpretation
9 Substantial and statistically significant increase in overall
employee satisfaction.
3 Substantial and statistically significant increase in a major element
of employee satisfaction.
1 Substantial and statistically significant increase in a focused area
of employee satisfaction.
0 Unclear or no employee satisfaction impact.
2.4 Stakeholder: Other
2.4.1 Specify Stakeholder:
Benefits
Score Interpretation
9
Score Interpretation
3
1
0 Unclear or no benefit
3.0 Availability of Resources Other than Team
Score Interpretation
9 Needed resources available when needed.
3 Limited or low priority access to needed resources.
1 Questionable resource availability.
0 Resources not available or excessive restrictions on access to
resources.
4.0 Scope in Terms of Black Belt Effort
Score Interpretation
9 Projected return substantially exceeds required return.
3 Projected return exceeds required return.
1 Projected return approximately equals required return.
0 Projected return not commensurate with required return.
Required return can be calculated as follows:6
(1) Length of project (months) =
(2) Proportion of Black Belt’s time required (between 0 and 1) =
(3) Probability of success (between 0 and 1) =
6
Required7
return = $83,333 x (1) x (2) ÷ (3) = $
Projected return: $
5.0 Deliverable
Score Interpretation
9 New or improved process or product or service to be created is
clearly and completely defined.
3 New or improved process or product or service to be created is
defined.
0 Deliverable is poorly or incorrectly defined—for example, a
deliverable that is really a tool, such as a process map.
6.0 Time to Complete
Score Interpretation
9 Results realized in less than three months.
3 Results realized in three to six months.
1 Results realized in seven to 12 months.
0 Results will take more than 12 months to be realized.
7.0 Team Membership
Score Interpretation
9 Correct team members recruited and time commitments
scheduled.
3 Correct team members recruited, time committed but not
scheduled.
1 Correct team members recruited.
0 Team members not recruited or not available.
TE
AM
8.0 Project Charter
Score Interpretation
9 All elements of the project charter are complete and acceptable.
Linkage between project and deliverable is clear.
3 Project charter acceptable with minor modifications.
0 Project charter requires major revisions.
9.0 Value of Six Sigma Approach (DMAIC or Equivalent)
Score Interpretation
9 Six Sigma approach essential to the success of the project. Black
Belt/Green Belt skill set required for success.
3 Six Sigma approach helpful but not essential. Black Belt/Green
Belt skill set can be applied.
0 Usefulness of Six Sigma approach not apparent. Specific Black
The Project Plan
Project Metrics
At this point you know who the project’s customers are and what they expect in the way of project deliverables. Now you must determine precisely how you will measure progress toward achieving the project’s goals.
What Is the Total Budget for This Project?
Worksheet 5. Project Budget Development
Budget Item Estimated
Expenditure Range Charge Account # Authorization
Team Meetings
Team Member Time
Contract Work
How Will I Measure Project Success?
You should have one or more metrics for each project deliverable.
• Metrics should be selected to keep the project focused on its goals and objectives.
• Metrics should detect project slippage soon enough to allow corrective action to avert damage.
Worksheet 6. Deliverables Metrics
Deliverable Validation Metrics Frequency of
Refining the Dollar Opportunity Estimates
Preliminary estimates of benefits were made previously during the initial
planning. However, the data obtained by the team will allow the initial estimates to be made more precisely at this time.
Whenever possible, “characteristics” should be expressed in the language of management: dollars. One needn’t strive for to-the-penny accuracy; a rough figure is usually sufficient. It is recommended that the finance and accounting department develop dollar estimates; however, in any case it is important that the estimates at least be accepted (in writing) by the accounting and finance department as reasonable. This number can be used to compute a return on investment (ROI) for the project.
As a general rule, dollar estimates are made conservatively. That is, they do not consider the dollar value of intangibles such as improved employee morale or customer satisfaction. The approach is usually to consider the cost of the current process and to compare it with the cost of operating the improved process. A recommended approach is to calculate the cost of a single error or problem, estimate the total number of errors or problems, and multiply to arrive at the dollar size of the opportunity. This is compared with the project’s cost and time to determine the ROI.
Example #1: Cost of Incomplete or Inaccurate Customer Data
The Six Sigma project involved improving the quality of data in a customer database at a call center. Whenever a customer phones in, the representative looks for the customer’s record in the database and verifies the information it contains. Based on a sample, it is estimated that about 11% of the records in the database are incorrect and require attention by the representative. Considering only direct costs (labor), the estimated opportunity is calculated as follows:
Figure 5. Example of Cost-Benefit Opportunity Calculations
Number of calls/year 1,300,000.
Average time to correct database 30 seconds (0.5 minutes)
Cost per minute $1.75.
Size of opportunity $1.75 x 0.5 x 1,300,000 x 0.11 = $125,125.
Estimated cost of project $25,000. No additional operating expense is
expected.
Estimated improvement Reduce errors by 90%, to 1.1% incorrect
records.
Savings $125,125.00 – $12,512.50 =
$112,612.50.
Time to complete 4 months.
First-year ROI 3 x ($112,612.50 / $25,000) x 100 =
Worksheet 7. Dollar Opportunity Estimate
Error or
Problem Cost Now
Cost After
Improvement Savings
Accounting Concurrence
TOTAL
Project ROI
How Will I Monitor Satisfaction with Project Progress?
Six Sigma projects have a significant impact on people while they are being conducted. It is important that the perspectives of all interested parties be periodically monitored to ensure that the project is meeting their expectations and not becoming too disruptive. The Black Belt should develop a means for obtaining this information, analyzing it, and taking action when the results indicate a need. Data collection should be formal and documented. Relying on “gut feeling” is not enough.
Means of monitoring8: • Personal interviews • Focus groups • Surveys • Meetings • Comment cards • Other:
Worksheet 8. Project Progress Satisfaction Metrics
Stakeholder
Group Metric
Means of
Monitoring Frequency Responsibility
Customers
Sponsors
Process area personnel Team members
Identify Human Resources Needed to Complete the Project
****We can now identify our basic strategy for achieving the project goals, as summarized in Table 2.
Table 2. Strategies for Meeting the Project Goals
Situation Action Indicated Project Strategy
The process can meet the project goals if it is operated properly.
No additional action is necessary, other than ensuring that the process is properly maintained and operated according to established procedures.
Discipline Strategy:
Establish systems to ensure proper maintenance, documentation, employee training, process monitoring, and process control.
The process can meet the project goals, but it is not doing so due to special causes of variation.
Identify and eliminate special causes of variation in the process.
Control Strategy:
Provide SPC training to operating personnel, establish action plans to respond to out-of-control indications, develop
improvement plans to identify and eliminate special causes of variation.
The process can meet the project goals if we implement the changes needed to optimize its performance.
Operate the process at the settings indicated by DOE findings.
Optimization Strategy:
Prepare plans to implement optimal system and process settings as determined by the DOE.
Even if it were operated at optimum, the process cannot meet the project goals. Breakthrough to
unprecedented performance levels is required to meet the project goals.
New process design is required.
Breakthrough Strategy:
Develop entirely new systems designed to meet the project goals.
Utilize the results of the benchmarking activity.
With the appropriate strategy determined, it is time to re-evaluate project team
membership. Review Worksheet 1 (p. 2) to determine if the team as currently composed includes the knowledge, skills, abilities, and personal attributes (KSAP) needed to successfully implement the project strategy.
TE
AM
Guidelines for Evaluating Team Member Candidates
• Do they possess a needed KSAP or certification? • Are they willing to work on this project?
• Do they have sufficient time to work on this project?
– Obtain resource calendars for planning and scheduling purposes • Will their supervisor allow their involvement?
• What is their role?
Identify Other Resources Needed to Complete the Project
*Examples of things to consider:
• Resource calendars for planning and scheduling • Machinery needed
• Process time • Materials
• Tool and die work • Engineering prototypes • Laboratory tests
• Gauges
• Measurement equipment
• Floor space, office space, and other facility requirements • Furniture
• Plumbing, electrical wiring, etc.
• Ventilation and other environmental requirements • Special storage requirements
• Clean rooms • Safety equipment
• Forklifts, trucks, and other transportation • Enterprise or legacy data access
• Special computer requirements (e.g., workstations, mainframes) • Special software requirements (e.g., simulation software, CAD) • Where will the resources come from?
• Whose permission do I need to obtain these resources? • Special requirements (e.g., certification, safety issues)
*
Worksheet 10. Project Resource Planning
Work Breakdown Structures (WBS)
The creation of work breakdown structures involves a process for defining the final and intermediate products of a project and their interrelationships. Defining project
activities is complex. It is accomplished by performing a series of decompositions, followed by a series of aggregations. For example, a software project to develop an SPC software application would disaggregate the customer requirements into very specific engineering requirements. The customer requirement that the product create x-bar charts would be decomposed into engineering requirements such as subroutines for computing subgroup means and ranges, plotting data points, drawing lines, etc. Reaggregation would involve, for example, linking the various modules to produce an x-bar chart and display it on the screen.
Creating the WBS
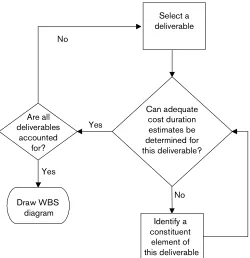
The project deliverables expected by the project’s sponsors were initially defined in the project charter (p. 2). Deliverables metrics are given in Worksheet 6, Deliverables Metrics (p. 19). For most Six Sigma projects, major project deliverables are so complex as to be unmanageable. Unless they are broken into components, it isn’t possible to obtain accurate cost and duration estimates for each deliverable. WBS creation is the process of identifying manageable components or subproducts for each major deliverable. The process is pictured in Figure 6.
Figure 6. WBS Creation Process Flowchart
Figure 7. Example of a WBS
For simplicity, not all branches of the WBS are shown in Figure 7. The only branch fully developed is that of complex boards for the problem labeled “no solder in hole.” On real projects, upper-level WBS often connect to “off-page connectors,” which are circles with a letter or number reference to a lower-level WBS chart. The WBS process
continues down to the level where the team feels it can clearly budget, schedule, and assign activities. Problems defined to this level are sometimes referred to as “tiny.” The basic idea is to divide and conquer larger issues by reducing them to simple mini-projects. In this example, the WBS was terminated when a particular type of solder problem could be assigned to a team that includes a design engineer and a process engineer.
You may have noticed a resemblance between the WBS diagram and an organization chart. In fact, the idea behind the WBS is the same as the idea behind a formal
organization: division of work. The work performed by an organization is generally too complex to be done by a single functional unit, so it is divided according to a logical scheme. The same is true for the WBS. You may wish to take advantage of this basic similarity to create the WBS. For example, MicrosoftWord includes an organizational chart tool that can be adapted for creating the WBS diagram.
Wave Solder Improvement Project
No solder in hole Pad Lifts Reduce top 3 defect types Establish SPC
Reduce Solder DPMO from 5000 to 50
Integration and Test
*Unless careful planning is done, the whole may be considerably less than the sum of its parts! Although the WBS makes it possible to tackle one big project by treating it as a collection of small subprojects, it does so by a process known as disintegration. At some point the subprojects (or subproducts or subprocesses) must be reintegrated and the whole system tested as a unit.
Inputs
The basis of the integration and test plan is the Integration Plan, the list of project deliverables (see Worksheet 6. Deliverable Metrics, p. 19), and the WBS. Together, these documents tell you what the project deliverables are, how they were decomposed, and how the project’s sponsor will judge the project’s success.
Integration Plan
“How will the complete system be tested and validated?”
Project Schedule Development
11Project Deadline
• What is the latest completion date that allows the project to meet its objective?
Project Deadline (get from project charter, p. 2)
• What are the penalties for missing this date? Things to consider are lost market share, contract penalties, fines, lost revenues, etc.
*
Part of the official project plan.
Worksheet 12. List of Penalties for Missing Deadline
Worksheet 13. Major Milestones and Target Dates
Milestone Target
Date
TE
AM
Project schedules are developed to ensure that all activities are completed, reintegrated, and tested on or before the project due date. A number of tools and techniques that help create, analyze, and manage project schedules will be discussed next. Software can be used to automate the calculations involved and to make it easier to identify scheduling conflicts and resource shortages. The output of the scheduling activity is a time chart (schedule) showing the start and finish times for each activity as well as its relationship to other activities in the project and responsibility for completing the activity. The schedule must identify activities that are critical in the sense that they must be completed on time to keep the project on schedule.
Don’t accept the initial project schedule as a given. The information obtained in
preparing the schedule can be used to improve it. Activities that the analysis indicates to be critical are prime candidates for improvement. Pareto analysis12
can be used to identify those critical elements that are most likely to lead to significant improvement in overall project completion time. Cost data can be used to supplement the time data and the combined time/cost information can be analyzed using Pareto analysis. Always keep in mind that the project’s deadline is a worst acceptable date, not the most desirable.
Activity Definition
Once the WBS is complete, it can be used to prepare a list of the activities (tasks) necessary to complete the project. Activities don’t simply complete themselves. The resources, time, and personnel necessary to complete the activities must be determined. We now have the information we need to complete this portion of the project plan.
Activity Definition Inputs
To complete this portion of the project planner, you will need to refer to the WBS (p. 31) and the project charter (p. 2). Additional research will also be required to determine if similar projects or subprojects were conducted previously and, if so, what historical information for activity definitions, activity durations, and problems encountered should be reviewed. Document the findings using Worksheet 14. Historical Research Summary. If available, activity lists from similar projects should be obtained to use as templates. These can be placed into the Planner as supporting detail.
12
Worksheet 14. Historical Research Summary
Constraints—factors that limit the team’s options—also need to be identified. Use Worksheet 15 to list the constraints and the plans for dealing with them.
Worksheet 15. Constraint Analysis
Constraint Effect of Constraint Planned Response to Constraint
A common problem to guard against is scope creep. As activities are developed, be certain that they do not go beyond the project’s original scope. Equally common is the problem of scope drift. In these cases, the project focus gradually moves away from its original charter. Since the activities are the project, this is a good place to carefully review the scope statement in the project charter (p. 2) to ensure that the project remains focused on its goals and objectives.
Activity Dependencies
Some project activities depend on others: sometimes a given activity may not begin until another activity is complete. For example, if the project involves building a house, the construction of the floor cannot begin until the foundation has been poured and had time to cure properly. Other activities can be done in parallel, simultaneously. The outside of the house can be painted while the drywall is being installed inside or while the roof shingles are being installed. The project plan and schedule must take these dependencies into account.
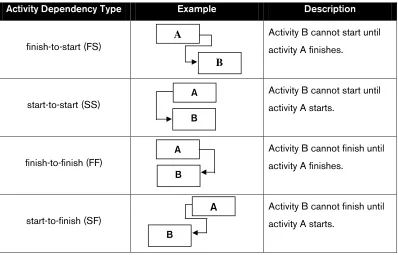
To sequence activities so they happen at the right time, you must link dependent activities and specify the type of dependency. The linkage is determined by the nature of the dependency. Activities are linked by defining the dependency between their finish and start dates, as shown below.
Figure 8. Types of Activity Dependencies
Activity Dependency Type Example Description
finish-to-start (FS)
Activity B cannot start until
activity A finishes.
start-to-start (SS)
Activity B cannot start until
activity A starts.
finish-to-finish (FF)
Activity B cannot finish until
activity A finishes.
start-to-finish (SF)
Activity B cannot finish until
Worksheet 16. Activity Dependencies
Activity Dependent On Dependency
Estimating Activity Duration
In addition to knowing the dependencies, to schedule the project you also need
estimates of how long each activity might take. This information will be used by senior management to schedule projects for the enterprise and by the project manager to assign resources, to determine when intervention is required, and for various other purposes.
Duration Estimation Guidelines
It is seldom possible to know the activity duration exactly. A given activity duration estimate can be considered to be associated with a statistical probability of actually achieving it. In most traditional projects, the activity duration is provided by the person to whom the activity is assigned; this person usually includes a buffer that can be used if there are unforeseen, but probable problems. In scheduling and managing projects, it is helpful to know the magnitude of this buffer. Thus, in estimating the duration of activities for Six Sigma projects, we ask for not one but three estimates: optimistic, most likely, and pessimistic. These estimates are defined as follows:
Optimistic duration: the activity duration if the work proceeded exactly according to plan, with no delays or interruptions.
Most likely duration: the activity duration if we assume a typical pattern of delays and interruptions.
Pessimistic duration: the activity duration if we assume an unusually large number of delays and interruptions.
In general, duration estimates should be obtained from the person assigned
responsibility for the activity. However, if this person is not on the project team, he or she should be made aware of the findings from the research conducted by the team. This would include research into the duration of similar activities on similar projects.
Note: In traditional project management, people are asked for deadlines or due dates
Worksheet 17. Activity Duration Estimates
Activity Duration Estimates WBS Activity
Description
Person Estimating
Duration (a) Optimistic
(b) Most Likely
(c) Pessimistic
Weighted Average13
Issue #
13
Gantt Charts
A Gantt chart shows the relationships among the project tasks, along with time estimates. The horizontal axis of a Gantt chart shows units of time (days, weeks, months, etc.). The vertical axis shows the activities to be completed. Bars show the estimated start time and duration of the various activities. Figure 9 illustrates a simple Gantt chart that can be created by hand. There are many types of Gantt charts, limited only by the needs of the project. The Gantt chart should show activity dependencies.
Figure 9. Gantt Chart of Schedule
Activity Week 1 Week 2 Week 3 Week 4
Gantt charts are often modified in various ways to provide additional information. One common variation is shown below. The milestone symbol (♦) represents an event (a point in time) rather than an activity (an interval of time). Unlike activities, milestones do not consume time or resources. When Gantt charts are modified in this way, they are sometimes called milestone charts. In the milestone chart below, uncompleted activity durations are shown as unfilled boxes. As activities are completed, the boxes are filled in.
Figure 10. Gantt/Milestone Chart of Actual vs. Scheduled Performance
Gantt charts and milestone charts can be modified to show additional information, such as who is responsible for a task, why a task is behind schedule, remedial action planned or already taken, etc. They are excellent tools for presenting a great deal of information in an easy-to-understand format.
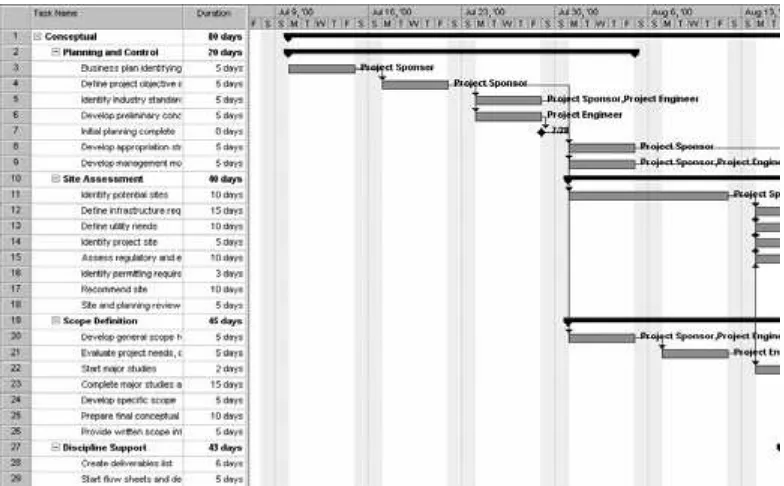
Computer-Generated Gantt Charts
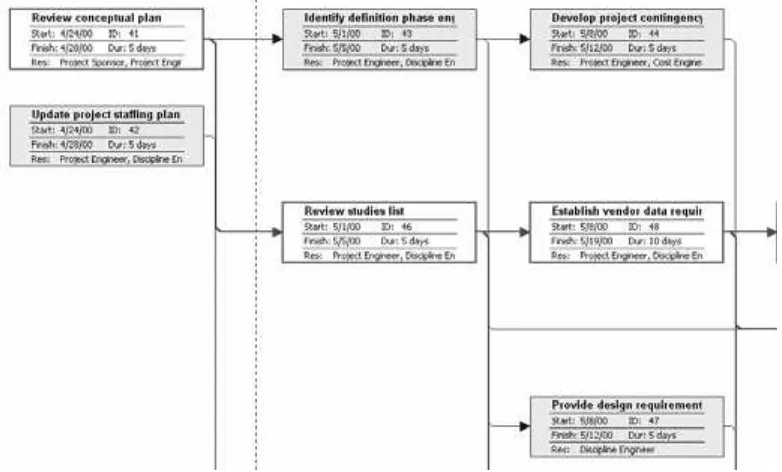
If the project team has access to project management software, it can use the software to draw Gantt and milestone charts. The chart below was created using Microsoft Project 2000. The chart indicates dependencies with arrows. However, pretty charts, attractive as they may be, are not a prerequisite for project success. Important, complex projects were planned and executed long before computers arrived!
Worksheet 18. List of Activities
No. Activity No. Activity
TE
AM
Worksheet 19. Project Gantt/Milestone Chart Template14
Project Name Chart Creator Date Created
Period
Worksheet 20. Project Gantt/Milestone Chart (Freehand Drawing Format)
Project Name Chart Creator Date Created
Period
Covered Comment
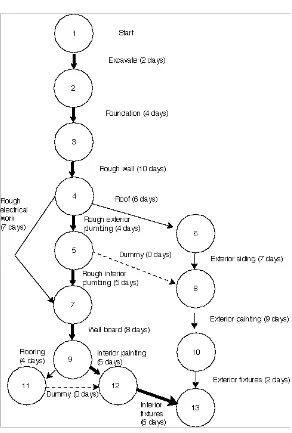
Network Diagrams
A project network diagram shows both the project logic and the project’s critical path activities, i.e., those activities that, if not completed on schedule, will cause the project to miss its due date.
PERT- and CPM-Type Project Management Systems
Although useful, Gantt charts and their derivatives provide limited project schedule analysis capabilities. The successful management of large-scale projects requires more rigorous planning, scheduling, and coordinating of numerous, interrelated activities. To aid in these tasks, formal procedures based on the use of networks and network
The most prominent of these procedures have been PERT (Program Evaluation and Review Technique) and CPM (Critical Path Method). The two approaches are usually referred to as PERT-type project management systems. The most important difference between PERT and CPM is that originally the time estimates for the activities were assumed to be deterministic in CPM and were probabilistic in PERT. Today, PERT and CPM actually constitute one technique and the differences are mainly historical. Modern project management tends more toward CPM than PERT.
CPM systems are used to:
• aid in planning and controlling projects
• determine the feasibility of meeting specified deadlines • identify the most likely bottlenecks in a project
• evaluate the effects of changes in the project requirements or schedule • evaluate the effects of deviating from schedule
• evaluate the effect of diverting resources from the project or redirecting additional resources to the project.
Project scheduling by CPM consists of four basic phases: planning, scheduling, improvement, and controlling.
The planning phase involves breaking the project into distinct activities. The time estimates for these activities are then determined and a network (or arrow) diagram is constructed, with each activity being represented by an arrow.
The ultimate objective of the scheduling phase is to construct a time chart showing the start and finish times for each activity as well as its relationship to other activities in the project. The schedule must identify activities that are critical in the sense that they must be completed on time to keep the project on schedule.
It is vital not to merely accept the schedule as a given. The information obtained in preparing the schedule can be used to improve it. Activities that the analysis indicates to be critical are candidates for improvement. Pareto analysis can be used to identify those critical elements that are most likely to lead to significant improvement in overall project completion time. Cost data can be used to supplement the time data. The combined time/cost information can be analyzed using Pareto analysis.
Figure 12. Example of Network Diagram
Worksheet 21. Network Diagram for Project*
Resource Availability
At this point in the project planning process, all resources have been identified, approved, and procured. You know who is to be on your team and what equipment and materials you are acquiring to achieve project goals. In today’s business climate, it’s rare for people to be assigned to one project from start to finish with no additional responsibilities outside the scope of a single project. Sharing resources with other areas of the organization or among several projects requires careful resource management to ensure that the resource will be available to your project when it is needed.
Calendars
Project and resource calendars identify periods when work is possible. Project calendars affect all resources (e.g., some projects are 24/7, while others work only during normal business hours). Resource calendars affect a particular resource (e.g., a team member’s personal schedule) or category of resources (e.g., work allowed by a union agreement). The availability of a work resource throughout the project can be specified in a number of ways:
• Set the work resource’s working days and times.
– What is the normal workweek for the resource?
– Scheduled time off (vacations, travel, holidays, etc.)
– Available substitutes
• Specify a work resource’s starting and ending dates for the project.
• Specify a work resource’s varying unit availability throughout the project. E.g., is the resource available to the project 100% of the time for some period and 50% for other periods?
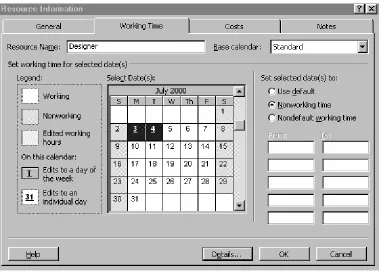
Resource availability is commonly shown on a resource calendar. This is simply an ordinary calendar that has additional information about when the resource will be available for project work. Computer groupware programs such as Lotus Notes™ or Microsoft Exchange™ allow people to share their calendar information with others. Calendars for other resources or for people who do not have access to groupware can be constructed manually and included in the project planner.
Worksheet 22. Resource Availability Information