Journal of Home Affairs Governance
p-ISSN: 2085-4323 | e-ISSN: 2503-3360 Jurnal Bina Praja
P : R D A
M H A R I Bina Praja Vol. 8 Iss. 2 pp. 175-340 p-ISSN: 2085-4323
e-ISSN: 2503-3360 Accredita 735/AU2/P2MI-LIPI/04/2016
Valid thru: 24 April 2019 Jakarta, November 2016 Jurnal Bina Praja 8 (2) (2016): 277-291
Jurnal Bina Praja
e-ISSN: 2503-3360 p-ISSN: 2085-4323
www.binaprajajournal.com
The Optimization of Budget Outcome to Create Trust
in Public Expenditure Allocation on Local Budget
Hendri Koeswara
1, *1 Department of Public Administration, Faculty of Social Sciences and Political Science
Universitas Andalas
Jl. Universitas Andalas, Limau Manis, Pauh, Kota Padang, Sumatera Barat 25163, Indonesia
Received: 13 June 2016; Accepted: 10 October 2016; Published online: 30 November 2016
DOI: 10.21787/jbp.08.2016.277-291
Abstract
Planning and budgeting process is the most crucial process in the administration of local government. Results of previous studies in Solok, the increase in the total budget is not accompanied by spending management capabilities. Expenditure of public service has always fluctuated, but ideally should always increasing. This study aimed to analyze the outcome of the budget in the allocation of public spending in an effort to realize the presence of trust on the budget in Solok West Sumatra Province. This study uses qualitative research methods with the type of research that is selected using descriptive type. While the techniques of data collection are done through an interview, observation and documentation study. This study further highlights the emic perspective, is the voice of the informant, not the personal opinion of the researchers (etic). Then, the data analysis is done categorically and chronologically, viewed repeatedly, and will continue to be encoded. To test the verification of data, triangulation is done by comparing the results of interviews with documents obtained in the field and testing of concepts used by researchers with the information given by the informant. The results showed that the pathology was found that budget allocations reflect inefficiencies as a failure of the link between policy, planning, and budgeting as a fragmented system. But on the other hand, it must be admitted there has been “trust” among policymaking actors in allocating public expenditure budget in playing the role in the budget policy.
Keywords: budget outcome, public trust, public expenditure management, budget pathology.
I. Introduction
The planning and budgeting process is the
most crucial process in the administration of local government for it is related to the goals of local government which aspires to the welfare of the
people in the region. The output of the integrated
planning process in the context of local government is the Regional Budget (APBD). Budget according to Wildavsky in Prawoto (2011) is (i) a record of the past; (ii) future plan (iii) resource allocation mechanism; (iv) a method for growth; (v) income
distribution tool; (vi) organizational
hope-aspirations-strategy; (vii) the form of the power of control; and (viii) a tool or a communication network. While APBD according to Adisasmita
(2011) is a regional financial operational plan,
on the one hand, describes the local revenue and
on the other hand is a routine expenditure and a development expenditure in a budget year.
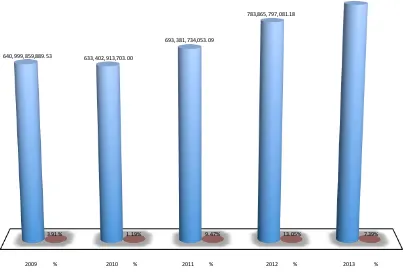
Previous research by the author on the management of public expenditure in the budget of Solok City in 2014 showed that the total
2009-2012 budget year fluctuated although tend to show
a rising trend. Was down by 1.19% in 2010 from IDR640,999,859,889.00 to IDR633,402,913,708.00.
The APBD of Solok City raised by 9.47% in 2011 and recorded to rise back by 13.1% in 2012. The positive
trend in terms of increase in budget planning also occurred in 2013 where the APBD of Solok City budget was IDR841,807,682,296.00 an increase of 7.39% (Koeswara, 2014). For more details, can be seen Solok City budget trend in Figure 1.
the ability of government expenditure management of Solok City. Public service expenditure is always
fluctuating. While in terms of the budget, ideally the public service expenditure should not be fluctuating,
the trend indicated should always be increased so
that the mandate of the decentralization laws is not
violated and the budgeting actors do not violate
their commitment to always fulfill their duty and
defend the public interest, as expressed by Halim (2001: 19) that the budgeting process agreed by the local government and the parliament is the people’s mandate.
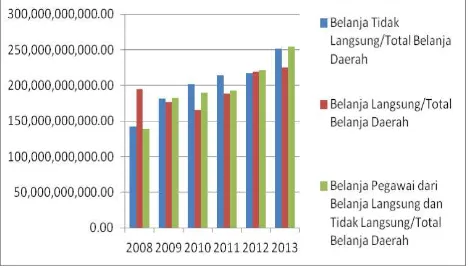
The trend of total expenditure in the APBD of
Solok City is that the indirect expenditure is always greater than the direct expenditure, an allocation of 42% in 2008, 51% in 2009 and reached the highest peak of 55% in 2010, and down from 53% in 2011, dropped to 50% in 2012, and rose again in 2013 to 53%. While direct expenditure trend always declined, whereas in 2008 the percentage is pretty good for 58%, but this achievement cannot
be maintained in subsequent budget years. As in the 2009 fiscal year was only 49%, in Fiscal in 2010 by
45%, then increased slightly to 47% in 2011, rose again by 50% in 2012, but dropped to 47% in Fiscal Year of 2013 (Koeswara, 2013). While the number of personnel expenditure of direct and indirect expenditure trend is increasing; i.e. 41% in 2008 to 51% in 2009, remained at 51% in 2010, fell to 48% in 2011, and then back up in 2012 and 2013 respectively by 51% and 53% (Koeswara, 2014). More details on public service expenditure trends
can be seen from Figure 2, which is the finding of
the previous study.
The performance that is extremely vital in the
management of public expenditure is the aggregate
fiscal discipline, which is very decisive in two other performances that are allocation efficiency and operational efficiency. The weak aggregate fiscal discipline in Solok City is characterized by the
existence of budget pathology. Schick explains that there are six budget pathologies that could weaken
fiscal discipline, which consists of: (1) unrealistic
budgeting; (2) hidden budgeting; (3) escapist budgeting; (4) deferred budgeting; (5) repetitive
budgeting; and (6) cashbox budgeting. The budget
pathology that is most prominent in Solok City based on the study that the researcher found in the previous study is unrealistic budgeting.
Unrealistic budgeting is a budget situation that has been approved but could not be implemented.
This is evident from the high number of deficits
and high rates of SILPA. In the APBD of Solok City, Silpa trend of Fiscal Year 2008-2014, the best percentage ever achieved is at 6% and the highest
is at 10%. The high number of SILPA is caused by
several factors, namely overshooting the target
revenue, the efficiency of the procurement process
of goods and services as well as activities that are
not realized (Koeswara, 2014). The first and second
causing factors existence could be ignored, but the third factor should be given more attention. And in the present study, the author sought to reinforce the
findings of the research that was previously found
640,999,859,889.53 633,402,913,703.00
693,381,734,053.09
783,865,797,081.18
841,807,682,296.11
3.91% 1.19% 9.47% 13.05% 7.39%
2009 % 2010 % 2011 % 2012 % 2013 %
in which these factors are the causes of the non-optimal public service expenditure performed in Solok.
The existence of non-optimal performance
of the budget certainly triggers the low trust in the government of Solok City. McEviliy, Perrone,
and Zaheer (2003) revealed that trust influences organizational outcomes, thereby increasing the
trust is also a substantive thing when talking about
the organization’s performance, in this regard
the Solok City Government’s performance. In the framework proposed by Dirks and Ferrin (2001),
trust affects an organizational outcome. So, it could
be determined at which level the trust owned by the
public organization. And herein lies the difference
in the current research, namely adding a variable of trust that will be dealt with in this paper about
“how to optimize the performance of the budget to
increase trust in the allocation of budget expenditure on public service in Solok City of West Sumatra?”
II. Method
This research will use qualitative research
approach. According to Marshall and Rossman
(1999), qualitative research approach is to study and
describe the typical properties of a particular social phenomenon systematically. While the type of study selected is using descriptive type to obtain a general and detailed overview of the research object, in a systematic, factual, and accurate way of facts and
the nature of specific populations (Usman, 2003). The data collection technique is conducted through
interviews, observation, and documentation. Observation and in-depth interviews will be conducted with informants related to this research. According to Bogdan (1993), such data collection
technique is defined as a strategy to obtain data with
the researcher intensively conducts a direct social interaction with the community being researched.
The observation is conducted to the physical
object which can explain the problem, for example, the various local expenditure policies outlined in the document of local planning, namely APBD policy, Priorities and Budget Ceiling, Local Government Work Plan (RKPD) and the Medium
Term Development Plan (RPJMD) in the period of 2009-2012 in Solok City Government. The interview is conducted without the use of a specific format
and the researcher is free to ask but remain in the framework of the research, so it does not come out of the research objectives. Such interview is chosen so that it can be run in an informal atmosphere and informants can freely express their views and comments related to the issues being examined. Informants are selected using purposive sampling
technique, namely, have certain characteristics such
as having more knowledge about some necessary information in a study conducted (Patton, 1990).
The research location in Solok City is chosen due
to the success in the management of public service expenditure in education and health so as to get an award from the government in 2007 and 2008. But that success is not able to be maintained so that the performance of the budget is not optimal in the
financial arrangement for public expenditure on
Solok City government.
The researcher serves as the main instrument of data collection that requires the researcher
to identify values, assumptions, and personal prejudices at the beginning of the study (Creswell,
2002). Therefore, the role of the researcher in qualitative research is the main instrument of
research. In which the researcher acts as the main instrument to observe how the phenomenon of human behavior is naturally associated with the concept of research by the researcher.
III. Result and Discussion
Solok City is one of the City Governments in the province of West Sumatra. Solok City is located at the position of 0°32“N-1°45”S, 100°27“E-101°41”E with an area of 57.64 km² (0.14% of the area of
West Sumatra Province). The city is located about 64
km from the capital of West Sumatra province that only has two districts and thirteen urban-villages, established pursuant to Law No 8 of 1956 on the Establishment of the Autonomous Region of Small City in the environment of the Central Sumatra in conjunction with Regulation of the Minister of Home Affairs No 8 of 1970 on the Implementation of the Municipal Government of Solok and the Municipal Government of Payakumbuh. Solok City, which has
a fairly high fiscal capacity, has a central role in
supporting the community’s economy of Solok City, Solok District, and South Solok.
The study on the optimizing of the performance
of the budget increases trust in the allocation of public service expenditure on the budget in the Solok City began with the collection of secondary data about Solok City budget and by conducting
initial interviews with parties related to the
budget planning in Solok City. Then analyzing the
APBD document of Solok City by comparing and classifying local expenditure budget allocation in
particular areas of public service. Then, conducted
the study and description of all the data ethically and empirically, and then reduced by making abstraction as a summary of the core.
A. The Illustration of APBD in Solok City
Budget is an operational plan for local
government financial in which there are many
elements. Among others are; 1. A region activity plan,
along with a detailed description, 2. The existence
of sources of revenue which is the minimum target to cover the costs related to the activity, and the cost of which the maximum limit of expenditure is
implemented, 3. The type of activities and projects
outlined in the form of number 4. Budget period, usually one year (Anggarini, Yunita and Puranto,
B. Henderson, 2010). The reform conducted by the
Public Expenditure Management is aimed to achieve three levels of performance budgeting, namely: (1)
The aggregate fiscal discipline; (2) The efficiency of the allocation; and (3) Operational efficiency,
in which the level of performance as the basis for achieving the next level of performance.
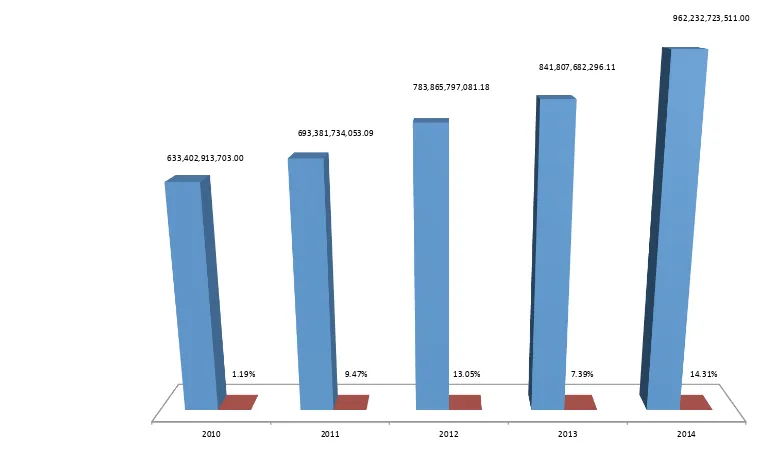
Based on the findings of the research field data
in Solok City, viewable the trend and comparison of the APBD that the total APBD of Solok City in the Year 2011-2014 showed a rising trend. In 2010, the APBD of Solok City is IDR633,402,913,708.00, and increased by 9.5% in Fiscal Year 2011, amounting
to IDR693,381,734,053.00. The largest increase in
the APBD of Solok City was 14.3% in Fiscal Year
2010 2011 2012 2013 2014
633,402,913,703.00
693,381,734,053.09
783,865,797,081.18
841,807,682,296.11
962,232,723,511.00
1.19% 9.47% 13.05% 7.39% 14.31%
2014 in the amount of IDR962,232,723,511.00. Whereas in Fiscal Year 2013, the APBD of Solok City has the smallest increase of only 7.9% or IDR841,807,682,296.00 (Koeswara, 2014). For more detail, can be seen the Solok City APBD trend
in Figure 3.
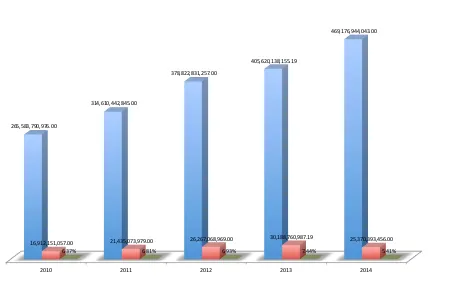
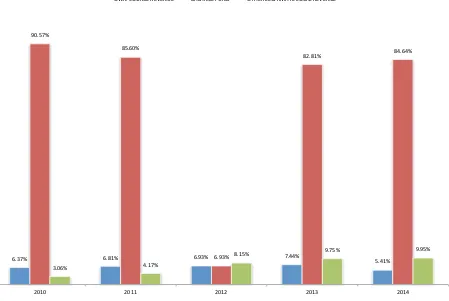
In terms of the revenue of Solok City consisting of PAD, Balance Funds and other legitimate Local Revenue for the period 2011-2014, the existing
trend always shows improvement. The comparison
2010 2011 2012 2013 2014
265,583,790,976.00
314,610,442,845.00
378,822,831,257.00
405,620,138,155.19
469,176,944,043.00
16,912,151,057.00 21,435,073,979.00 26,267,068,969.00 30,188,760,987.19 25,370,393,456.00
6.37% 6.81% 6.93% 7.44% 5.41%
PENDAPATAN PENDAPATAN ASLI DAERAH % PAD/PENDAPATAN
Figure 5. The Comparison of Revenue and PAD of Solok City in 2010-2014
of Solok City PAD with the average national PAD (provinces and regencies/cities), can be seen from Figure 4.
Based on Figure 4, the PAD of Solok City in Fiscal Year 2014 showed the average number is above West Sumatra Province and National. However, taken from the contribution of PAD to incomes below the national average has reached
17.3%. This means that Solok City should improve
the contribution of PAD to the regional income. On the other hand, PAD ideally should not burden to the poor and not complicate the business climate. But needed a further study on whether the decline in the Solok City PAD is because of those things or the adjustment to a more realistic target that can be
achieved by the city government. The contribution Trend of PAD to the income source in Solok City
budget is always in the range of 6-7% in the last
five years (2009-2013), but in Fiscal Year 2014, the
contribution of Solok City PAD to APBD is only in the range of 5%. However, PAD is always above 15 billion earned by Solok City, bringing this region in Fiscal Year 2014 back into the area that is prone to economic collapse in the era of regional autonomy.
The balance fund of Solok City from the data
of balance fund trend for Fiscal Year 2010-2014
is always increasing. The smallest increase is only achieved in Fiscal Year 2013 that is equal to 4%
or with the nominal of IDR335,886,010,373.00, even in Fiscal Year 2010, it decreased by -7% compared to the previous year that was only IDR240,541,846,940.00. Whereas in Fiscal Year 2012 and 2014, it got up again respectively by 19 and 18%, or IDR321,683,298,373.00 and IDR397,130,500,711.00. While for the General Allocation Fund in 2010 and 2014, the trend
always increases. The highest increase is in the
Fiscal Year of 2012 at 18% or with the nominal of IDR280,495,627,000.00, while the lowest increase occurred in Fiscal Year 2010, which was only 2% or with the nominal of IDR210,134,688,000.00 while on the planning data of APBD for Fiscal Year 2014, the revenue from DAU fund increased by 11% or as much as IDR354,372,682,000.00.
This increase is certainly related to the intensity of the local traveling by the local officials in
the Municipal Government of Solok City to Jakarta to improve DAU and DAK and the Government of Solok City does not want to repeat the DAK in the Fiscal Year 2013, which was not obtained at all, so that in Fiscal Year 2014, the DAK of Solok City is planned to be IDR32,287,100,000.00.
On the other hand, this huge DAU and DAK, again proved the dependence of local governments
to balance funds. The Government of Solok City from
the balance fund allocation trend towards revenue is
6.37% 6.81% 6.93% 7.44%
5.41% 90.57%
85.60%
6.93%
82.81% 84.64%
3.06% 4.17%
8.15% 9.75% 9.95%
2010 2011 2012 2013 2014
OWN-‐SOURCE REVENUE BALANCE FUND OTHER LEGITIMATE LOCAL REVENUE
always above 70% as the national average in Fiscal Year 2010. As in Fiscal Year of 2010, it is the highest percentage achieved by the Solok City where 91% income is derived from Solok City balance funds.
Then down in the fiscal year of 2011 to 86% and fell back to 85% in Fiscal Year of 2012. The best
percentage ever achieved by the Government of Solok City of the budget trend from 2010 to 2014 amounted to 83% in Fiscal Year 2013. While in Fiscal Year 2014, it increased back to 85%.
Tax Sharing Funds (DBHP) increased significantly in Fiscal Years of 2013 and 2014,
respectively amounting to IDR27,874,286,000.00
and IDR39,887,069,040.00. This is contrary to the
revenue of the APBD in Solok City for the revenue allocation from the Provincial Financial Assistance or other local governments. From 2010-2014 of the budget trend, the Government of Solok only once
received income from this budget item that is in the budget year 2010 amounted to IDR300,000,000.00. In general, the composition of revenue in the APBD of Solok City can be seen from Figure 6.
Budget is a management planning tool to
achieve organizational goals so that the organization
will know what to do and to which direction the policy will be made (Mardiasmo, 2009). In this context, APBD must aim to achieve the goals of the local government. At the level of local government, there are a lot of documents to be prepared by the local government in running its governance wheel.
The completion of APBD documents is stated in
the local planning document, namely on the APBD General Policy, Budget Priority and Ceiling, Local Government Working Plan (RKPD), and Local
Medium-Term Development Planning (RPJMD). To strengthen the findings of the previous study, this
Table 1.
The Comparison of Direct and Indirect Expenditures of Solok City APBD in 2011-2014
Fiscal Year
Expenditure Type
Persentase Perbandingan
Indirect Direct
2010 IDR202,187,535,270.00 IDR165,631,587,457.00 55:45
2011 IDR214,339,984,056.00 IDR188,301,171,123.00 53:47
2012 IDR217,106,308,604.00 IDR218,809,121,135.00 49:51
2013 IDR251,027,935,056.00 IDR224,704,975,816.00 53:47
2014 IDR270,660,060,724.00 IDR269,071,768,620.00 51:49
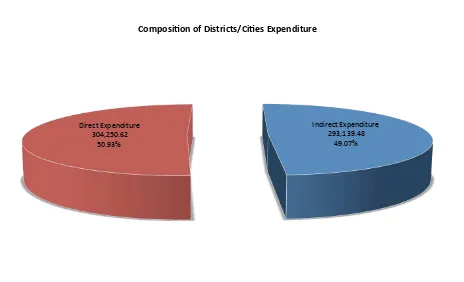
Indirect Expenditure 293,139.48
49.07% Direct Expenditure
304,250.62 50.93%
Composi'on of Districts/Ci'es Expenditure
study is based on the research data obtained in
the field, and Solok City already has the planning document completion. This means that from the
completion from the side of expenditure policy of
Solok City has been fulfilled well. So that the basic
capital for APBD that is arranged according to RKPD can run the functions of the APBD itself, namely the
authorization, planning, supervision, allocation, and stabilization functions (Bastian, 2010). And
according to this expert, the direction of budgeting
policy is very much influenced by economic policies that aim for economic growth, economic equality,
and economic stability. So that the local expenditure policy needs an expenditure management that will adapt to the budget policy direction, which is a tool to implement the economic policy (Mahmudi, 2010).
The change of policy on APND causes the
nomenclature of public service expenditure post the
reform of budgeting policy in the decentralization
era in Indonesia experiences a change in APBD, which is arranged by the local government.
The public service expenditure in the previous
policy consists of the expenditure for General Administration, Operation and Maintenance, Capital,
Financial Aid, and Unpredictability. The expenditure
can be divided into two parts, namely: (1) Indirect Expenditure, which is the expenditure that is not directly related to the program and activities of local
government. The indirect expenditure is classified
into personnel expenditure which consists of salary
and local officers and civil servants allowance, subsidized expenditure, interest expenditure, grant
Table 2.
The Comparison of Personnel Expenditure and Total Indirect Expenditure
Fiscal Year
The Comparison of Personnel Expenditure
and Total Indirect Expenditure Percentage (%) of Personnel
Expenditure
Indirect Personnel Expenditure
2010 IDR202,187,535,270.00 IDR168,111,920,270.00 83
2011 IDR214,339,984,056.00 IDR175,518,184,056.00 82
2012 IDR217,106,308,604.00 IDR218,809,121,135.00 94
2013 IDR251,027,935,056.00 IDR203,719,961,719.00 92
2014 IDR270,660,060,724.00 IDR258,174,431,339.00 95
expenditure, profit-sharing expenditure, social aid expenditure, financial aid expenditure, and
unpredictable expenditure; (2) Direct Expenditure, which is the expenditure that is not directly related to the program and activities of local government.
The expenditure is grouped into personnel
expenditure that consists of honorarium and income that is directly related to the implementation of goods and service expenditure activities, and capital expenditure.
Based on the research data in the field,
obtained a comparison between direct and indirect
expenditures as described in Table 1.
The comparison percentage between indirect
expenditure and indirect expenditure of Solok City
APBD in Budget Trend 2010-2014, always experience
changes. But the indirect expenditure allocation is not as extreme as in Fiscal Year 2010 which reached 55% of the total budget. In Fiscal Year of 2012 is the
only fiscal year that allocated its direct expenditure
bigger than its indirect expenditure. Meanwhile, in 2014 the comparison difference between indirect expenditure and direct expenditure is very thin and
tend to be balanced. This at least shows that there
is a good intention from Solok City Government
to prioritize the expenditure for the people by
providing bigger priority to the direct expenditure by holding back the indirect expenditure with the
ratio of 51:49. This is in contrary with the national
data for the ratio of indirect expenditure and direct expenditure as shown in Figure 7.
Therefore, then budget as the controlling
instrument used to avoid overspending, underspending, misappropriation, or misspending can run well (Indrayeni et al., 2013). In local government, the budget is a political document as a form of executive commitment and legislative
agreement on the use of the public fund for a specific
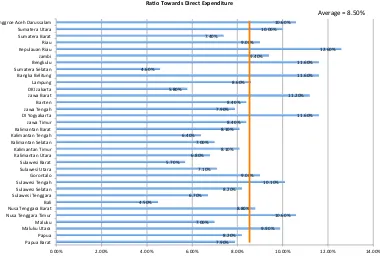
Figure 9. Rasio Nasional Belanja Pegawai terhadap Belanja Langsung Tahun Anggaran 2014
7.90% 8.20% Sulawesi Tenggara Sulawesi Selatan Sulawesi Tengah Gorontalo Sulawesi Utara Sulawesi Barat Kalimantan Utara Kalimantan Timur Kalimantan Selatan Kalimantan Tengah Kalimantan Barat Jawa Timur Nanggroe Aceh Darussalam
Ra#o Towards Direct Expenditure
Average = 8.50%
Table 3.
The Comparison of Personnel Expenditure with Total Direct Expenditure
Fiscal Year
The Comparison of Personnel Expenditure
with Total Direct Expenditure Percentage (%)Personnel
interest. Thus, the budgeting process must be seen
clearly the budgeting composition that is more on
the interest and demand of the people. The indirect
expenditure composition in the APBD trend of Solok City, for example in personnel expenditure, is still far below the ideal portion of 60% from the total Indirect Expenditure.
The personnel expenditure trend in the APBD
of Solok City increasingly shows the magnitude of the allocation for personnel expenditure; even, in Fiscal Year 2014 it reached 95% or IDR258,174,431,339.00 of the total indirect expenditure budgeted at IDR270,660,060,724.00. While the best composition ever achieved by Solok City in its APBD is in
Fiscal Year 2011 with the personnel expenditure allocation of IDR175,518,184,056.00 from the allocation of the indirect expenditure budgeted at IDR214,339,984,056.00 or 82% of the indirect
expenditure. The bigger the personnel expenditure
allocation than the indirect expenditure means the interest expenditure, grant expenditure, social
aid expenditure, financial aid expenditure, and
unpredictable expenditure will be less in the allocation.
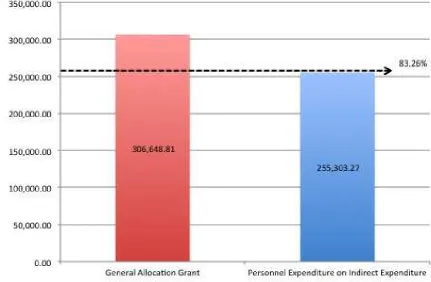
If drawn a comparison with the national data, the ratio of DAU to personnel expenditure on the indirect expenditure of the Fiscal Year 2014, the DAU allocation for personnel expenditure on the indirect
Table 4.
The Comparison of Goods and Service Expenditure Towards Total Direct Expenditure
Fiscal Year
The Comparison of Goods and Service Towards Total Direct Expenditure Sulawesi Tenggara Sulawesi Selatan Sulawesi Tengah Gorontalo Sulawesi Utara Sulawesi Barat Kalimantan Utara Kalimantan Timur Kalimantan Selatan Kalimantan Tengah Kalimantan Barat Jawa Timur Nanggroe Aceh Darussalam
Ra#o Towards Direct Expenditure
Average = 43.30%
expenditure reached 83.26%. While in Solok City,
based on the data in the field, the percentage of DAU
to personnel expenditure on indirect expenditure is
only 72.85%. This indicates that while the personnel
expenditure on the indirect expenditure is not ideal, but it is better than the national average ratio of DAU to personnel expenditure on the indirect expenditure. As shown in Figure 8.
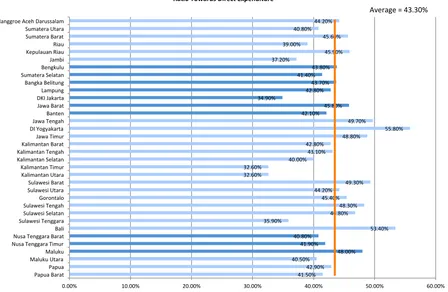
Meanwhile, the personnel expenditure allocation from the direct expenditure is ideally
always below 10%. The study result conducted by
the author shows the data as follows
Of the personnel expenditure trend data on the direct expenditure in the APBD of Solok City in
Fiscal Year 2010-2014, the majority ideal figure is
always achieved by the Government of Solok City in allocating the budget. Although in Fiscal Year 2010 it reached 13% or IDR21,113,409,500.00 and in
2013 it reached 11% or IDR24,594,212,840.00. The
best allocation achieved by Solok City that should be appreciated is in Fiscal Year 2014 that is only 6% or IDR15,351,650,000.00. It is if compared to the national average and the province of West Sumatra, Solok City is even better in personnel expenditure to the direct expenditure. It can be seen from the graph below:
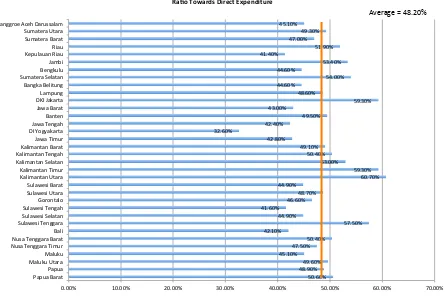
Meanwhile, the percentage of goods and services expenditure ideally amounted to 70% of
Table 5.
The Comparison of Capital Expenditure with Total Direct Expenditure
Fiscal Year
The Comparison of Capital Expenditure
with Total Direct Expenditure Percentage (%)Capital
Expenditure Sulawesi Tenggara Sulawesi Selatan Sulawesi Tengah Gorontalo Sulawesi Utara Sulawesi Barat Kalimantan Utara Kalimantan Timur Kalimantan Selatan Kalimantan Tengah Kalimantan Barat Jawa Timur Nanggroe Aceh Darussalam
Ra#o Towards Direct Expenditure
Average = 48.20%
the total direct expenditure. According to the data exploration conducted by the researcher towards the APBD of Solok City, found the data as follows:
From the table above, the expenditure allocation of goods and services has never been closer to this ideal percentage. In Fiscal Year 2010 the Government of Solok City allocated IDR82,178,212,079.00 or only about 50%. In the
next fiscal year, which was the Fiscal Year 2012,
it increased to 55% or IDR103,946,081,856.00. But this increase cannot be sustained and even down to 39% or IDR84,266,937,105.00. And Fiscal Year 2012 was the worst year for the allocation of expenditure on goods and services ever allocated by the Government of Solok City during 2010-2014
periodization. But it was refined by Solok City with a very significant rise to 52% in Fiscal Year 2013, or IDR117,373,092,876.00. The positive trend of
the increase can still be maintained by Solok City in Fiscal Year 2014 in the amount of 57%, although not above the ideal number, or IDR153,504,496,284.00. However, when compared with the national average and the province of West Sumatra, Solok City is better in capital spending. It can be seen from Figure 10.
Whereas ideally the capital expenditure is allocated for 20% of the total direct expenditure, based on the data that researcher found in the
field, can be found out the composition of capital expenditure in the APBD of Solok City from Table 4.
Table 4 shows that Solok City in capital
spending never came close to the ideal number in allocating the capital expenditure. Still stuck on the procurement to obtain certain advantages of the capital expenditure. From the budget trend of 2010-2014, the best composition in Fiscal Year 2013 and 2014. And the worst percentage allocated for capital expenditure that is very large is in Fiscal Year 2012, which reached 53% or amounted to IDR116,972,176,280.00. However, when compared with the national average and the province of West Sumatra, Solok City is better in capital expenditure. It can be seen from Figure 11.
The ideal proportion in the budget allocation must necessarily be realized based on the
development priorities in the APBD so that the development result will be in accordance with the targets to be achieved gradually over a period
of five years. But if every year everything is to
be built and every actor involved in the making of budget policy, then certainly the allocation of
limited budgets controlled by the infinite desire
will only give birth to short-term development but not about sustainability and goodness in
the future. The occurrence of fragmentation, as
disclosed by Lee, Joyce & Johnson (2013) that
organizational units within line agencies tend to
be concerned primarily with their own programs
and frequently fail to take a broad perspective, is a necessity that the public organizations are too late to fight for what is importance in the budget that
they forget that the main thing is how the public interest can be accommodated properly. If indeed
this proportion in terms of quantity becomes the
ideality and the need for Solok City, then needed
to be explored further how is the quality of such
budget allocations. So the discussion of budgets at the plenary forum of Parliament is very important to maintain compatibility between the Public Policy APBD and temporary budget priorities and ceiling with the programs and activities proposed in the APBD Ranperda.
B. The Optimization of Budget Outcome to Increase Trust in Public Expenditure Allocation on the APBD of Solok City
The implementation of Public Expenditure
Management in Solok City does not run well. It is
characterized by the weakness of the aggregate fiscal discipline and the allocation inefficiency
which are two of the three important outputs in Public Expenditure Management as proposed by
Shick (1998). Aggregate fiscal discipline is the term
for the norm that is often accepted as the truth that the budget should contain a statement of the
actual spending that will occur during the fiscal
year on the basis of prudence (Prudent) and not
a wish list (wish list). The weak aggregate fiscal discipline in Solok City is characterized by the
existence of budget pathologies. Schick explains there are six budget pathologies that could weaken
fiscal discipline, which consists of: (1) unrealistic
budgeting; (2) hidden budgeting; (3) escapist budgeting; (4) deferred budgeting; (5) repetitive
budgeting; and (6) cashbox budgeting. The present study finds again that the most prominent budget
pathologies in Solok City are unrealistic budgeting and repetitive budgeting.
The high number of SILPA is one form of
unrealistic budgeting, which is a situation of approved budget that could not be implemented.
There are several factors that cause high rates in the
SILPA of the APBD of Solok City such as overshooting
the target revenue, the efficiency of the procurement
process of goods and services, as well as activities
that are not realized. The first and second causing
factors existence can be denied, but the third factor should be given more attention. Meanwhile, the
determination of the value of the deficit in a large
in decreased integrity of the budget as an official statement of the government’s financial policy. Repetitive budgeting is reflected in the practice of a budget change in Solok City. The changes in the
budget is a common practice by Solok City and if the budget change is not done, then it is considered to be a remarkable event because it is out of the habitual factor.
The efficiency of the allocation of the
performance of budgeting at level two to be achieved
after the aggregate fiscal discipline. The allocation efficiency associated with the government’s capacity
to distribute resources based on the effectiveness of public programs to achieve its strategic objectives.
The efficiency of the allocation will be seen from the
composition of government spending in accordance with the direction of the strategic objectives to
be achieved. The strategic objective contained in RPJMD as five-year plan document that contains the vision and mission to be achieved by Solok City. The efficiency of the allocation will happen if the budget
allocation is directed to achieve the vision and mission that will be visible from the composition of the budget.
The study on RPJMD and APBD documents in Solok City found that the efficiency of the allocation has not been reached (occurs an inefficiency in allocation). The inefficiency in allocation is due
to a budget pathology. Schick says there are four
pathologies that attack the efficiency of budget
allocation, namely: (1) short-term budgeting; (2) escapist budgeting; (3) distorted budgeting; and (4) enclave budgeting. Short-term budgeting and distorted budgeting are two budget pathologies occurring in Solok City. Short-term budgeting is a condition in which the government budget is made yearly and does not take into account the implications in the medium term that occurs due to failed connections between policy, planning, and budgeting due to a fragmented system resulted by the policy making, the planning, and the budgeting are independent of one another.
The occurrence of fragmentation, as stated by Lee, Joyce & Johnson (2013) that organizational
units within line agencies tend to be concerned
primarily with their own programs and frequently
fail to take a broad perspective, is a necessity that
a public organization is too late to fight for what is
of importance in the budget that they forget that the main thing is how the public interest can be accommodated properly. If indeed this proportion
in terms of quantity becomes an ideality and the
need for Solok City, then need to be explored
further how is the quality of such budget allocation.
So the discussion of APBD at the plenary forum of Parliament is very important to maintain compatibility between the Public Policy of APBD and temporary budget priorities and ceiling with the
programs and activities proposed in the Ranperda
of APBD. Budgeting is defined as the annual budget
ritual, not a practice based on policies so that there is a failure to directly associate resources with policy priorities that lead to a massive mismatch between what is promised through government policy and what can be provided.
Short-term budgeting originated from the disuse of RPJMD as a reference in the preparation of annual programs and activities that originated from the lack of control from the BAPPEDA related to the planning of the Renstra of SKPD. Inconsistencies
between the five-year plan documents with the
annual budget makes the vision and mission
stated in RPJMD difficult to achieve, which further
deteriorated with the practices of aspiration fund of Parliament which is substantially pure from constituents without ever seeing the development planning document that will eventually cause a
massive mismatch between the five-year plan
documents and the annual budget and also indicates
the lack of efficiency in the budget allocation of
Solok City.
The second budget pathology experienced by Solok City which leads to an inefficient allocation
is distorted budgeting. Distorted budgeting is a condition in which limited resources are spent in a lighthouse project, while the project related to human capital is not a priority (occurs a misallocation). In the context of Solok City, distorted budgeting can be seen from the magnitude of the budget allocation for activities that are not too important, the activities that are over-budgeted (exceeds the need) and not in accordance with the
principles of economic, efficiency, and effectiveness
(3E) as proposed by Bastian (2010), which stated that the principles of budgeting are very well known
as the Three Es, namely economical, efficient, and
effective. Economical is only related to the input; effectiveness is only related to the output; while
efficiency is the relation between input and output. The budget pathology suffered by the
Government of Solok City in its APBD undermines
the trust in the organization of the city government
as a result of non-optimal budget performance. As
stated by the experts’ opinion that organizational trust is thus defined as the positive expectations
individuals have about the competence, reliability,
and benevolence of organizational members, as well as the institutional trust within the organization
(Mayer et al., 1995; McKnight et al., 1998 Ellonen et al., 2008).
This study shows that more efforts are needed
so that the allocation of public service expenditure can be effective in balancing the various demands
of the organization, both in public organization and private organization, and the strategy to
local government, of course, is the local RPJMD that becomes the base of allocation policy of public service expenditure in order to have performance that is optimal and higher in trust. So the link between the not optimal performance triggers the low trust in the government of Solok City in the context of the outcome of the budget, it is in line with the opinion of McEviliy, Perrone, and Zaheer (2003)
which revealed that trust influences organizational
performance.
IV. Conclusion
Based on the budgeting process and the budget allocation mechanism in Solok City, it can be concluded that the allocation of Public Expenditure in Solok already contained trust, although not yet
optimal. Trust is still weak due to weak aggregate fiscal discipline and allocation inefficiency. The weak aggregate fiscal discipline is characterized
by the presence of the unrealistic budgeting and
repetitive budgeting. The allocation inefficiency is characterized by short-term budgeting and distorted budgeting. And the public organization
is still stuck to the fragmentation that causes one another just struggle to defend the budget made, and it is applicable in Solok City according to the assessment conducted. So that budgetary reform measures need to be done by rearranging the rules in budgeting.
The allocation of public expenditure through
the Public Expenditure Management offers re-evaluation based on the conceptual framework of the institutional arrangement and the role of each
institution can be optimized and create a balance
of power between institutions so that the trust
would be better in the future. The settling in Solok
budgeting should be done and it could be that other cities/districts are also experiencing similar condition so that it can be done by rearranging the rules, the role, and the available information.
Acknowledgement
The author expressed his gratitude to the LPPM
of Andalas University and the Directorate General of Higher Education of the Ministry of Research And
Technology (Kemenristek) which have provided funding for this study. The Government of Solok City,
West Sumatra Province, which has supported the implementation of research activities so that this study can be completed properly.
V. References
Adisasmita, R. (2011). Pengelolaan Pendapatan &
Anggaran Daerah. Yogyakarta: Graha Ilmu.
Anggarini, Y. & Puranta, B. (2010). Anggaran
Berbasis Kinerja: Penyusunan APBD Secara Komprehensif. Yogyakarta: UPP STIM YKPN.
Bastian,. (2010). Sistem Perencanaan dan
Penganggaran Pemerintah Daerah di Indonesia. Jakarta: Salemba Empat.
Creswell, J. (2002). Research Design: Qualitative &
Quantitative Approach. Jakarta: KIK Press.
Dirks, K. & Ferrin, D. (2001). The Role of Trust in Organizational Settings. Organization Science,
12(4), 450-467. http://dx.doi.org/10.1287/
orsc.12.4.450.10640
Ellonen, R., Blomqvist, K., & Puumalainen, K. (2008). The Role of Trust in Organisational
Innovativeness. European Journal Of Innovation
Management, 11(2), 160-181. http://dx.doi. org/10.1108/14601060810869848
Halim, A. (2007). Akuntansi Keuangan Daerah.
Jakarta: Salemba Empat.
Indrayeni,. (2013). Teori, Konsep, dan Aplikasi
Akuntansi Sektor Publik. Jakarta: Salemba Empat.
Koeswara, H. Laporan Akhir Penelitian (Tahun
Kedua) Analisis Kebijakan Alokasi Belanja Pelayanan Publik pada Anggaran Pendapatan
dan Belanja Daerah Kota Solok. Padang:
Universitas Andalas.
Koeswara, H. Laporan Akhir Penelitian (Tahun
Ketiga) Analisis Kebijakan Alokasi Belanja Pelayanan Publik pada Anggaran Pendapatan
dan Belanja Daerah Kota Solok. Padang:
Universitas Andalas.
Koeswara, H. Laporan Akhir Penelitian (Tahun
Pertama) Analisis Kebijakan Alokasi Belanja Pelayanan Publik pada Anggaran Pendapatan
dan Belanja Daerah Kota Solok. Padang:
Universitas Andalas.
Lee, R., Johnson, R., & Joyce, P. (2013). Public
Budgeting Systems. Burlington, MA: Jones and Bartlett Learning.
Mahmudi,. (2010). Manajemen Keuangan Daerah.
Jakarta: Erlangga.
Mardiasmo,. (2009). Akuntansi Sektor Publik.
Yogyakarta: Andi.
Marshall, C. & Rossman, G. (1999). Designing
Qualitative Research (3rd ed.). Thousand Oaks, CA: Sage Publications.
Mayer, R., Davis, J., & Schoorman, F. (1995). An
Integrative Model of Organizational Trust. The Academy Of Management Review, 20(3), 709. http://dx.doi.org/10.2307/258792
McEvily, B., Perrone, V., & Zaheer, A. (2003). Trust as an Organizing Principle. Organization Science,
14(1), 91-103. http://dx.doi.org/10.1287/
orsc.14.1.91.12814
McKnight, D., Cummings, L., & Chervany, N.
(1998). Initial Trust Formation in New Organizational Relationships. The Academy Of Management Review, 23(3), 473. http://dx.doi. org/10.2307/259290
Evaluation Methods. Beverly Hills, CA: Sage Publications.
Prawoto, A. (2011). Pengantar Keuangan Publik.
Yogyakarta: BPFE.
Schick, A. (1998). Contemporary Approach to Public
Expenditure Management. Washington DC:
World Bank Institute.
Taylor, S. & Bogdan, R. (1984). Introduction to Qualitative Research for Meanings. New York: John Wiley & Sons.
Usman, H. & Akbar, P. (2003). Metodologi Penelitian