Corporate Turnarounds: The Duality of Retrenchment
and Recovery
Achim Schmitt and Sebastian Raisch
Ecole Hôtelière de Lausanne; University of GenevaABSTRACT Corporate turnaround research has described retrenchment and recovery as contradictory forces that should be addressed separately. While a few scholars have argued that retrenchment and recovery are interrelated and may have to be integrated, others have contended that such arguments are flawed since they downplay the contradictions between the two activities. In this paper, we clarify the nature of the retrenchment–recovery interrelations, as well as their importance for turnaround performance. Drawing on the paradox literature, we argue that retrenchment and recovery form a duality: they are both contradictory and complementary. Integrating the two activities allows turnaround firms to create benefits that exceed the costs of their integration, which affects turnaround performance positively. We test our arguments through an empirical study of 107 Central European turnaround initiatives and find evidence for the assumed duality between retrenchment and recovery. Our main
contribution is integrating the hitherto disparate theory perspectives of corporate turnaround into an overarching framework.
Keywords: corporate turnaround, organizational decline, organizational paradox, recovery, retrenchment
INTRODUCTION
After two fundamental economic crises in recent years, corporate turnaround has become a common phenomenon in managerial practice. It refers to the recovery of a firm’s performance after an existence-threatening decline situation (Hofer, 1980; Lohrke et al., 2012). Scholars explore two essential categories of turnaround activities: retrench-ment and recovery (Robbins and Pearce, 1992; Sudarsanam and Lai, 2001). While retrenchment focuses on increasing efficiency through cost and asset reductions, recov-ery concentrates on improving a firm’s market position through strategic change (Lamberg and Pajunen, 2005). Since prior research describes retrenchment and recovery as contradictory forces (Pearce and Robbins, 2008), scholars generally advise turnaround
Address for reprints: Sebastian Raisch, University of Geneva, Hautes Etudes Commerciales (HEC), 40, Blvd du Pont d’Arve, CH-1211 Geneva, Switzerland ([email protected]).
© 2013 John Wiley & Sons Ltd and Society for the Advancement of Management Studies
firms to opt for one or the other (e.g. Hofer, 1980; Schendel et al., 1976), or to address them sequentially (e.g. Bruton et al., 2003; Robbins and Pearce, 1992).
Given the focus on separating the two activities, prior turnaround research has paid little attention to the interrelations between retrenchment and recovery (Lohrke et al., 2012). However, some scholars suggest that retrenchment and recovery may be mutually reinforcing and their integration beneficial. For example, Arogyaswamy et al. (1995) argue that it may be difficult to retrench effectively without an understanding of which resources should be retained for recovery activities. Without a better grasp of these complementarities, we have, at the very best, a partial understanding of how retrench-ment and recovery contribute to turnaround success (Pajunen, 2005). At the same time, others warn that integrating retrenchment and recovery can create additional costs that impact turnaround performance negatively (Pearce and Robbins, 2008; Sheppard and Chowdhury, 2005). The purpose of this study is thus to clarify the nature of the retrenchment–recovery interrelations, as well as their importance for turnaround performance.
We draw on the paradox literature (Cameron, 1986; Lewis, 2000; Smith and Lewis, 2011) to build new theory on the interrelations between retrenchment and recovery. We argue that retrenchment and recovery are a duality (Farjoun, 2010): they are contradic-tory, but also mutually enabling. The interaction of retrenchment and recovery allows turnaround firms to create benefits that exceed the cost of their integration, which contributes positively to turnaround performance. We test our theoretical arguments through an empirical study of 107 Central European turnaround initiatives. The results confirm that the two activities’ interaction enhances turnaround performance through their mutually enabling relationship.
Our arguments and findings allow us to make several theoretical contributions. We contribute to the corporate turnaround literature by developing a richer conceptualiza-tion of the retrenchment–recovery interrelaconceptualiza-tions. This conceptualizaconceptualiza-tion considers the complementarities and tensions, not just one or the other. In addition, it provides the foundation for the integration of the hitherto disparate threat-rigidity theory (e.g. Barker and Mone, 1998) and prospect theory (e.g. Hambrick and D’Aveni, 1988) perspectives of corporate turnarounds into an overarching framework. Further, we contribute to the debate on turnaround stage models (e.g. Bruton et al., 2003; Robbins and Pearce, 1992) by providing a more integrative perspective. We show that retrenchment and recovery are beneficial at all stages of the turnaround process and present multiple strategies for managing the tensions that arise from their integration. Finally, we contribute to the paradox literature by conceptualizing and quantifying a novel duality in the empirical context of corporate turnarounds.
CORPORATE TURNAROUNDS: RETRENCHMENT AND RECOVERY
in retrenchment and recovery activities during the turnaround process (Lohrke et al., 2012; Robbins and Pearce, 1992).
Similar to the downsizing literature (e.g. DeWitt, 1998), turnaround studies argue that retrenchment activities’ purpose is to reduce assets and/or improve operational effi-ciency to increase firm profitability and strengthen the firm’s industry position (Robbins and Pearce, 1992). While it can involve similar resource-reduction techniques, retrench-ment’s objectives are distinct from those of other size-decreasing moves such as downs-caling (which aims at reducing the firm’s output) and downscoping (which aims at restructuring the firm’s activity portfolio) (DeWitt, 1998). Some turnaround scholars (e.g. Morrow et al., 2004) distinguish between asset retrenchment (i.e. reducing assets through plant closings or divestures) and cost retrenchment (i.e. reducing operational costs through layoffs or process improvements). Despite equivocal empirical evidence (Barker and Mone, 1994; Boyne and Meier, 2009; Castrogiovanni and Bruton, 2000), the most recent studies agree that successful turnarounds depend on effective retrenchment activi-ties (Lohrke et al., 2012; Morrow et al., 2004; Pearce and Robbins, 2008).
Recovery activities refer to strategic changes that transform and reposition the firm for sustained growth and profitability (Barker and Duhaime, 1997). These activities include market penetration, product launch, market entry, acquisitions, and structural change (Bibeault, 1982; Robbins and Pearce, 1992). Despite theory suggesting that recovery is essential for turnaround success, there is little empirical evidence for this contention. Notable exceptions are the studies by Barker and Duhaime (1997), Sudarsanam and Lai (2001), and Ndofor et al. (2013), which provide some illustrative support for recovery’s role in turnarounds.
Most corporate turnaround studies describe retrenchment and recovery as contradic-tory forces and warn against pursuing them concurrently (Pearce and Robbins, 2008). According to early research (Hofer, 1980; Schendel et al., 1976), turnaround firms opt for either retrenchment or recovery, depending on the cause of decline: retrenchment when they experience internal inefficiencies that threaten their survival, and recovery when their strategies and the environment are misaligned. Conversely, later turnaround stage models suggest that turnarounds always involve both retrenchment and recovery. Since the two activities are contradictory, scholars argue that they should be addressed sequentially (Lohrke et al., 2012).
As initially described by Robbins and Pearce (1992), the sequential perspective has two, clearly separate, subsequent stages: ‘The retrenchment phase was considered to extend from the onset of the turnaround situation until asset and cost reduction ceased . . . [whereas] the recovery phase was considered to extend from the cessation of asset and cost reductions until the firm achieved or failed to achieve turnaround’ (p. 296). Robbins and Pearce advise against initial recovery activities: the focus should be solely on retrenchment to provide ‘a stable base from which an array of recovery strategies could be successfully undertaken’ (p. 304). After the initial stage’s completion, retrenchment activities cease and turnaround firms shift to recovery (Filatotchev and Toms, 2006).
for sustainable adaptation to the market (Martin and Kimberly, 2008; Morrow et al., 2004). DeWitt (1998) and Lim et al. (2013) warn that retrenchment activities need to consider the firm’s long-term strategic orientation. Moreover, an initial focus on retrenchment may reduce firms’ innovation capacity and delay or hinder effective recovery activities (Morrow et al., 2004). Consequently, some argue in favour of a more interdependent perspective that considers retrenchment and recovery as complementary actions (Pajunen, 2005). For instance, Arogyaswamy et al. (1995) present a turnaround model in which the stages ‘are interdependent rather than sequential . . . [which] sug-gests that both activities can occur simultaneously’ (p. 513).
While some scholars (e.g. Barker and Duhaime, 1997; Boyne, 2006; Pajunen, 2005) applaud the more interdependent view of the corporate turnaround stages, this perspec-tive has also been criticized. Scholars argue that a simultaneous focus on both turna-round activities is problematic due to a lack of organizational resources (Lohrke et al., 2012) and the increased level of managerial complexity (Sheppard and Chowdhury, 2005). Owing to resource constraints, declining organizations may have considerable difficulties focusing on retrenchment and recovery simultaneously.
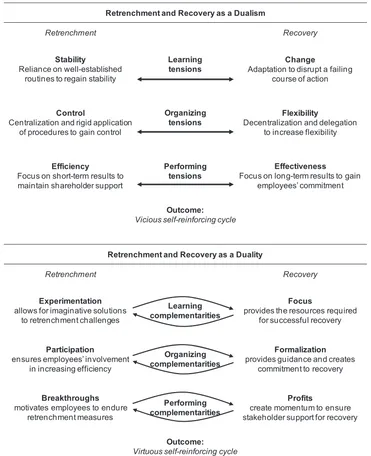
In summary, scholars have argued that the existing perspectives fail to capture the full complexity of the turnaround process (Castrogiovanni and Bruton, 2000; Sheppard and Chowdhury, 2005). While most studies highlight the contradictions between retrench-ment and recovery, others point to the two activities’ compleretrench-mentarities. Drawing on the paradox literature (Lewis, 2000; Smith and Lewis, 2011), we now consider both the contradictions and the complementarities between retrenchment and recovery. Follow-ing the dominant view in extant turnaround research, we first build a theory on the contradictions between retrenchment and recovery (the dualism perspective). Subse-quently, we expand the theory to include the complementarities that can result from their integration (the duality perspective).
THE DOMINANT VIEW: RETRENCHMENT AND RECOVERY AS A DUALISM
(2008) empirically validated paradox framework, we distinguish three types of paradoxi-cal tensions (learning, organizing, performing) between retrenchment and recovery during corporate turnarounds (see Figure 1).
Learning tensionssurface as dynamic systems change, renew, and innovate (O’Reilly and Tushman, 2008). They include stability-change and efficiency-innovation tensions (Smith and Lewis, 2011). During corporate turnarounds, learning tensions become
Retrenchment and Recovery as a Dualism
y
Adaptation to disrupt a failing course of action
Control
Centralization and rigid application of procedures to gain control
Organizing
Focus on short-term results to maintain shareholder support
Performing tensions
Effectiveness
Focus on long-term results to gain employees’ commitment
Outcome:
Vicious self-reinforcing cycle
Retrenchment and Recovery as a Duality
y
visible through the retrenchment and recovery activities’ distinct purposes. Retrench-ment is defensive, focused on fixing the existing to regain stability. The reliance on well-established routines hinders innovation (Barker and Mone, 1998; Carmeli and Sheaffer, 2009), but allows turnaround firms to regain stability by improving their efficiency (Bruton et al., 2003; Lohrke et al., 2012). Conversely, recovery is proactive, focused on change towards something new. Recovery activities disrupt the firm’s failing course of action and seek adaptation (Barker and Duhaime, 1997). The drive for change can undermine stability, but allows the innovation and reorientation required to over-come the firm’s difficulties (Barker and Duhaime, 1997; Hoffman, 1989). Learning tensions thus emerge in corporate turnarounds through competing learning efforts focused on either stability/efficiency or change/innovation.
Organizing tensions surface when complex systems create competing structures and
processes to achieve desired outcomes (Denison et al., 1995). They include control-flexibility and centralization–decentralization tensions (Lewis, 2000). During corporate turnarounds, such tensions arise from retrenchment and recovery’s contradictory organi-zational requirements. Turnaround scholars describe retrenchment as going hand-in-hand with a ‘mechanistic shift’ that is characterized by an increase in managerial involvement in decision processes, restricted internal communication, and tighter resource control (Barker and Mone, 1998; Musteen et al., 2011). While such an organi-zational context may be conducive to retrenchment, it is harmful to recovery. Mecha-nistic firms have difficulties changing their strategic orientation, because top managers restrict their information channels (Barker and Mone, 1998; Cameron et al., 1987). Recovery requires organic structures that allow the decentralization, employee involve-ment, and organizational flexibility needed for innovation and change (Arogyaswamy et al., 1995). Organizing tensions thus arise in turnarounds from competing organizing efforts focused on either control/centralization or flexibility/decentralization.
Performing tensionsstem from the plurality of stakeholders and their conflicting demands (Donaldson and Preston, 1995). They include competing objectives such as efficiency vs. effectiveness and short-term vs. long-term performance (Smith and Lewis, 2011). During corporate turnarounds, such tensions arise from retrenchment and recovery objectives’ varying attractiveness for internal and external stakeholders. In the face of decline, external stakeholders – such as shareholders and banks – seek short-term improvements to protect their investments (Khandwalla, 1983). Since favourable relationships with external stakeholders are critical for survival (Chen and Hambrick, 2012), turnaround firms have a strong motive to rely on retrenchment, which provides more immediate performance results (Bibeault, 1982). Conversely, internal stakeholders – such as employ-ees – consider retrenchment a short-term solution that fails to address the real causes of decline, leading to reduced employee commitment (Schmitt et al., 2012) and the loss of talented employees (Trevor and Nyberg, 2008). Employees prefer a recovery plan that details the strategic changes required to ensure the firm’s long-term survival (Arogyaswamy et al., 1995). Performing tensions thus emerge in turnarounds through competing objectives focused on either efficiency/short-term or effectiveness/long-term performance.
contradicting tensions by choosing one agenda over the other (Lewis, 2000). Such commitments are reinforced by organizational dynamics that embed inertia in struc-tures, routines, processes, and capabilities (Gilbert, 2005; Smith and Lewis, 2011). Accordingly, the sequential perspective of corporate turnarounds suggests that firms resolve retrenchment–recovery tensions by addressing only one of these activities at a time (e.g. Bruton et al., 2003; Robbins and Pearce, 1992). However, these studies may underestimate the self-reinforcing nature of turnaround firms’ initial choices. As Walrave et al. (2011) illustrate, turnaround managers may become increasingly aware of their one-sided strategies’ limitations, but they are still unable to shift their attention to alternative demands. The initial failure to consider opposing requirements makes the tensions more salient, which induces even greater stress and anxiety. Such a context not only impairs managerial decision making, but also makes it more difficult to search for alternative courses of action (Barker and Mone, 1994). In such situations, turnaround firms may be caught in downward spirals (Hambrick and D’Aveni, 1988).
AN ALTERNATIVE VIEW: RETRENCHMENT AND RECOVERY AS A DUALITY
In recent years, paradox research has shifted its attention to an alternative perspective that no longer sees contrasting elements as separate, but as fundamentally interdepend-ent and potinterdepend-entially compatible (Smith and Lewis, 2011). In this ‘duality’ perspective (Farjoun, 2010), the integration of contradictory elements is more important than seg-regated efforts targeted at one or the other. Managers accept the interrelations between the opposites and adopt creative strategies to benefit from their mutually enabling qualities (Smith and Lewis, 2011).
While most turnaround scholars focus on retrenchment–recovery tensions, some have argued that integrating the two activities can also create benefits (e.g. Pajunen, 2005). Whereas the turnaround literature did not explore these interrelations further, the discussion of the exploitation–exploration duality in the paradox literature (e.g. Andriopoulos and Lewis, 2009; Farjoun, 2010; Smith and Lewis, 2011) has brought rich insights into the interrelations between opposing poles. Turnaround scholars have started to relate the exploitation–exploration duality to retrenchment and recovery (Lohrke et al., 2012; Walrave et al., 2011). We thus draw on insights into the exploitation–exploration duality to explore how retrenchment and recovery activities are interrelated and how their interaction relates to turnaround performance.
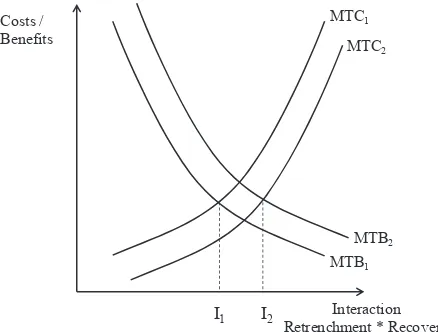
turnaround strategies. The optimum interaction level between retrenchment and recov-ery is therefore achieved at I2where the MTB are equal to the MTC.
So far, our model only assumes that there are movements along the benefit and cost curves. This static picture does not yet reflect the dynamic nature of real-life activities ( Jones and Hill, 1989). During turnarounds, managerial activities can shift the benefit (MTB) and cost (MTC) curves, which creates a new optimum level of interaction between retrenchment and recovery (see Figure 3). Turnaround managers can use paradoxical thinking to employ creative strategies that increase the benefits (from MTB1 to MTB2) and reduce the costs (from MTC1to MTC2) of integrating retrenchment and recovery. Paradoxical thinking recognizes and accepts existing tensions between oppos-ing strategies (Luscher and Lewis, 2008), leadoppos-ing to counterfactual thinkoppos-ing and double-loop learning (Farjoun, 2010). These acceptance and resolution strategies (Smith and
Costs / Benefits
Interaction Retrenchment * Recovery
MTC
MTB
I1 I2 I3
Figure 2. Static view of marginal turnaround benefits and costs
Costs / Benefits
Interaction Retrenchment * Recovery
MTC1
I1 I2
MTC2
MTB1 MTB2
Lewis, 2011) contribute to a shift in the optimum level of interaction between retrench-ment and recovery (from I1 to I2). We now explore the learning, organizing, and performing strategies that enable turnaround managers to strengthen the complemen-tarities between retrenchment and recovery while reducing their underlying tensions.
Learning complementaritiesstem from focus and experimentation strategies. While focus is a variance-reducing practice that supports exploitation, it can also enable exploration by freeing up scarce resources, setting clear priorities, and ensuring coherence between varied efforts (Andriopoulos and Lewis, 2009). During turnarounds, focused retrench-ment allows firms to free up redundant resources (Castrogiovanni and Bruton, 2000), while ensuring that they retain those resources that are critical to generate and absorb new knowledge during recovery (Morrow et al., 2004). Conversely, experimentation is a variance-increasing practice through which firms explore, but it can also help them regain stability (Farjoun, 2010). In turnarounds, experimentation has been related to recovery (Barker and Barr, 2002), but it can also contribute to retrenchment as it allows firms to learn how to do the same work with fewer resources. Lohrke et al. (2012) argue that retrenchment requires trial-and-error learning. Studies show that turnaround man-agers hold periodic staff meetings to find imaginative solutions to retrenchment chal-lenges (Martin and Kimberly, 2008; Pajunen, 2006). Overall, focus and experimentation may enable turnaround firms to increase the benefits (from MTB1to MTB2) and reduce the costs (from MTC1to MTC2) of integrating retrenchment and recovery.
Organizing complementaritiesarise from formalization and participation strategies. For-malization is not only associated with exploitation (March, 1991), but is also conducive to exploration (Farjoun, 2010) because it stimulates knowledge sharing (Baum and Wally, 2003) and provides guidance for non-routine activities (Dougherty, 2006). In a turnaround context, formalization fosters retrenchment by ensuring tighter resource control (Hoffman, 1989), but it can also help define expectations and ensure organiza-tional commitment to recovery objectives (Lamberg and Pajunen, 2005; Simons, 1994). Conversely, participative settings not only enable exploration (Kang and Snell, 2009), but ensure employees’ cooperation and mutual trust in exploitation activities (Adler et al., 2009). During turnarounds, participatory management has particularly strong effects since the norms of respectful interaction provide employees with the resilience required in a decline situation (Barker and Mone, 1998). This applies to involving employees in recovery activities (Arogyaswamy et al., 1995), but also to motivating them to become more rigorous when utilizing resources during retrenchment (Beeri, 2012; Boyne, 2006). Overall, formalization and participation may thus enable turnaround firms to increase the benefits and reduce the costs of integrating retrenchment and recovery.
Performing complementaritiessurface when managers combine profit and breakthrough
explora-tion, but they can also help build the motivation and morale to ensure stakeholders’ commitment to short-term profit goals (Andriopoulos and Lewis, 2009). For instance, turnaround firms are more likely to gain stakeholders’ support for retrenchment if they perceive these activities as leading to long-term recovery (Arogyaswamy et al., 1995). Presenting a detailed recovery plan can thus convince stakeholders of the firm’s long-term potential for breakthroughs, which will help ensure their support for short-long-term retrenchment measures (Morrow et al., 2007). Overall, profit and breakthroughs may thus enable turnaround firms to increase the benefits and reduce the costs of integrating retrenchment and recovery.
Managing turnaround complementarities. Our discussion shows that turnaround managers can refer to learning, organizing, and performing strategies to shift the benefit and cost curves of integrating retrenchment and recovery during corporate turnarounds. As Walrave et al. (2011) argue, such integrative measures can only be successful if they are constantly maintained throughout all stages of the turnaround process. Consequently, the initial optimum for the retrenchment–recovery interaction (I1) is only a short-run equilibrium. In reality, the optimal level of interaction is dynamic and characterized by adjustment processes that lead from one short-run equilibrium to another ( Jones and Hill, 1989). During corporate turnarounds, firms find themselves in a continual state of flux under which the above-mentioned benefit and cost drivers change for better or worse. Turnaround managers who are aware of the retrenchment–recovery interrela-tions can rely on the above-described strategies to increase the benefits and reduce the costs of integrating the two activities. Such an approach is likely to reduce the well-documented problems of impaired decision-making and the resulting stress and anxiety during corporate turnarounds (Hambrick and D’Aveni, 1988). We thus argue that an integrative approach to corporate turnarounds is positively associated with turnaround performance.
Hypothesis: Throughout the corporate turnaround process, the interaction of retrench-ment and recovery is positively related to turnaround performance.
METHOD
Research Setting
2002). While a similar approach based on consultants was recently used in acquisition studies (Zollo and Meier, 2008), this approach is novel in corporate turnaround research. Turnaround consultants are particularly resourceful informants for a number of reasons. First, since they contribute their rich expertise to analyse problems, recommend solutions, and support their implementation, they are particularly insightful informants (Bergh and Gibbons, 2011) who have strong social relations with management (McKenna, 2006). Second, consultants gain experience in different companies, indus-tries, and counindus-tries, and can therefore benchmark their assessments more accurately than the average manager can. Third, consultants’ responses are likely to be less biased regarding socially desirable elements (i.e. performance), since they are not directly responsible for an initiative’s success (Zollo and Meier, 2008). Fourth, consultants may be a better source of information than turnaround managers, as there are frequent leader-ship changes during corporate turnarounds (Bibeault, 1982). Finally, consultants are generally more objective and open than turnaround managers, who face the risk of civil and criminal liabilities. While the use of consultants may have its limitations, such as their tendency to favour the client and their reduced responsibility regarding implementing their advice (Delany, 1995; Zollo and Meier, 2008), we believe that the arguments above sufficiently justify our contention that using them has considerable advantages.
Sample Construction
Owing to a need for market similarities with regard to language, culture, and legal regulations, our study focused on Central Europe (Austria, Germany, and Switzerland). In this German-speaking region, companies in distress are restructured in one of two ways, namely out-of-court turnarounds and in-court bankruptcy proceedings (Davydenko and Franks, 2008; Fruhan, 2009). Out-of-court turnarounds are undertaken if firms have a chance of long-term viability and do not face immediate insolvency. The troubled firm’s main bank usually accepts responsibility for the turnaround and assures objectivity regarding the firm’s turnaround viability. During turnarounds, it is common practice to use external turnaround consultants’ analytical reports to limit the bank’s legal responsibilities in case of insolvency.
According to the European Federation of Management Consultancies (FEACO), the Central European region employs 26.2 per cent of Europe’s consulting professionals and represents 31.2 per cent of the European consulting markets’ revenues. Given that there is no listing of all the consulting firms in this region, we screened the most relevant databases. We relied on databases provided by the Austrian Federal Economic Chamber, the Association of German Consultants (BDU), and the Association of Swiss Consultants (ASCO) and searched for consulting firms by using the search criteria ‘turnaround’. We then studied the consulting firms’ websites and annual reports to ensure that they were engaged in substantial turnaround consulting services. Finally, we discussed the resulting list with industry experts. This procedure led to a total population of 136 Central European turnaround consulting firms (38 Austrian, 75 German, and 23 Swiss).
filters. This reduced the sample from 136 to 109 firms, of which 33 (or 30.3 per cent) agreed to participate in the study. We found no systematic pattern regarding consulting firms declining to participate. The top three reasons for non-participation were: (1) corporate policies against participating in research projects; (2) a lack of time and resources to participate; and (3) a lack of interest in the study topic. To test for non-response bias, we compared the responding and non-responding consulting firms. Given that size or scale is an important criterion for differentiation in the consulting industry (Bergh and Gibbons, 2011), we compared observable firm size characteristics from archival sources. T-tests showed no significant differences between the participating and non-participating firms. Our sample of consulting firms reflects the European consulting industry’s structure with its mix of large (27.3 per cent), medium-sized (21.2 per cent), and small (51.5 per cent) firms. Overall, our sample included 12 Austrian, 14 German, and 7 Swiss consulting firms.
In phone interviews with the participating firms’ main contact persons, we explained the study’s interest in analysing out-of-court turnaround initiatives. We also explained that we sought to study initiatives initiated between 2003 and 2004, that it was important that the consulting firm had been engaged throughout the project, and that the turna-round had had to be completed at the time of inquiry. While this approach excluded firms whose turnaround initiatives failed in the process, it matches our main research interests of exploring interrelated turnaround activities throughout the entire turnaround process and analysing how these activities relate to relative differences in turnaround performance.
We ensured that the initiatives were comparable by collecting financial data on the turnaround situation. Prior research suggests that turnaround initiatives should be selected by following a four-year period comprising two years of positive return on investment (ROI) and two years of an average pre-tax ROI below 10 per cent (Barker and Mone, 1994). While these selection criteria were reflected in our sample, we also ensured that the firms had experienced negative return on assets (ROA), as well as an absolute and a relative-to-industry decline over two years. Our main contact persons identified 121 turnaround initiatives that fulfilled our selection criteria.
Data Collection
acquisition (Barker and Mone, 1998). The most cited studies have sample sizes of 54 (Schendel et al., 1976), 32 (Barker and Mone, 1994; Robbins and Pearce, 1992), and 38 (Barker and Duhaime, 1997). Our study’s sample size of 107 is strong since it is two to three times larger than those of many other empirical studies in the field.
Our final sample included 27 Austrian (25.2 per cent), 64 German (59.8 per cent), and 16 Swiss (15.0 per cent) turnaround initiatives. Of these turnaround initiatives, 28 occurred in public (26.2 per cent) and 79 in private companies (73.8 per cent). There were 72 turnaround initiatives in manufacturing firms (67.3 per cent) and 35 in service firms (32.7 per cent). On average, the firms employed 1210 people. Sixteen turnaround initiatives (15.0 per cent) had been conducted in growing industry environments, 79 in mature industry environments (73.8 per cent), and 12 in declining industry environments (11.2 per cent).
We applied Huber and Power’s (1985) guidelines to control for potential informant biases. First, we assured and controlled the key informants’ suitability to answer our questionnaire. The 107 consultants of our sample had an average consulting experience of 8.8 years and an average tenure of 5.9 years at their consulting firm. Second, we ensured that the informants had a certain level of emotional involvement with the turnaround projects by asking them to describe a project in which they had actively participated. Third, we attempted to motivate the informants to participate by outlining the benefits of our study, promising confidentiality, specifying the time required to complete the questionnaire, and offering to share the study’s results. We pre-tested our questionnaire to ensure that our questions were well structured and understandable.
Further, to minimize concerns about retrospective data collection (Golden, 1992), we tested and found no significant difference between the responses of those who had returned our questionnaire immediately and late. We also ensured that our respondents relate their responses to a concrete turnaround project in which they had been involved as a project manager, which ensured that they were familiar with all aspects of the turnaround approach. Given that consulting firms constantly document their turna-round efforts to limit their legal responsibility, we believe that retrospective bias has been minimized. To minimize concerns about self-selection bias, we searched the Bloomberg® database and identified 36 firms in distress and compared them to our sample compa-nies. The comparison group’s firm-specific characteristics showed no significant differ-ences with our participating firms in terms of their total assets (p=0.31), employees (p=0.51), sales (p=0.33), and ROA (p=0.23).
variables were then loaded on one factor to examine the fit of the confirmatory factor analysis model (CFA) (Korsgaard and Roberson, 1995). The one-factor CFA model indicated a poor overall fit (c2(324)=1196.5, p<0.001; CFI=0.46, SRMR=0.16, and RMSEA=0.16). Thus, none of the three tests provided any indication of common method bias in our data.
Measurements
Researchers (e.g. Pearce and Robbins, 1993) suggest the identification of distinct stages – by including an intermediate observation point – when measuring turnaround activi-ties. Hence, we pre-defined two turnaround stages. We defined the initial stage as lasting from the beginning of the turnaround project until the year of the sharpest absolute decline in the ROI (Robbins and Pearce, 1992) and the advanced stage as lasting from this transition point to the end of the turnaround project.
Dependent variable. We used subjective measures to evaluate the turnaround performance. Self-reported formats are appropriate when there are difficulties with obtaining access to objective measures (Dess and Robinson, 1984). Since we included privately held firms in our sample, we did not have access to objective performance data. As in previous studies (Morrow et al., 2004; Robbins and Pearce, 1992), the respondents indicated the net change in performance from the start of the turnaround process to its completion. To account for industry effects (Barker and Mone, 1994; Pearce and Robbins, 1993), the respondents were asked to evaluate the performance in relation to the industry averages. We relied on four previously used accounting measures: (1) sales, (2) market share, (3) ROI, and (4) ROA (e.g. Meeks and Meeks, 1981). We further asked the respondents to provide (5) their general opinion of the turnaround firm’s overall performance improve-ment (Datta, 1991).
Independent variables. We applied Michael and Robbins’ (1998) established measures for
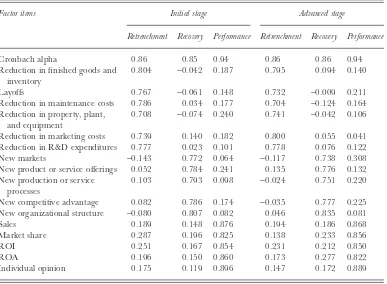
retrenchmentactivities. We measured retrenchment by means of: (1) the reduction in the finished goods and inventory, (2) employee layoffs, (3) the reduction in maintenance costs, (4) the reduction in property, plants, and equipment, (5) the reduction in marketing costs, and (6) the reduction in R&D expenditures. These items were assessed on a Likert-type response scale (ranging from 1: ‘given low priority’ to 7: ‘given high priority’) and measured in respect of each turnaround stage (‘initial stage’/‘advanced stage’: a =0.86/0.86). Similarly, the recovery activities were measured by a total of five items (‘initial stage’/‘advanced stage’: a =0.85/0.86) adapted from Robbins and Pearce (1992). The respondents specified the recovery activities regarding (1) new markets, (2) new product or service offerings, (3) new production or service processes, (4) new competitive advantages, and (5) new organizational structures.
CFI=0.99, SRMR=0.05, RMSEA=0.02; ‘advanced stage’: c2(101)=159.7, p<0.001, CFI=0.96, SRMR=0.07, RMSEA=0.04).
Control variables. We included several control variables to mitigate potential misinterpre-tations of turnaround activities and performance. First, turnaround research (e.g. Schendel et al., 1976) has postulated that the severity of a decline may affect the choice of different turnaround activities and how they relate to turnaround performance. In line with prior turnaround research (Chen and Hambrick, 2012; McClelland et al., 2010), we measured theseverity of declinewith a short-term liquidity ratio (the quick ratio=[current assets-inventory]/current liabilities) and a long-term leverage ratio ([total debt/total assets]¥100).
Second, scholars (e.g. Barker and Duhaime, 1997; Hofer, 1980) have argued that firms’ turnaround strategies and their performance effects are contingent on the reasons for the firm’s decline. These causes of decline have been commonly dichotomized into internal and external factors (Filatotchev and Toms, 2006; Pajunen, 2005). We thus controlled for the cause of decline and applied Robbins and Pearce’s (1992) seven-point scale (1: ‘completely insignificant’ to 7: ‘greatest significance’) to measure the relative
Table I. Factor analysis for retrenchment, recovery, and turnaround performance
Factor items Initial stage Advanced stage
Retrenchment Recovery Performance Retrenchment Recovery Performance
Cronbach alpha 0.86 0.85 0.94 0.86 0.86 0.94
Reduction in finished goods and inventory
0.804 -0.042 0.187 0.795 0.094 0.140
Layoffs 0.767 -0.061 0.148 0.732 -0.009 0.211
Reduction in maintenance costs 0.786 0.034 0.177 0.704 -0.124 0.164 Reduction in property, plant,
and equipment
0.708 -0.074 0.240 0.741 -0.042 0.106
Reduction in marketing costs 0.739 0.140 0.182 0.800 0.055 0.041 Reduction in R&D expenditures 0.777 0.023 0.101 0.778 0.076 0.122
New markets -0.143 0.772 0.064 -0.117 0.738 0.308
New product or service offerings 0.052 0.784 0.241 0.135 0.776 0.132 New production or service
processes
0.103 0.793 0.098 -0.024 0.751 0.220
New competitive advantage 0.082 0.786 0.174 -0.035 0.777 0.225 New organizational structure -0.080 0.807 0.082 0.046 0.835 0.081
Sales 0.189 0.148 0.876 0.194 0.186 0.868
Market share 0.287 0.196 0.825 0.138 0.233 0.856
ROI 0.251 0.167 0.854 0.231 0.212 0.850
ROA 0.196 0.150 0.860 0.173 0.277 0.822
Individual opinion 0.175 0.119 0.896 0.147 0.172 0.889
Notes:
impact of four external causes (economic problems, competitive change, technological change, social change) and four internal causes (lack of operating controls, overexpan-sion, excessive leverage, top management).
Third, scholars have found that firm size can influence turnaround firms’ ability to implement different turnaround strategies (Boyne and Meier, 2009) and, ultimately, affect their turnaround performance (e.g. Bruton et al., 2003; McClelland et al., 2010). We measuredfirm size by means of the natural logarithm of the firm’s total number of employees to correct skewed distributions (McClelland et al., 2010).
Fourth, turnaround research (Morrow et al., 2004; Ndofor et al., 2013) argues that a firm’s specific industry environment may determine the turnaround strategies’ effective-ness. We therefore controlled for the firm’sindustry environmentby using its main industries’ average market growth rate over the six years prior to the turnaround (Morrow et al., 2004). This control variable was coded ‘0’ to indicate growth industries (>10 per cent average market growth rate), ‘1’ to indicate mature industries (0–10 per cent), and ‘2’ to indicate declining industries (<0 per cent).
Finally, we included a dummy variable consulting firm that controlled for specific consulting firm characteristics that may have affected the turnaround response.
ANALYSIS AND RESULTS
We used hierarchical (step-wise) regression analysis to test our hypotheses. Our study aims at analysing the retrenchment–recovery interaction throughout all stages of the turnaround process. Consequently, we added a dummy variable for the turnaround stage (1=advanced stage; 0=initial stage) to our regressions as an interaction term. Further, we examined theinteraction effectsbetween retrenchment and recovery by means of the multiplication of the retrenchment and recovery scores. Prior to the creation of the interaction term, we mean-centred the variables (Aiken and West, 1991). Similar pro-cedures have been applied in the related discussion on the exploration–exploitation duality (e.g. He and Wong, 2004; Jansen et al., 2012).
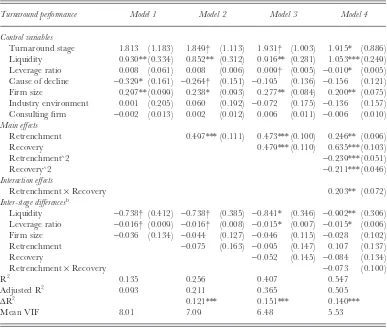
Table II presents the descriptive statistics and correlations of the study’s variables. Table III presents the regression results of turnaround performance. While the baseline model shows the control variables, model 2 introduces the retrenchment construct, and model 3 the recovery construct. The interaction effect between retrenchment and recov-ery is added in model 4. The variance inflation factors (VIF) remain below the generally accepted cut-off levels, indicating no problems of multicollinearity (Neter et al., 1985).
Model 1 indicates that the control variables liquidity (b=0.93, p<0.01) and firm size (b=0.30, p<0.01) have a significant and positive effect on turnaround performance, whereas cause of decline (b= -0.33, p<0.05) has a significant and negative effect. In model 2, the control variables liquidity (b=0.85, p<0.01) and firm size (b=0.24, p<0.05) remain significant and have a positive effect on turnaround performance. Retrenchment has a significant and positive effect on performance (b=0.50, p<0.001). The inter-stage difference regarding retrenchment’s effect on turnaround performance remains insignificant (b= -0.08, p>0.05).
Table II. Means, standard deviations, and correlationsa
Mean SD (1) (2) (3) (4) (5) (6) (7) (8) (9)
Initial stage
(1) Retrenchment 4.51 1.25 (0.86)
(2) Recovery 3.05 1.15 0.05 (0.85)
(3) Turnaround performance 4.91 1.59 0.45*** 0.33*** (0.94)
(4) Liquidity ratio 0.96 0.66 0.07 -0.01 0.23* /
(5) Leverage ratio 59.10 36.01 -0.05 -0.02 -0.08 -0.74*** /
(6) Cause of decline 1.19 0.67 -0.09 -0.07 -0.12 -0.03 -0.04 /
(7) Firm sizeb 6.08 1.53 0.11
-0.12 0.24* -0.11 0.08 0.10 /
(8) Industry environment 0.96 0.51 -0.01 0.26** 0.01 -0.07 0.07 -0.02 0.06 /
(9) Consulting firm 18.15 8.46 -0.05 0.05 0.09 -0.03 0.03 -0.22* 0.24* 0.13 /
Advanced stage
(1) Retrenchment 3.57 1.17 (0.86)
(2) Recovery 4.03 1.32 0.06 (0.86)
(3) Turnaround performance 4.91 1.59 0.35*** 0.46*** (0.94)
(4) Liquidity ratio 1.01 0.77 0.08 0.12 0.15 /
(5) Leverage ratio 47.47 29.74 -0.05 -0.13 -0.18* -0.60*** /
(6) Cause of decline 1.19 0.67 0.01 -0.08 -0.12 -0.05 0.05 /
(7) Firm sizeb 5.86 1.57 0.17 -0.10 0.21* -0.15 0.07 0.11 /
(8) Industry environment 0.96 0.51 -0.10 -0.05 0.01 -0.04 -0.02 -0.02 0.08 /
(9) Consulting firm 18.15 8.46 0.05 -0.12 0.09 0.11 -0.22* -0.23* 0.22* 0.13 /
Notes:
an=107. Numbers in parentheses on the diagonal are Cronbach’s alphas of the composite scales. bLogarithm of the number of employees.
* p<0.05; ** p<0.01; *** p<0.001.
A.
Schmitt
and
S.
Raisch
John
Wiley
&
Sons
Ltd
and
Society
for
the
Advancement
of
Management
Retrenchment (b=0.47, p<0.001) and recovery (b=0.48, p<0.001) have significant and positive effects on turnaround performance. The inter-stage difference regarding retrenchment’s (b= -0.10, p>0.05) and recovery’s (b= -0.05, p>0.05) effect on turna-round performance remains insignificant.
Model 4 indicates that liquidity (b=1.05, p<0.001) and firm size (b=0.20, p<0.01) have a significant and positive effect on turnaround performance, whereas leverage ratio (b= -0.01, p<0.05) has a significant and negative effect. The interaction between retrenchment and recovery has the proposed positive effect on turnaround performance (b=0.20, p<0.01), thus supporting our Hypothesis. The inter-stage difference regard-ing the retrenchment–recovery interaction’s effect on turnaround performance remains insignificant (b= -0.07, p>0.05).
We conducted several analyses to challenge the robustness of our empirical findings. In line with Edwards (2008), we assessed whether the hypothesized relationship between
Table III. Effects of retrenchment and recovery on turnaround performancea
Turnaround performance Model 1 Model 2 Model 3 Model 4
Control variables
Turnaround stage 1.813 (1.183) 1.849† (1.113) 1.931† (1.003) 1.915* (0.886) Liquidity 0.930** (0.334) 0.852** (0.312) 0.916** (0.281) 1.053*** (0.249) Leverage ratio 0.008 (0.061) 0.008 (0.006) 0.009† (0.005) -0.010* (0.005) Cause of decline -0.329* (0.161) -0.264† (0.151) -0.195 (0.136) -0.156 (0.121) Firm size 0.297** (0.099) 0.238* (0.093) 0.277** (0.084) 0.200** (0.075) Industry environment 0.001 (0.205) 0.060 (0.192) -0.072 (0.175) -0.136 (0.157) Consulting firm -0.002 (0.013) 0.002 (0.012) 0.006 (0.011) -0.006 (0.010) Main effects
Retrenchment 0.497*** (0.111) 0.473*** (0.100) 0.246** (0.096)
Recovery 0.479*** (0.110) 0.635*** (0.103)
Retrenchment∧2 -0.239*** (0.051)
Recovery∧2 -0.211*** (0.046)
Interaction effects
Retrenchment¥Recovery 0.203** (0.072)
Inter-stage differencesb
Liquidity -0.738† (0.412) -0.738† (0.385) -0.841* (0.346) -0.902** (0.306) Leverage ratio -0.016† (0.009) -0.016† (0.008) -0.015* (0.007) -0.015* (0.006) Firm size -0.036 (0.134) -0.044 (0.127) -0.046 (0.115) -0.028 (0.102)
Retrenchment -0.075 (0.163) -0.095 (0.147) 0.107 (0.137)
Recovery -0.052 (0.145) -0.084 (0.134)
Retrenchment¥Recovery -0.073 (0.100)
R2 0.135 0.256 0.407 0.547
Adjusted R2 0.093 0.211 0.365 0.505
DR2 0.121*** 0.151*** 0.140***
Mean VIF 8.01 7.09 6.48 5.53
Notes:
an=214. Values are unstandardized regression coefficients (standard errors in parentheses). bInteractions with turnaround stage.
our variables in model 4 is a linear or non-linear relationship. Including curvilinearity tests allows researchers to make a more fine-grained distinction regarding whether ‘the relationship between X and Y is linear . . . [or] make the more modest claim that higher values of X are associated with higher values of Y’ (Edwards, 2008, p. 153). The squared effects of retrenchment (b= -0.24, p<0.001) and recovery (b= -0.21, p<0.001) indi-cate a curvilinear relationship of retrenchment and recovery with turnaround perform-ance and confirm the retrenchment–recovery interaction’s positive and non-linear relationship with turnaround performance (Ganzach, 1997).
Moreover, we examined whether our results hold across different turnaround situa-tions. Prior studies (e.g. Barker and Duhaime, 1997; Morrow et al., 2004) proposed a contingency perspective of corporate turnarounds in which the choice of retrenchment and recovery activities depends on the severity and the cause of the decline. Similarly, our initial analyses had indicated that these control variables might have a significant effect. We therefore tested our results for distinct severity (high vs. low severity; median cut-off) and cause of decline situations (firms primarily facing internal problems vs. those primarily facing external causes).
As indicated in Table IV, the interaction effect of retrenchment and recovery holds for alternative causes of decline (external: b=0.43, p<0.01; internal: b=0.24, p<0.01). Our results indicate that retrenchment plays a non-significant role in turnarounds characterized by external decline situations (b= -0.39, p>0.10). Further, we found that the severity of decline affects our findings significantly. For turnaround firms facing high severity decline situations, retrenchment (b=0.32, p<0.05) and recovery (b=0.54, p<0.01) are both positively associated with turnaround performance, but the interaction term is insignificant. Conversely, the interaction effect is significant under conditions of low severity (b=0.36, p<0.01) and retrenchment plays a less significant role in these turnaround situations (b=0.25, p<0.10).
Finally, we controlled for distinct types of retrenchment (Morrow et al., 2004) by separately calculating the net reductions in total costs (Barker and Mone, 1994) and total assets (Robbins and Pearce, 1992). Further, we included dummy variables for manufac-turing and service companies (O’Neill, 1981), as well as for the three countries in our sample (Bruton et al., 2003). None of these additional control variables had a significant effect.
DISCUSSION
Turnaround performance Severity of decline Cause of decline
Low severity High severity External causes Internal causes
Model 1 Model 2 Model 3 Model 4 Model 5 Model 6 Model 7 Model 8
Control variables
Turnaround stage 2.74 (1.898) 1.742 (1.568) 0.635 (1.546) 0.688 (1.214) 2.090 (2.133) 1.387 (2.371) 1.169 (1.420) 0.692 (1.030) Liquidity 1.313* (0.538) 0.947* (0.397) 0.754 (0.532) 1.382** (0.043) 0.244 (0.612) 0.749 (0.637) 1.077** (0.391) 0.956*** (0.268) Leverage ratio -0.002 (0.011) -0.006 (0.008) 0.005 (0.007) 0.014* (0.006) 0.006 (0.112) 0.001 (0.012) 0.010 (0.007) 0.008 (0.005) Cause of decline -0.508* (0.235) -0.275 (0.173) -0.147 (0.220) -0.0101 (0.167) -0.625 (0.683) -0.214 (0.729) -0.269 (0.191) -0.155 (0.131)
Firm size 0.221 (0.180) 0.136 (0.136) 0.332** (0.115) 0.181* (0.092) 0.199 (0.168) 0.011 (0.174) 0.308* (0.120) 0.189* (0.086)
Industry environment 0.419 (0.295) 0.052 (0.228) -0.406 (0.304) -0.154 (0.241) -0.288 (0.321) 0.383 (0.325) -0.19 (0.256) -0.292† (0.181) Consulting firm -0.026 (0.021) -0.027† (0.152) 0.006 (0.019) -0.004 (0.014) -0.056* (0.023) -0.032 (0.027) -0.016 (0.016) -0.001 (0.011) Main effects
Retrenchment 0.247† (0.152) 0.321* (0.163) -0.390 (0.299) 0.339** (0.112)
Recovery 0.636*** (0.167) 0.541** (0.157) 0.456* (0.214) 0.609*** (0.119)
Retrenchment∧2 -0.339*** (0.094) -0.356** (0.112) -0.462* (0.218) -0.347*** (0.073)
Recovery∧2 0.127 (0.119) -0.210† (0.125) 0.036 (0.160) 0.116 (0.098)
Interaction effects
Retrenchment¥Recovery 0.362** (0.167) 0.125 (0.103) 0.430** (0.145) 0.236** (0.085)
Inter-stage differencesb
Liquidity -1.102† (0.616) -0.792† (0.458) -0.060 (0.105) -0.905† (0.519) -0.558 (0.719) -1.000 (0.759) -0.551 (0.493) -0.557† (0.337)
Leverage ratio -0.022 -0.014 -0.001 -0.006 -0.021 -0.017 -0.013 -0.010
Notes:
aValues are unstandardized regression coefficients, with standard errors in parentheses. Models 1–4 show the result of firms facing high and low severity (median cut-off). Models 5–8 show the results of the
subset of 86 companies with mainly internal causes and 21 companies with mainly external causes.
bInteractions with turnaround stage.
†p<0.10;*p<0.05;**p<0.01;***p<0.001.
The
Duality
of
Retrenchment
and
Recovery
1235
©
2013
John
Wiley
&
Sons
Ltd
and
Society
for
the
Advancement
of
Management
A Duality Perspective of Corporate Turnarounds
Two competing theory perspectives have dominated the extant corporate turnaround literature: the threat-rigidity perspective (e.g. Barker and Mone, 1998; Sutton and D’Aunno, 1989) and the prospect theory perspective (e.g. Bolton, 1993; Hambrick and D’Aveni, 1988). Despite their unquestionable contributions, the two perspectives fail to provide an overarching theory framework (Lohrke et al., 2012), while defending their contradictory viewpoints on the ‘if’, the ‘when’, and the ‘how’ to implement retrench-ment and recovery during turnarounds (Barker and Mone, 1994; Robbins and Pearce, 1992). This paper extends the two theoretical perspectives and integrates them in an overarching duality framework. The recognition of this duality (Farjoun, 2010) is an important departure from prior studies since it shifts the field’s analytical focus from exploring retrenchment and recovery’s distinct causes and effects to clarifying their interrelations. While we acknowledge the tensions between retrenchment and recovery (e.g. Robbins and Pearce, 1992), our perspective highlights their mutually enabling qualities. In this perspective, turnaround success is a function of the firm’s ability to integrate contradictory, yet interrelated, retrenchment and recovery activities in corporate turnarounds.
The duality perspective opens up interesting avenues for future research. Most impor-tantly, future research could examine the boundary conditions under which our theo-retical framework applies. While our post-hoc analyses show that our assumptions hold for different causes of decline, the interaction effect between retrenchment and recovery vanished under conditions of a particularly severe decline. These findings indicate that firms struggle with the simultaneous management of retrenchment and recovery in situations of particularly severe resource scarcity (Barker and Duhaime, 1997), which cause high levels of managerial stress and anxiety (Barker and Mone, 1994). Future research should investigate whether firms experiencing particularly severe decline are better off by initially opting for a one-sided attention to retrenchment (Robbins and Pearce, 1992) to ‘stop the bleeding’ (Bibeault, 1982). These studies should prioritize objective measures of the causes and severity of decline (Robbins and Pearce, 1992), which will allow the turnaround firm’s key performance indicators (e.g. labour efficiency, ROA, R&D investment) to be compared with the industry mean values (Deephouse, 1996). Further, we relied on a sample of Central European firms that mostly operated in mature industry contexts. Prior studies have shown that industry conditions, regulatory contexts, and cultural environments can shape turnaround activities and influence their performance implications (e.g. Bruton et al., 2003; Morrow et al., 2004). We thus welcome comparative studies that empirically test elements of our theory across different institutional and cultural settings.
retro-spective biases (Golden, 1992). Future research should thus investigate whether the integration of retrenchment and recovery leads to virtuous cycles (Smith and Lewis, 2011) and how they unfold over time. Case study research combining in-depth field data with archival data (Hambrick and D’Aveni, 1988) could enable researchers to examine the decision-making processes at multiple points during corporate turnarounds.
The Interrelations between Retrenchment and Recovery
While prior turnaround research has developed multiple stage models (e.g. Chowdhury, 2002; Lohrke et al., 2012; Robbins and Pearce, 1992), we provide a more integrative conceptualization of corporate turnarounds. Previous stage models suggest that firms address retrenchment in the initial turnaround stage, while shifting their full attention to recovery in the advanced turnaround stage (Filatotchev and Toms, 2006). Conversely, we provide theoretical arguments and empirical evidence that retrenchment and recov-ery are positively associated with turnaround performance during both turnaround stages. Retrenchment acts as a resource provider in the initial turnaround stage (Pearce and Robbins, 2008), but it is also essential to regain stability in the face of strategic change in the advanced turnaround stage. While recovery drives strategic change in the advanced turnaround stage (Barker and Mone, 1994), it is also an important means to direct retrenchment in the initial turnaround stage. Our results thus suggest that retrenchment and recovery play a far more complex and dynamic role in corporate turnarounds than previously assumed. Rather than simply stating the simultaneous need for retrenchment and recovery, we further reveal the two turnaround activities’ complementarities.
An important question for future research concerns the optimum level of interaction between retrenchment and recovery. Previous research has stressed the tensions between retrenchment and recovery and the costs of their integration (Pearce and Robbins, 2008; Sheppard and Chowdhury, 2005). While our results show an overall positive association of the retrenchment–recovery interaction with turnaround performance, the negative squared effect of each turnaround strategy’s individual impact on performance indicates a curvilinear relationship. This indicates a certain threshold above which the perform-ance will not be further improved. Given that integrating contradictory tensions requires constant managerial attention and their acceptance that the tensions may never be fully resolved (Smith and Lewis, 2011), future studies may explore the optimum balance between retrenchment and recovery. For instance, future research could explore how turnaround firms assess, maintain, and shift their levels of integration between retrench-ment and recovery and how these activities relate to turnaround performance. In particular, it may be interesting to explore how turnaround managers combine integra-tive solutions (to benefit retrenchment and recovery’s mutually enabling qualities) with temporal separation (to avoid some of the two activities’ inherent tensions).
Morrow et al. (2004) show that asset retrenchment and cost retrenchment are either more or less beneficial for turnaround firms depending on their industry context. While our analyses indicate that our findings hold for both types of retrenchment, future research should explore the conditions under which different types of retrenchment activities are either more or less suitable for integration with recovery activities. Further, researchers could draw on insights from related, theoretically more advanced, literature debates. For example, DeWitt (1998) provides empirical evidence that different down-sizing approaches are a function of specific firm, industry, and strategy determinants. Moreover, Bergh et al. (2008) emphasize that different corporate restructuring activities’ influence on firm performance depends partly on how they are implemented. Lim et al. (2013) provide objective measures for asset and cost retrenchment and show that each type’s performance effects are contingent on a firm’s rent creation mechanism. We believe that expanding the turnaround literature’s theoretical bases to insights from these related literatures could further enrich the discussion and refine the current approaches’ perspectives.
Managing the Retrenchment–Recovery Interrelations
Corporate turnarounds are managerial responses to decline (Arogyaswamy et al., 1995) under conditions of high uncertainty and ambiguity (Rosenblatt et al., 1993). In this study, we provide the first theoretical arguments regarding how turnaround managers can approach the retrenchment–recovery duality through specific learning, organizing, and performing strategies. These strategies should help reduce the managerial stress (Ford and Baucus, 1987) and the related information processing problems (Staw et al., 1981) encountered in turnaround situations. Further, the strategies could contribute to greater strategic flexibility and the ‘dynamic managerial ability’ (Walrave et al., 2011) required to manage turnarounds.
Future studies should also explore the organizational contexts that enable turnaround managers to effectively integrate retrenchment and recovery. Prior turnaround research points to the crucial role of top management team processes (e.g. Barker et al., 2001), governance mechanisms (e.g. Filatotchev and Toms, 2006), human resource systems and processes (e.g. Boyne and Meier, 2009), and stakeholder relations (e.g. Pajunen, 2006). We need to know more about how these activities enable turnaround managers not only to engage in retrenchment and recovery, but also to simultaneously approach and integrate the two activities.
From a practitioner perspective, an important question relates to the particular quali-ties and capabiliquali-ties that turnaround managers need to successfully manage the retrenchment–recovery tensions. Are these similar to those required for managing sequential turnaround processes or do we need a new breed of turnaround managers? If turnaround success depends on integrating retrenchment and recovery, turnaround managers have to support these contradictory activities simultaneously. This requires awareness of tensions, as well as paradoxical thinking to view ‘tensions as an invitation for creativity and opportunity’ (Smith and Lewis, 2011, p. 391). Paradox studies show that the ability to attend to competing demands simultaneously requires managers with cognitive complexity (Smith and Tushman, 2005), behavioural complexity (Denison et al., 1995), and emotional equanimity (Lewis, 2000). While beyond the scope of this study, future turnaround studies could draw on these foundations to investigate the leadership characteristics and processes that enable managers to integrate retrenchment and recovery.
Contributions to the Paradox Literature
Our study also contributes to the paradox literature, especially to the emerging debate on dualities. To date, this debate has focused primarily on the exploitation–exploration duality (e.g. Farjoun, 2010; Smith and Lewis, 2011). Exploring a related duality in a corporate turnaround context is particularly interesting for paradox research, since turnaround firms are characterized by resource scarcity (Arogyaswamy et al., 1995). Prior paradox studies assumed that resource scarcity reinforces the oppositional and relational nature of dualities, which causes latent tensions to become salient (Smith and Tushman, 2005). Since the integration of contradictory activities implies the risk of falling short of both objectives, prior studies suggested that resource-scarce organizations may be better off by opting for either a focused orientation or by temporarily separating the contradictory tasks (Raisch and Birkinshaw, 2008).
Finally, we contribute to paradox research by clarifying the nature of the interrelations between opposing elements in dualistic relationships. While recent paradox studies stress the need to consider both contradictions and complementarities in paradoxical relation-ships (e.g. Smith and Lewis, 2011), this study offers one of the first integrated efforts to conceptualize, operationalize, and quantify such a relationship. Our empirical test of the retrenchment–recovery duality and its association with performance provides additional insights. While the duality’s interaction effect is positive, our empirical analysis indicates that the two opposing elements – retrenchment and recovery – have a curvilinear relationship with turnaround performance. This provides first empirical evidence sup-porting prior theoretical arguments (Cao et al., 2009) that dualities, due to their inherent contradictions, may force organizations to opt for moderate levels of the two opposing elements. Future paradox research could thus explore whether the relative attention that managers assign to one or the other end of the duality (e.g. retrenchment and recovery) shifts with changing internal and external requirements. For example, it may be that turnaround organizations, while integrating retrenchment and recovery at all times, engage in higher degrees of retrenchment in the early stages of the turnaround (when the severity of the decline is particularly high), but gradually shift to higher degrees of recovery in the later stages of turnaround (when the worst losses are over). Such a ‘shifting balance’ may enable organizations to focus the limited resources at their disposal to resolve the most pressing challenges at a given point in time, without entirely neglect-ing the opposneglect-ing elements.
Conclusion
Prior turnaround models have provided limited insight into different turnaround activi-ties’ interrelations during corporate turnarounds. In our study, we developed a duality perspective of corporate turnarounds. Based on an empirical study of 107 Central European turnaround initiatives, we showed that successful turnaround firms drive the complementarities between efficiency-oriented and innovation-stimulating activities. In times of increasing environmental turbulence and extended periods of global recession, these insights are of the utmost importance for firms’ long-term prosperity. It is our hope that this study will generate renewed interest in the complex interrelations between changing environmental conditions, corporate turnaround activities, and firm development.
ACKNOWLEDGMENTS
The authors are grateful to the Editor, Andrew Delios and three anonymous reviewers for constructive comments and feedback during the review process. We would like to thank Vincent L. Barker, Kathryn R. Harrigan, Patricia Klarner, Marianne Lewis, Gilbert Probst, Steffen Raub, and Stephane Rothen for their insightful comments on earlier versions of this paper. Parts of the data analysis were conducted during the first author’s stay at Columbia Business School, Columbia University, and supported by a scholarship from the Swiss National Science Foundation.
REFERENCES
Aiken, L. and West, S. (1991).Multiple Regression: Testing and Interpreting Interactions. Thousand Oaks, CA: Sage. Andriopoulos, C. and Lewis, M. (2009). ‘Exploitation–exploration tensions and organizational
ambidexter-ity: managing paradoxes of innovation’.Organization Science,20, 696–717.
Arogyaswamy, K., Barker, V. and Yasai-Ardekani, M. (1995). ‘Firm turnarounds: an integrative two-stage model’.Journal of Management Studies,32, 493–525.
Barker, V. and Barr, P. (2002). ‘Linking top manager attributions to strategic reorientation in declining firms attempting turnarounds’.Journal of Business Research,55, 963–79.
Barker, V. and Duhaime, I. (1997). ‘Strategic change in the turnaround process: theory and empirical evidence’.Strategic Management Journal,18, 13–38.
Barker, V. and Mone, M. (1994). ‘Retrenchment: cause of turnaround or consequence of decline?’.Strategic Management Journal,15, 395–405.
Barker, V. and Mone, M. (1998). ‘The mechanistic structure shift and strategic reorientation in declining firms attempting turnarounds’.Human Relations,51, 1227–58.
Barker, V., Patterson, P. and Mueller, G. (2001). ‘Organizational causes and strategic consequences of the extent of top management team replacement during turnaround attempts’.Journal of Management Studies,
38, 235–69.
Baum, J. and Wally, S. (2003). ‘Strategic decision speed and firm performance’.Strategic Management Journal,
24, 1107–29.
Beeri, I. (2012). ‘Turnaround management strategies in public systems: the impact on group-level organi-zational citizenship behavior’.International Review of Administrative Sciences,78, 158–79.
Bergh, D. and Gibbons, P. (2011). ‘The stock market reaction to the hiring of management consultants: a signalling theory approach’.Journal of Management Studies,48, 544–67.
Bergh, D., Johnson, R. and DeWitt, R. (2008). ‘Restructuring through spin-off or sell-off: transforming information asymmetries into financial gain’.Strategic Management Journal,29, 133–48.
Bibeault, D. (1982).Corporate Turnaround: How Managers Turn Losers into Winners. New York: McGraw-Hill. Bolton, M. (1993). ‘Organizational innovation and substandard performance: when is necessity the mother
of innovation?’.Organization Science,4, 57–75.
Boyne, G. (2006). ‘Strategies for organizational turnaround: lessons from the private sector?’.Administration and Society,38, 365–88.
Boyne, G. and Meier, K. (2009). ‘Environmental change, human resources and organizational turnaround’. Journal of Management Studies,46, 835–63.
Bruton, G., Ahlstrom, D. and Wan, J. (2003). ‘Turnaround in East Asian firms: evidence from ethnic overseas Chinese communities’.Strategic Management Journal,24, 519–40.
Cameron, K. (1986). ‘Effectiveness as paradox: consensus and conflict in conceptions of organizational effectiveness’.Management Science,32, 539–53.
Cameron, K., Kim, M. and Whetten, D. (1987). ‘Organizational effects of decline and turbulence’. Admin-istrative Science Quarterly,32, 222–40.
Cao, Q., Gedajlovic, E. and Zhang, H. (2009). ‘Unpacking organizational ambidexterity: dimensions, contingencies, and synergistic effects’.Organization Science,20, 781–96.
Carmeli, A. and Sheaffer, Z. (2009). ‘How leadership characteristics affect organizational decline and downsizing’.Journal of Business Ethics,85, 363–78.
Castrogiovanni, G. and Bruton, G. (2000). ‘Business turnaround processes following acquisitions: reconsid-ering the role of retrenchment’.Journal of Business Research,48, 25–34.
Chen, G. and Hambrick, D. (2012). ‘CEO replacement in turnaround situations: executive (mis)fit and its performance implications’.Organization Science,23, 225–43.
Chowdhury, S. (2002). ‘Turnarounds: a stage theory perspective’.Canadian Journal of Administrative Sciences,19, 249–66.
Cialdini, R., Trost, M. and Newsom, J. (1995). ‘Preference for consistency: the development of a valid measure and the discovery of surprising behavioral implications’.Journal of Personality and Social Psychol-ogy,69, 318–28.
Datta, D. K. (1991). ‘Organizational fit and acquisition performance: effects of post-acquisition integration’. Strategic Management Journal,12, 281–97.
Davydenko, S. and Franks, J. (2008). ‘Do bankruptcy codes matter? A study of defaults in France, Germany and the UK’.Journal of Finance,63, 565–608.
Deephouse, D. (1996). ‘Does isomorphism legitimate?’.Academy of Management Journal,39, 1024–39. Delany, E. (1995). ‘Strategy consultants – do they add value?’.Long Range Planning,28, 99–106.