1056
M
ALAYSIAN
J
OURNAL OF
A
NALYTICAL
S
CIENCES
Published by The Malaysian Analytical Sciences Society
APPLICATION OF EXCEL-VBA FOR COMPUTATION OF WATER
QUALITY INDEX AND AIR POLLUTANT INDEX
(Penggunaan Excel-VBA untuk Pengiraan Indeks Kualiti Air dan Indeks Pencemaran Udara)
Ismail Zainal Abidin, Hafizan Juahir*, Azman Azid, Ahmad Dasuki Mustafa,Fazureen Azaman
East Coast Environmental Research Institute (ESERI), Universiti Sultan Zainal Abidin,
Gong Badak Campus, 21300 Kuala Terengganu, Terengganu, Malaysia
*Corresponding author: [email protected]
Received: 14 April 2015; Accepted: 9 July 2015
Abstract
In Malaysia, there are two main indices which are Water Quality Index (WQI) and Air Pollutant Index (API). These indices are used as an indicator for the water quality and ambient air quality status of the environment. In conducting research regarding water and air quality, lots of time has been used to conduct other activities, an application to calculate the indices might come in handy. This project aims to construct an application for the computation of WQI and API using Visual Basic for Applications (VBA) available in Microsoft Excel. VBA is actually a programming language of Microsoft Excel and can be used to write programming and run through in an Excel workbook. The user only required to enter the value for each parameter and then press
“OK” to automatically calculate the index. This will provide instance result without wasting time just to refer to the class
standard and other formula. The application also has been used as a teaching tool for the secondary students. An environmental based race game called Young Environmental Scientist (YES) Explorace was conducted by Environmental East Coast Research Institute (ESERI) where secondary student are invited as the participant.The application not only provides early exposure to the environmental pollution, but also exposure to the application of computer sciences to the student.
Keywords: water quality index, air pollution index, visual basic application, environment, programming
Abstrak
Di Malaysia terdapat dua indek utama iaitu Indek Kualiti Air (IKA) dan Index Pencemar Udara (IPU). Indek ini digunakan sebagai penunjuk bagi status kualiti air dan udara alam sekitar. Ketika melakukan penyelidikan berkaitan kualiti air dan udara, banyak masa akan digunakan untuk melakukan aktiviti-aktiviti lain, satu applikasi untuk mengira kualiti indek pasti akan
membantu penyelidik. Projek ini bertujuan untuk mencipta satu aplikasi untuk pengiraan IKA dan IPU mengunakan “Visual
Basic for Application (VBA)” yang terdapat di dalam Microsoft Excel. VBA merupakan bahasa pemprograman di dalam
Microsoft Excel yang digunakan untuk mencipta applikasi dengan hanya menggunakan buku kerja Excel. Pengguna hanya perlu
memasukkan nilai untuk setiap parameter dan seterusnya menekan butang “OK” untuk mengira indek secara automatik. Ini akan
memberikan keputusan dengan pantas seterusnya mengelakkan masa terbuang dengan terpaksa merujuk kepada formula-formula. Aplikasi ini juga telah digunakan sebagai alat pembelajaran untuk pelajar sekolah menengah. Satu permainan eksplorasi yang dipanggil Eksplorasi Saintis Alam Sekitar Muda (YES) telah dilaksanakan oleh Institut Penyelidikan Alam Sekitar Pantai Timur (ESERI) di mana pelajar ini dijemput untuk menyertainya. Aplikasi ini bukan sahaja digunakan untuk memberikan pendedahan mengenai pencemaran alam sekitar, bahkan untuk memberi pendedahan mengenai sains komputer kepada pelajar terbabit.
Kata kunci: indeks kualiti air, indeks penemaran udara, applikasi visual asas, alam sekitar, pemprograman
1057
Introduction
Water plays an important role in human daily live as human use water for cooking, drinking, washing and also farming. Water quality can be thought as the overall condition of chemical, biological and physical properties of the water for their specific usage in human daily life [1,2]. However, in the developing country, water quality is constantly changing due to the rapid urbanization and growing economic development [3]. Nowadays, anthropogenic activities such as farming and industrialization have been the main caused of water quality deterioration [4] which drastically increases the mineral content, toxic chemical and heavy metal concentration in the water. The consumption of the polluted river possesses danger and harm not only to human life but also to other organisms. An effort has been made to develop a single index from the integrated measurement using several water quality parameters [5]. Selected parameters used in the index calculation are based on historical, social and natural conditions since lot of differences are expected, according to the different countries and area [6]. The water quality index is really important as it can describe the water quality condition at a particular location at a specific time using a single numeric score [7]. By doing so, it is easier to transfer the information to the public about the water quality status and its usage as to prevent them from using polluted water.
Another major public environmental concern is the ambient air pollution. Air pollution not only affecting human health, but also proven to cause bad impacts to agricultural crops, forest species and also to the ecosystem [8, 9]. Air pollution had caused significant damage to human health and loss of welfare among the Asian countries [10]. Within these years, the air quality in several areas in Malaysia is degrading majorly due to the increasing human population and trans-boundary pollution [9, 11]. Increasing human population will result in the increases in the production of motor vehicle, increasing number of power plant facilities as to meet the population demand and also the rapid construction works in the certain developing area [8]. Each of the factors contributes to the air pollutant emission into the atmosphere. Malaysia, a rapidly developing country experienced air quality degradation majorly due to the gas emission from vehicle and industrial sector [12]. In recent years, some part in Malaysia had experienced worst air quality level where pollutant from forest fire disaster from the neighboring country [13] was carried to Malaysia by the influenced of the monsoon wind. Single numeric score has been used to define the air quality status in Malaysia. Air quality index is used to represent the air quality at a specific location at a given time. The standard identifies an individual parameter and its concentration either harmful or not to the human health and also environment [8].
Materials and Methods Water Quality Index and Air Pollutant Index
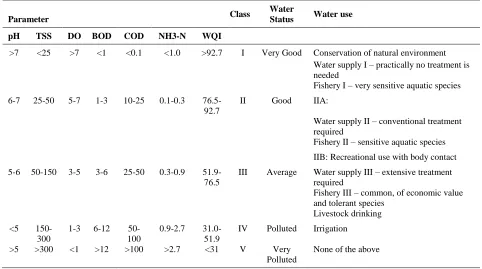
In Malaysia, there are two main indices which are Water Quality Index (WQI) and Air Pollutant Index (API). These indices are used as an indicator for the water quality and ambient air quality status of the environment. Both indices are monitored by the Department of Environment, DOE. Water quality status of selected rivers was monitored by the DOE. Earlier, the WQI was developed in several stages. In the first stage, the process involving several experts was assigned to identify the significant parameter of water quality [1]. Those experts acknowledged dissolved oxygen (DO), biochemical oxygen demand (BOD), chemical oxygen demand (COD), pH, ammoniacal nitrogen (NH3-N,) and suspended solid (SS) as the most significant parameters among other parameters [14]. Next stage involved determination of the quality function as to identify the sub-index for each parameter. Sub-indices are averaged to get an overall WQI value after the computation of the sub-index for each parameter was done using the related rating curve [1]. Table 1 shows the range and equation of every sub-index [1]. Final stage requires the combination of the calculated sub-indices in order to calculate the overall WQI based on the formula equation 1 as below [1, 15]. DOE has assigned several classes based on the calculated index. The classes represent the quality status of river water and the beneficial use(s) to human daily live as shown in Table 2 [1].
WQI = (0.22* SIDO) + (0.19*SIBOD) + (0.16*SICOD) + (0.15*SIAN) + (0.16 * SISS)
1058 Table 1. Equation for the estimation of sub-index values
Parameter Sub-index for DO (In % saturation)
Note: *means multiply with, *x is the concentration of the indicated parameter in mg/L, except for pH and DO
Table 2. Water quality parameter, class, status and use
Parameter Class
Water
Status Water use
pH TSS DO BOD COD NH3-N WQI
>7 <25 >7 <1 <0.1 <1.0 >92.7 I Very Good Conservation of natural environment Water supply I – practically no treatment is needed
Fishery I – very sensitive aquatic species
6-7 25-50 5-7 1-3 10-25 0.1-0.3 76.5-92.7
II Good IIA:
Water supply II – conventional treatment required
Fishery II – sensitive aquatic species
IIB: Recreational use with body contact 5-6 50-150 3-5 3-6 25-50 0.3-0.9
51.9-76.5
III Average Water supply III – extensive treatment required
1059
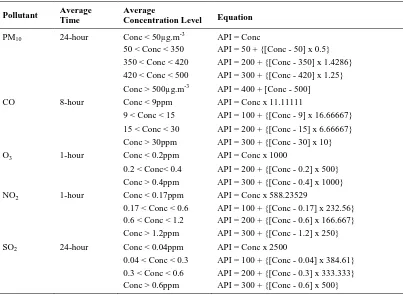
Department of Environment measured API based on five significant pollutants which are sulphur dioxide (SO2) nitrogen dioxide (NO2), carbon monoxide (CO), particulate matter with a diameter less than 10 microns (PM10) and ground level ozone (O3) [16]. Basically, the higher the API value indicates higher pollutant concentration, thus possesses a higher risk for health effect such as an API value of 50 indicates good or low air pollutant level while an API value of 300 indicates hazardous level of air pollutant level [17]. The API was calculated by finding the sub-index values for each pollutant as shown in Table 3 [17]. Then, individual sub-index that has the highest value is selected and the value will be used as an API. Figure 1 shows the flow of calculating the API [17]. Once the API value is obtained, the API will be used to determine the quality status based on standards set by the DOE as shown in Table 4 [17].
Table 3. Formula for estimation of air pollutant sub-index
Pollutant Average
Time
Average
Concentration Level Equation
PM10 24-hour Conc < 50µg.m-3 API = Conc
50 < Conc < 350 API = 50 + {[Conc - 50] x 0.5} 350 < Conc < 420 API = 200 + {[Conc - 350] x 1.4286} 420 < Conc < 500 API = 300 + {[Conc - 420] x 1.25} Conc > 500µg.m-3 API = 400 + [Conc - 500] CO 8-hour Conc < 9ppm API = Conc x 11.11111
9 < Conc < 15 API = 100 + {[Conc - 9] x 16.66667} 15 < Conc < 30 API = 200 + {[Conc - 15] x 6.66667} Conc > 30ppm API = 300 + {[Conc - 30] x 10} O3 1-hour Conc < 0.2ppm API = Conc x 1000
0.2 < Conc< 0.4 API = 200 + {[Conc - 0.2] x 500} Conc > 0.4ppm API = 300 + {[Conc - 0.4] x 1000} NO2 1-hour Conc < 0.17ppm API = Conc x 588.23529
0.17 < Conc < 0.6 API = 100 + {[Conc - 0.17] x 232.56} 0.6 < Conc < 1.2 API = 200 + {[Conc - 0.6] x 166.667} Conc > 1.2ppm API = 300 + {[Conc - 1.2] x 250} SO2 24-hour Conc < 0.04ppm API = Conc x 2500
1060 Figure 1. Calculation of Air Pollutant Index
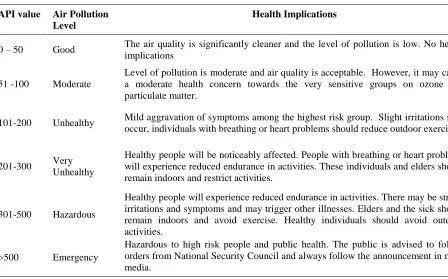
Table 4. Malaysia Air Pollutant Index description
API value Air Pollution
Level
Health Implications
0 – 50 Good The air quality is significantly cleaner and the level of pollution is low. No health implications
51 -100 Moderate
Level of pollution is moderate and air quality is acceptable. However, it may cause a moderate health concern towards the very sensitive groups on ozone and particulate matter.
101-200 Unhealthy Mild aggravation of symptoms among the highest risk group. Slight irritations may occur, individuals with breathing or heart problems should reduce outdoor exercise.
201-300 Very Unhealthy
Healthy people will be noticeably affected. People with breathing or heart problems will experience reduced endurance in activities. These individuals and elders should remain indoors and restrict activities.
301-500 Hazardous
Healthy people will experience reduced endurance in activities. There may be strong irritations and symptoms and may trigger other illnesses. Elders and the sick should remain indoors and avoid exercise. Healthy individuals should avoid outdoor activities.
>500 Emergency
Hazardous to high risk people and public health. The public is advised to follow orders from National Security Council and always follow the announcement in mass media.
1061
computation of water quality index and air pollutant index using Visual Basic for Applications (VBA) in Microsoft Excel. It is expected that the application not only provide benefit to the researchers, but also to school student as an early exposure to the environmental field and also application of computer science.
Programming using Visual Basic for Application
Microsoft Excel software has been used worldwide as data analysis tool. Despite the fact of Microsoft Excel widely used, yet still people known the build-in feature called Visual Basic for Applications (VBA). A common method used for the computation using Excel is by selecting the required data and write the formula in a cell. This method is really tedious and can be prone to error when handling large amount of data. However, by using VBA the formula theoretically will be written behind the cell. Thus, reduce the error due to the misplaced or missing items in the
Initially, the calculation of the indices required several steps since the range value of each parameter must be first determined in order to calculate the sub-index value. These steps are very time consuming when involving with large amount of data and prone to error during performing the sub-index calculation [1]. Hence, the application was set to straight away calculate the indices without having to conduct the several steps as mentioned above. The formulas were changed in VBA language and inserted into Excel. Apart from that, the description of every index also included in the VBA as it can directly show the details of the measured index value. The description for the API can be seen in while the description for the WQI as shown in Error! Reference source not found. and Error! Reference source not found. respectively.
Results and Discussion Application demonstration
The application was driven by a custom dialog box that is called UserForm. The dialog box consists of several items were put together where users can directly enter the data. UserForm were created for each index, which act as input interface as shown in Figure 2. The user only requires entering the value for each parameter and then press Ok to
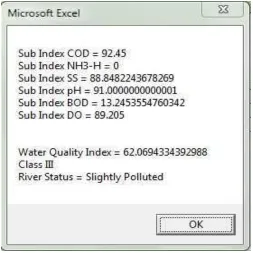
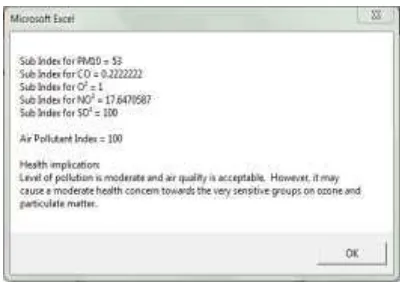
automatically calculate the index. The index value will be appeared in the “Message Box” as shown in Figure 3.
The displayed result for the WQI include every sub-index value, water quality index value, river water class, river status. While for API, the displayed result will include every sub-index value, air pollutant index and also health implications. This will provide instance result without wasting any other time just to refer to the class standard as can be seen in Figure 3 and Figure 4. Furthermore, the input data will not be disappeared when the application is closed. Once the calculation is done, the input data will be stored in the database and the data can be used for further analysis such as modeling analysis, chemometrics and artificial neural network. This is one of the advantages of using Excel as it is capable to hold large amounts of database [18].
Using the application as a teaching tool
1062 Figure 2. Input interface of water quality and air pollutant index
1063
Figure 4. Output result of air pollutant index
Conclusion
The application provides a practical approach to calculate both water quality and air pollutant index. It manages to reduce error during the calculation and also reduce the time require to perform all those calculation. The application not only provides early exposure to the environmental pollution, but also exposure to the application of computer sciences to the student. Early exposure is good as able to create awareness of environmental pollution among the student and to promote them to explore more in the environmental field [21]. The application of Excel VBA is much wider and can be used to develop different programming in other courses of environmental pollution.
Acknowledgement
The authors acknowledge the Director and lecturers of East Coast Environmental Research Institute, Universiti Sultan Zainal Abidin (UNISZA) for giving us authorization to utilize the research facilities, guidance, advice, and support for this study.
References
1. Gazzaz, N. M., Yusoff, M. K., Aris, A. Z., Juahir, H. and Ramli, M. F. (2012). Artificial neural network modeling of the water quality index for Kinta River (Malaysia) using water quality variables as predictors. Marine Pollution Bulletin (64): 2409-2420.
2. Toriman, M. E., Kamarudin, M. K. A., Gasim, M. B., Jaafar, M., Aziz, N. A. A. and Lun, P. I., (2012). Water quality status and hydrological analysis in upper tropical river, Malaysia. International Journal of Agriculture and Crop Sciences 4(2): 33-39.
3. Minhas, P. S. and Samra, J. S. (2004). Wastewater Use in Peri-urban Agriculture: Impacts and Opportunities. Central Soil Salinity Research Institute, Karnal, India, pp. 75.
4. Minhas, P. S., Lal, K., Yaday, R. K., Dubey, S. K. and Chaturvedi, R. K. (2014). Long term impact of waste water irrigation and nutrient rates: I. Performance, sustainability and produce quality of peri urban cropping systems. Agricultural Water Management (156): 100-109.
5. Zandbergen, P. A. and Hall, K. G. (1998). Analysis of the British Columbia water quality index for watershed managers: a case study of two small watersheds. Water Quality Research Journal of Canada 33 (4): 519–549. 6. Tsuzuki, Y. (2015) Relationships between pollutant discharge and water quality in the rivers from “better” to
“worse” water quality. Ecological Indicators (52): 256-269.
7. Kaurish, F.W. and Younos, T. (2007). Developing a standardized water quality index for evaluating surface water quality. Journal of the American Water Resources Association 43 (2): 533–545.
8. Afroz, R., Hassan, M. N. and Ibrahim, N. A. (2003). Review of air pollution and health impacts in Malaysia. Environment Research 92: 71-77.
9. Dominick, D., Juahir, H., Latif, M. T., Zain, S. M. and Aris, A. Z. (2012). Spatial assessment of air quality patterns in Malaysia using multivariate analysis. Atmospheric Environment 60: 172-181.
1064 11. Mabahwi, N. A., Leh, O. L. H. and Omar, D. (2014). Human Health and Wellbeing: Human health effect of air
pollution. Procedia – Social and Behavioral Sciences (153): 221-229.