Strategic Management Journal Strat. Mgmt. J.,36: 148–158 (2015) Published online EarlyView 18 December 2013 in Wiley Online Library (wileyonlinelibrary.com) DOI: 10.1002/smj.2212 Received 4 February 2013;Final revision received 5 November 2013
RESEARCH NOTES AND COMMENTARIES
PRICE CONTROL AND ADVERTISING
IN FRANCHISING CHAINS
ITAI ATER1* and OREN RIGBI2
1Strategy Area, Recanati Business School, Tel Aviv University, Tel Aviv, Israel
2Department of Economics, Ben-Gurion University of the Negev, Beer Sheva, Israel
This study investigates how franchising chains use advertising to enhance coordination and improve their control over prices set at franchised outlets. We argue that chains use price advertising to inform customers about their desired prices, thereby influencing franchisees to adopt the advertised prices although they are not contractually required to do so. We test our hypotheses using rich outlet-level price data collected before and after a U.S.nationwide advertising campaign by McDonald’s. Our findings indicate that advertising is an effective mechanism that franchising chains use to improve their control over franchisees, enhance uniformity, and reduce franchisee free-riding. Copyright2013 John Wiley & Sons, Ltd.
INTRODUCTION
By coordinating among their units and enhancing standardization, multiunit organizations can imple-ment strategic behaviors of remarkable scale and complexity (Greve, 2003; Greve and Baum, 2001). However, multiunit organizations encounter dif-ficulties controlling and coordinating their units because decision makers at individual units seek to maximize their own profits rather than the profit of the organization as a whole (Caves and Murphy, 1976). Accordingly, the literature on franchising chains, a prime example for multiunit organiza-tions, has examined how franchisors use contracts to better align franchisees’ incentives with the chain’s overall objective (Lafontaine, 1992). What the literature has underemphasized, though, is how franchisors affect decisions that are not governed
Keywords: franchising; pricing; agency theory; advertis-ing; opportunistic behavior
*Correspondence to: Itai Ater, Strategy Area, Recanati Business School, Tel Aviv University, Tel Aviv, 69978 Israel. E-mail: [email protected]
Copyright2013 John Wiley & Sons, Ltd.
by the franchising contract. This paper focuses on pricing decisions, a key aspect of franchisee behavior that is not covered by franchising con-tracts, and argues that chains use advertising and external parties—customers—to influence these decisions, thereby improving chains’ control over franchisees.
harm the franchisor’s efforts to enhance uniformity and promote consistency (Barthelemy, 2008; El Akremi, Mignonac, and Perrigot, 2011; Michael, 2000). Uniformity and consistency across outlets are essential for franchisors because the value of the chain largely resides in its capacity to offer a uniform product at consistent terms (Bradach, 1997; Ingram, 1996; Kaufmann and Eroglu, 1998). We propose that franchisors use price adver-tising to enhance price uniformity across chain outlets. To substantiate our claim, we develop hypotheses concerning franchisees’ pricing deci-sions and about mechanisms, primarily price advertising, that franchisors use to improve their control over prices. We test and find support for our theory using outlet-level panel price data that were collected before and after a large nationwide advertising campaign by McDonald’s.
Our study makes two main contributions. First, it offers new research directions regarding the role of advertising in affecting franchisees’ pricing and other strategic decisions. Despite the prominent role of advertising in business in general and in franchising chains in particular, the motivations for and effects of advertising have received little attention in the literatures on strategic management and on organizations. In this paper, we propose that advertising is an effective tool to coordinate and control the behavior of franchised units. Second, this study contributes to the agency literature by developing a theory regarding the role of advertising in affecting noncontractual decisions made by franchisees. While previous studies have focused almost exclusively on contractual relationships, we propose that franchisors use third parties—customers—to monitor and influence noncontractual decisions made by franchisees.
CONTEXT AND HYPOTHESES
A fundamental challenge faced by franchising chains is to maintain uniformity and standardiza-tion throughout the franchised system. Uniformity and consistency are especially important for chains that offer services to mobile consumers—such as in the accommodation and fast-food industries— because their customers patronize outlets of the same chain but in different geographic loca-tions (Bradach, 1997). To enhance consistency, franchising contracts often specify detailed sets of requirements that franchisees should closely
follow. Franchisors also adopt various controls, such as field audits, mystery shoppers, and man-agement information systems, which improve their ability to monitor franchisees’ behavior (Yin and Zajac, 2004).
Despite the measures taken by franchisors, fran-chising contracts do not cover each and every aspect of the franchisee’s business (Kidwell, Nygaard, and Silkoset, 2007; Shane, 1996; Vroom and Gimeno, 2007). For instance, the duration of the franchising contract, sometimes up to twenty years, makes it impossible to consider and articu-late each contingency at the time the contract is written. Legal aspects may also limit the chisor’s ability to dictate or intervene in fran-chisees’ actions. In particular, it has long been cus-tomary for franchisees to set prices independently at their outlets. Although a 1997 decision by the U.S. Supreme Court inState Oil Company v. Khan potentially opened the door for franchisor interven-tion in franchisees’ prices, franchisors still find it difficult to directly intervene in a franchisee’s pric-ing decisions. Consistent with this view, Matthew Paull, McDonald’s Corporation CFO, said in 2006: “We are required by law [not to] and we never ever try to influence [franchisees’] pricing.”1Thus, despite the 1997 Supreme Court decision, fran-chisees still consider pricing decisions, among the most important business decisions, to be at their own discretion.
Pricing decisions at franchised outlets
Franchisees and franchisors may have different views on what the optimal prices are at a given outlet (Kalnins, 2003; Kosov´a, Lafontaine, and Perrigot, 2013; Lafontaine and Slade, 1997). First, when setting prices, franchisees predominantly take into account the local market conditions in which they operate. Franchisors, in contrast, also have chain-wide considerations such as price uniformity when contemplating the optimal prices. Thus, we expect that the actual price variation among outlets is larger than the variation that would have occurred had the franchisor set the prices at each outlet (Lafontaine, 1999). Second,
1McDonald’s earnings conference call, January 24, 2006. For
150 I. Ater and O. Rigbi
because the royalty payments that the franchisor receives from franchisees are determined as a percentage of outlet sales, franchisors may be interested in inducing lower prices and higher sales (Lafontaine, 1999; Vroom and Gimeno, 2007). Finally, because franchisees pay royalty payments, whereas corporate-owned outlets do not, we should expect that the prices at franchised outlets will be higher than the prices at corporate outlets. Accordingly, we posit the following as a starting point for our analysis:
Hypothesis 1a: Prices of items at franchised outlets are higher than the prices of the same items at corporate-owned outlets.
The potential controversy between franchisees and the franchisor regarding the prices that fran-chisees set is likely to be more evident in outlets that serve few repeat patrons. In these outlets, franchisees do not have sufficient incentives to set low prices, because many of their patrons are unlikely to return. In other words, outlets that serve larger proportions of repeat customers face more salient reputational concerns, which attenuate their incentives to behave opportunistically (Brickley and Dark, 1987; Williamson, 1991). Unlike fran-chisees, the franchisor considers future customers to be an important source of profits, regardless of the specific outlets they visit. Thus, we expect that:
Hypothesis 1b: Prices at franchised outlets that serve few repeat customers, such as outlets located near highways, will be higher than prices at franchised outlets located elsewhere.
Prices and the choice of ownership form
How do franchisors improve their control over prices? The agency literature has long recognized that organizational form decisions are a potential response to agency concerns (e.g., Fama and Jensen, 1983). Thus, franchisors can overcome price controversies and enhance price uniformity by operating local outlets themselves and directly setting the prices in these outlets (Brickley and Dark, 1987). However, given the advantages associated with franchising, we can expect that franchisors will choose to operate corporate-owned outlets only in locations where franchisees’ price setting behavior is less likely to be aligned with
the objective of the chain. Hence, we posit the following:
Hypothesis 2a: Franchisors will use more cor-porate outlets in locations where franchisees are more likely to set relatively high prices, that is, in locations that serve relatively few repeat cus-tomers.
Advertising and prices
Another mechanism that chains use to improve their control over franchisees’ prices is through price advertising campaigns. In running an adver-tising campaign, the franchisor determines the content of the campaign—specifically, the prices advertised—whereas franchisees have the final say on whether to adopt the advertised prices at their outlets. Notably, previous research assumed that advertisers control both the advertising content and pricing decisions, and it did not explore the effect of advertising on organizational questions in gen-eral or its effect on agents’ decisions in particular. According to our argument, franchisees acknowledge the impact of price advertising cam-paigns on customers’ expectations: Specifically, we theorize that price advertising creates a reference price for customers, which they then compare with the actual prices they encounter. Consequently, franchisees who do not want to disappoint their customers tend to adopt the adver-tised prices. Price advertising enables franchisors to use customers to monitor franchisees’ behavior and to also use customers to “punish” franchisees who do not adopt the advertised prices, e.g., by choosing not to purchase at those outlets or by not revisiting those outlets in the future.
Our main empirical analysis concerns the impact of the advertising campaign on the prices of nonadvertised items. The impact on the prices of advertised items is obvious. The focus on nonadvertised items is important because a typical pricing campaign only advertises a small subset of the items that an outlet actually sells. We hypothesize that the effect of the advertising campaign on nonadvertised items will depend on the substitution patterns between the advertised and nonadvertised items. In particular, we expect that a low-price advertising campaign will induce franchisees to lower the prices of nonadvertised items that are close substitutes for the advertised items. We do not expect to find similar effects for
items that do not have close substitutes in the set of advertised items. Specifically, we expect that
Hypothesis 2b: Following the advertising cam-paign, prices of nonadvertised items should decrease only among items that have close sub-stitutes among the advertised items.
Furthermore, assuming that franchisees’ prices at locations with few repeat customers are initially higher than franchisees’ prices at other locations (Hypothesis 1b), price advertising is expected have a greater effect on the prices at these locations. Therefore, we also expect that
Hypothesis 2c: The impact of the advertising campaign on prices will be greater at locations that serve fewer repeat customers than its impact elsewhere.
METHODS
Data collection and sample
The empirical context of this study is restaurant franchising chains, a prime example of business-format franchising (Lafontaine and Kosov´a, 2012). For several reasons, restaurant franchising chains offer an excellent setting to study how franchisors exercise control over franchisees, and to examine the influence of price advertising on prices at franchised outlets. First, the ability to offer a “standard experience” has been a basic ingredient of the success and growth of restaurant chains over the last fifty years (e.g., Bradach, 1997). Second, restaurant chains typically cater to price-sensitive customers who value low prices. Third, most large restaurant chains comprise both company-owned restaurants and franchised restaurants, enabling the comparison of different governance forms within the same chain. Lastly, advertising by restaurant chains is extensive. For example, in the first half of 2012 alone, restaurant franchising chains spent $1.7 billion on advertising. We specifically focus on McDonald’s, the largest chain worldwide in terms of sales and spending on advertising.2
Our data come from several sources in Santa Clara County, CA. The main data set was col-lected in July, 1999 (Thomadsen, 2005) and in
2See http://kantarmediana.com/sites/default/files/kantareditor/
Kantar-Media-QSR-Ad-Insights.pdf
July, 2006. It includes the location, menu prices, ownership, and additional characteristics of all fast food outlets located in Santa Clara County that are affiliated with the following hamburger and sand-wich chains: Burger King, Carl’s Jr., In-N-Out, Jack-in-the-Box, McDonald’s, Wendy’s, Subway, and Quiznos. The 1999 data were collected by Thomadsen (2005). We collected the 2006 data, visiting all 324 Santa Clara County outlets of these chains. In each visit, we collected menu prices and information on the outlet’s characteristics. We obtained ownership information from the Asses-sor’s Office and the Public Health Department in Santa Clara County. We supplement these data with various demographic data at the ZIP code level, obtained from the 2000 Census and from the 2005Community Sourcebook America.
McDonald’s Dollar Menu
The Dollar Menu advertising campaign was ini-tiated nationwide in September 2002, and it refers to a set of eight menu items that are sold for $1 each. These items include two main dishes—a Double Cheeseburger and a McChicken sandwich—together with small fries, a small soft drink, and additional side dishes and desserts. To promote the introduction of the Dollar Menu, McDonald’s added $20 million to its advertising budget in the last quarter of 2002. Although the Dollar Menu campaign heavily advertised the $1 price, McDonald’s franchisees were responsible for setting the actual prices at their outlets.
Dependent variable
152 I. Ater and O. Rigbi
between the two Dollar Menu dishes (Double Cheeseburger and McChicken sandwiches) and the following meals: Big Mac, Quarter Pounder, and the Double Quarter Pounder. For example, following the introduction of the Dollar Menu, the percentage of Double Cheeseburger transactions skyrocketed from 0.4 to 14.6 percent, and the proportion of McChicken transactions nearly doubled from 11.17 to 21.44 percent. More impor-tantly, over the same period of time, the share of transactions in which the Big Mac meal was sold dropped abruptly from 8.69 to 5.8 percent. On the other hand, the share of transactions of the Chicken McNuggets 6 pc. and the Filet-O-Fish meals remained fairly stable. For example, Filet-O-Fish sales went from 3.89 to 3.84 percent of transactions. Thus, based on this analysis and an additional survey that we conducted (both available upon request), we consider the Big Mac, Quarter Pounder, and Double Quarter Pounder meals as meals that have close substitutes among the items of the Dollar Menu.
Independent variables
Organizational form
The key independent variable is the outlet’s organizational form, i.e., whether the store is franchised or owned and operated by the fran-chisor. The regression coefficient on this variable corresponds to a meal’s price difference, defined as the difference between a meal’s average price in franchised outlets and its average price in cor-porate outlets, conditional on the controls included in the regression. The use of corporate outlets as a comparison group is common in the literature and is justified given the strict control that chains have over the prices set at corporate-owned outlets (Kalnins, 2003; Vroom and Gimeno, 2007; Yin and Zajac, 2004). Because we are interested in the change in the price difference following the advertising campaign, we add a post-Dollar Menu campaign dummy variable and its interaction with the organizational form dummy variable as independent variables.
Competitive environment
We use data on the outlets of other fast food chains in Santa Clara County to determine the competitive environment of each McDonald’s outlet. We measure competition according to
the outlet’s distance from competitors and those competitors’ affiliations with other chains. We distinguish between three ranges of distance: “close” is defined as within 0.1 miles of an outlet; “medium” is defined as within 0.1–0.5 miles; and “far” is defined as within 0.5–1 mile. For example, the variable Close BK Competitors counts the number of Burger King outlets that are within 0.1 miles from a given McDonald’s outlet.
Repeat business proxies
Our main proxy for repeat customers is distance of an outlet from a highway. We define a dummy variable, far from highway, which is coded 1 if an outlet is located more than 0.25 miles from a highway exit and 0 otherwise. We also use the presence of a playground and whether wireless service is offered at the restaurant as additional proxies for an outlet’s level of repeat customers. Robinson et al. (2007) reported that 32 percent of the children in their sample visited McDonald’s outlets more than once a week, and nearly 72 percent visited them more than once a month. Wireless service serves as a proxy for students who regularly patronize McDonald’s restaurants. Finally, we define a combined proxy as the interaction of these three proxies.
Control variables
We include outlet characteristics and demographic variables related to each outlet’s ZIP code as control variables. The outlet characteristics include the number of seats, the existence of a drive-thru, and whether the outlet is located in a mall. The ZIP code level demographic control variables are median household income, median rent payment, a dine-out spending index, population density, share of children below the age of 14, the share of males in the population, and the share of African Americans in the population.
Estimation
Our primary model is the following difference-in-differences hedonic price equation:
ln
pijt
=α+γ ∗D2006,jt +δ∗Dfranchised,jt
+η∗D2006,
jt ∗Dfranchised,jt +β∗Xjt
+
k
θk∗Compjtk+εijt (1)
wherepijtis the price of meali in outletj in yeart.
D2006,jt is a dummy variable that indicates whether
an observation was collected in 2006, after the Dollar Menu was introduced.Dfranchised,jt indicates
if outlet j was franchised in year t. Xjt is the
set of control variables associated with outletj in yeart.Compjtk is a competition variable reflecting
the number of outlets that rival k operated in the vicinity of McDonald’s outlet j in year t. The main parameters of interest are δ and η, which correspond, respectively, to the price difference (for a given meal i) between franchised and corporate outlets in 1999 (Hypothesis 1a) and to the change in this price difference between 1999 and 2006 (Hypothesis 2b).
To test Hypotheses 1b and 2c, which focus on the repeat business argument, we estimate the following heterogeneous difference-in-differences specification:
ln(pijt)=α+γ1∗Dfar_from_highwayj+γ2∗Dfranchisedjt
+γ3∗D2006
jt +γ4∗Dfar_from_highwayj
×∗Dfranchised
jt +γ5∗Dfar_from_highwayj
×∗D2006
jt +γ6∗Dfranchisedjt∗D2006jt
+γ7∗Dfar_from_highway
j∗Dfranchisedjt∗D2006jt
+β∗Xjt +
k
θk∗Compjtk +εijt (2)
where Dfar_from_highway,j equals one if outlet j
is located far from the highway and zero other-wise. In this specificationγ4andγ7are the main parameters of interest. Using the prices at cor-porate outlets as a comparison group,γ4 captures the difference in 1999 between franchised outlets located “far from a highway” and franchised out-lets located near a highway. In addition,γ7 exam-ines how this difference changed between 1999 and 2006. According to test Hypotheses 1b and 2c, we expectγ4to be negative andγ7to be positive.
RESULTS
Table 1 presents the means, standard deviations, and correlations of the independent variables, separated for corporate and franchised outlets. The table provides preliminary support for the testable hypotheses. Consistent with Hypothesis 1a, the table shows that the average price of the Big Mac
meal (and other nonreported meals) at franchised outlets is higher than the corresponding average price at corporate outlets. In addition, franchisors prefer operating corporate outlets in locations where there are fewer repeat customers, such as near highways (Hypothesis 2a). Table 1 also supports Hypothesis 2b: the difference between the average Big Mac meal price at franchised outlets and at corporate outlets decreased from 41 cents before the Dollar Menu campaign to 22 cents after the campaign.
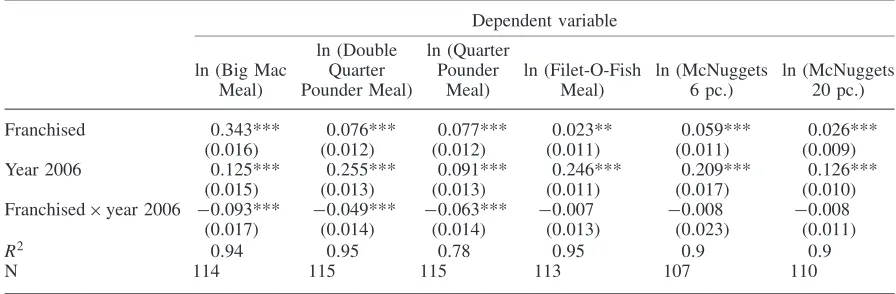
Table 2 presents estimation results for Equation 1. The first column, which corre-sponds to the Big Mac meal, reveals that the price difference between corporate-owned and franchised outlets decreased by 75 percent, from 12.5 in 1999 to 3.2 percent in 2006. Most of the other independent and control variables (available upon request) are insignificant. Other columns present the estimation results for the other meals that were offered in 1999 and 2006. The results show that the price differences for meals that have close substitutes in the Dollar Menu, i.e., the Quarter Pounder and the Double Quarter Pounder, decreased between 1999 and 2006. On the other hand, the price differences for meals that did not have close substitutes in the Dollar Menu do not exhibit significant changes. Overall, the regression results support Hypotheses 1a and 2b.
Repeat business analysis
154
I.
Ater
and
O.
Rigbi
Table 1. Means, standard deviations, and correlations (1999)
Mean s.d. Correlations
Variable name Overall Corporate Franchised
P-value
of diff. Corporate Franchised 1 2 3 4 5 6 7 8 9 10 11 12 13 14 15 16
1999 Big Mac meal price 3.33 3.07 3.48 0 0.24 0.27
2006 Big Mac meal price 4.46 4.32 4.54 0 0.13 0.17
1 Income (ZIP code) 75,284 78,910 73,145 0.16 14,483 15,842
2 Rent (ZIP code) 1155.03 1203.57 1126.41 0.13 175.50 197.62 0.87
3 Dineout index (ZIP code) 165.11 166.83 164.10 0.76 32.75 34.86 0.89 0.78
4 Population density (1,000 s/Sq.
mile) (ZIP code)
8.25 8.39 8.16 0.45 0.67 1.36 −0.36−0.02−0.34
5 Proportion of children (up to
age 18) (ZIP code)
0.21 0.21 0.21 0.89 0.03 0.04 0.06−0.16−0.15−0.39
6 Share male (ZIP code) 0.51 0.51 0.51 0.35 0.02 0.02 −0.42−0.27−0.48 0.21−0.04
7 Share African Americans (ZIP
code)
0.03 0.03 0.03 0.16 0.01 0.01 −0.28−0.13−0.38 0.24−0.01 0.37
8 Drive-through 0.66 0.65 0.67 0.91 0.49 0.48 −0.08−0.11−0.07−0.04−0.06 0.01−0.18
9 # Seats 104.26 87.04 114.41 0.39 31.61 150.07 −0.15−0.11−0.21 0.11 0.22 0.16 0.00−0.10
10 Mall 0.05 0.04 0.05 0.89 0.21 0.22 0.08 0.07 0.10 0.05−0.07−0.09 0.12−0.31−0.13
11 Playground 0.37 0.43 0.33 0.43 0.51 0.48 −0.06−0.08−0.09 0.01 0.23−0.03 0.05−0.01 0.17−0.02
12 Distance from highway (miles) 0.84 0.60 0.98 0.04 0.52 0.76 −0.04−0.03 0.16 0.21−0.43−0.17−0.16−0.09 0.02 0.19 0.07
13 Far from highway 0.77 0.70 0.82 0.26 0.47 0.39 0.00 0.00 0.08 0.27−0.23−0.03 0.04−0.23 0.04 0.12−0.06 0.51
14 # BK competitors 0.59 0.64 0.56 0.65 0.58 0.60 −0.20−0.18−0.25 0.13−0.06 0.36 0.20 0.14−0.09 0.16−0.03−0.11−0.05
15 # MD competitors 0.30 0.23 0.33 0.43 0.43 0.53 −0.12−0.03−0.10−0.06 0.10 0.32 0.09−0.20 0.23 0.02−0.19−0.01 0.01 0.08
16 # other burger competitors 1.28 1.27 1.28 0.97 0.83 1.02 −0.28−0.18−0.24 0.34−0.04 0.15 0.03 0.14 0.12−0.07 0.20 0.14 0.08 0.12 0.03
17 # sandwich competitors 0.67 0.59 0.72 0.47 0.59 0.69 −0.17−0.15−0.05 0.00−0.25 0.23 0.05−0.10−0.15 0.00−0.08 0.17 0.09−0.01 0.15−0.01
All correlations with an absolute value larger than 0.25 are significant atp<0.05. Correlations are based on the 1999 data. When we jointly compare all the characteristics, we cannot reject the null hypothesis that franchised and corporate outlets are located in similar environments (p=0.14). To make the table more compact, competition variables for each competitor type (Burger King, McDonald’s, other fast food burger chains, and other fast food sandwich chains) are presented for the three distance ranges combined.
Copyright
2013
John
W
iley
&
Sons,
L
td.
Strat.
Mgmt.
J.
,
36
:
148
–
158
(2015)
DOI:
Table 2. Results of regression analysis: changes in the price differences Dependent variable
ln (Big Mac Meal)
ln (Double Quarter Pounder Meal)
ln (Quarter Pounder
Meal)
ln (Filet-O-Fish Meal)
ln (McNuggets 6 pc.)
ln (McNuggets 20 pc.) Franchised 0.343*** 0.076*** 0.077*** 0.023** 0.059*** 0.026***
(0.016) (0.012) (0.012) (0.011) (0.011) (0.009)
Year 2006 0.125*** 0.255*** 0.091*** 0.246*** 0.209*** 0.126***
(0.015) (0.013) (0.013) (0.011) (0.017) (0.010)
Franchised×year 2006 −0.093*** −0.049*** −0.063*** −0.007 −0.008 −0.008
(0.017) (0.014) (0.014) (0.013) (0.023) (0.011)
R2 0.94 0.95 0.78 0.95 0.9 0.9
N 114 115 115 113 107 110
Standard errors are in parentheses.
The table shows the main coefficients from Equation 1. Each column presents the regression results using the logarithm of a different meal price as the dependent variable. Additional competitive variables, outlet characteristics, and demographic variables are included in the regression. Errors are clustered by outlet.
***p<0.01; **p<0.05; *p<0.1
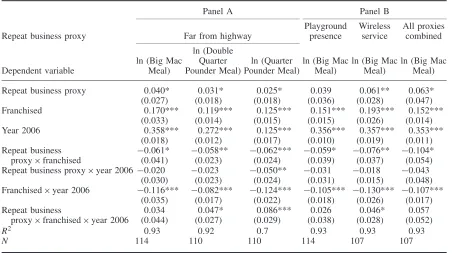
equation using the other proxies for the likelihood of repeat customers. The results using these alternative proxies reveal patterns similar to those observed when using the distance from a highway as a proxy. Thus, Hypotheses 1b and 2c are supported.
An alternative explanation for higher prices near highways is that those franchisees incur higher costs, which result in higher prices. We claim, however, that franchisees generally incur similar costs, regardless of whether they are located near or at a distance from a highway. For instance, the royalties that a franchisee pays to the chain are typically determined according to the cohort of the contract rather than particular characteris-tics of the outlet’s location. Furthermore, McDon-ald’s franchisees purchase their inputs from the same certified suppliers, and at equal terms, and McDonald’s corporation owns the premises of the franchised units (Kaufmann and Lafontaine, 1994; Lafontaine and Shaw, 1999). Other costs, such as labor, are unlikely to vary significantly across outlets located within the same county. There-fore, higher costs near a highway probably do not explain the observed price differences.
Robustness
The use of panel data enables us to rule out alternative explanations that rely on time-invariant unobservables. To further substantiate our theory, we also carried out various robustness tests
and experimented, for instance, with different definitions of local competition. We also examined whether the results apply to Jack-in-the-Box, which is the only hamburger chain, other than McDonald’s, that operates a mixture of corporate-owned and franchised outlets in the Santa Clara County. Jack-in-the-Box introduced its Value Meal in 2001. We observed 35 and 36 outlets of Jack-in-the-Box in 1999 and in 2006, respectively, six of which were franchised in each period. Using a similar regression analysis for the Jumbo Jack Meal, the chain’s signature item, and consistent with our theory, we find that the corresponding price differential decreased significantly, from 6 percent in 1999 to 1.3 percent in 2006.
DISCUSSION AND CONCLUDING REMARKS
156 I. Ater and O. Rigbi
Table 3. Estimation results for changes in price differences of McDonald’s meals using various proxies for repeat customers
Panel A Panel B
Repeat business proxy Far from highway
Playground presence
Wireless service
All proxies combined
Dependent variable
ln (Big Mac Meal)
ln (Double Quarter Pounder Meal)
ln (Quarter Pounder Meal)
ln (Big Mac Meal)
ln (Big Mac Meal)
ln (Big Mac Meal) Repeat business proxy 0.040* 0.031* 0.025* 0.039 0.061** 0.063*
(0.027) (0.018) (0.018) (0.036) (0.028) (0.047)
Franchised 0.170*** 0.119*** 0.125*** 0.151*** 0.193*** 0.152***
(0.033) (0.014) (0.015) (0.015) (0.026) (0.014)
Year 2006 0.358*** 0.272*** 0.125*** 0.356*** 0.357*** 0.353***
(0.018) (0.012) (0.017) (0.010) (0.019) (0.011)
Repeat business proxy×franchised
−0.061* −0.058** −0.062*** −0.059* −0.076** −0.104*
(0.041) (0.023) (0.024) (0.039) (0.037) (0.054)
Repeat business proxy×year 2006−0.020 −0.023 −0.050** −0.031 −0.018 −0.043
(0.030) (0.023) (0.024) (0.031) (0.015) (0.048)
Franchised×year 2006 −0.116*** −0.082*** −0.124*** −0.105*** −0.130*** −0.107***
(0.035) (0.017) (0.022) (0.018) (0.026) (0.017)
Repeat business
proxy×franchised×year 2006
0.034 0.047* 0.086*** 0.026 0.046* 0.057
(0.044) (0.027) (0.029) (0.038) (0.028) (0.052)
R2 0.93 0.92 0.7 0.93 0.93 0.93
N 114 110 110 114 107 107
Standard errors are in parentheses.
The table presents the estimation results of Equation 2. The results in Panel A are based on using the distance from a highway as a proxy for repeat business and focusing on three different meals. The results in Panel B are based on the following three variables as proxies for repeat business: playground presence, wireless service, and a variable that intersects all three proxies. In this panel, only the price of the Big Mac Meal is used as the dependent variable. Additional competitive variables, outlet characteristics, and demographic variables are included in the regression. Errors are clustered by outlet.
***p<0.01; **p<0.05; *p<0.1
the advertisement of low-price items to enhance price uniformity and to generate pressure on franchisees to set lower prices. Our theoreti-cal contribution emphasizes the role of third parties—customers—in aligning franchisees’ decisions with the objectives of the franchisor. We claim that franchisors use price advertising to inform customers about the prices they should expect to be offered at outlets of the chain. Fran-chisees, although not contractually obligated to do so, choose to adopt the advertised prices to meet customers’ expectations. The empirical analysis supports our hypotheses concerning the impact of the advertising campaign on franchisees’ prices, especially in locations where franchisees are more likely to free-ride on the reputation of the chain. We believe that this function has a dominant role in chains’ advertising decisions.
Although our analysis mostly relies on data from one fast-food chain and one state, we are confident that our contribution is not limited to
the specific setting that we study. First, the Dollar Menu campaign we studied was not restricted to California and was introduced nationwide and internationally. Second, apart from McDonald’s, several other franchising chains, including Burger King, Jack-in-the-Box, Baskin Robbins, Little Caesars, Subway, and Quiznos have adopted sim-ilar campaigns. Chris Sternberg, who served as a senior vice president at Papa John’s International, the third largest pizza franchising chain in the United States, said that “most franchisees follow our recommended national offers, particularly since customers might argue with the store’s workers if they’re charged more than the adver-tised price.”3 More generally, the mechanism we propose may also apply to other principal–agent
3“Burger King Franchisees Can’t Have It Their Way,” Wall
Street Journal, January 21, 2010, and also “Can They Really Make Money Off the Dollar Menu,”Wall Street Journal, May 21, 2009.
settings in which firms, institutions, and indi-viduals can exploit third parties to effectively “discipline” agents and affect their behavior. For example, the price of a 6.5-oz bottle of Coke was 5 cents from 1886 to 1959. Levy and Young (2004) partially attribute this long-term price rigidity to the price advertising that Coca-Cola was undertak-ing throughout the period. Other settundertak-ings to which our mechanism could apply include department chairs or university authorities that inform students regarding certain policies they want to implement. Students’ expectations, in turn, can induce profes-sors to adopt these polices. In other cases, store managers can inform customers regarding certain quality and service standards that they expect their employees to provide. By using customers’ expectations, store managers can better ensure that employees actually provide these standards.
Finally, we note that, although we think that the main contribution of our paper concerns the effect of price advertising on chain realignment, we believe that our findings about franchisees’ prices near highways (Hypothesis 1b) and that franchisors prefer to operate outlets near highways (Hypothesis 2a) are important in their own right. Previous research has hypothesized that corporate outlets are more likely to be located near highways (Brickley and Dark, 1987), but the evidence put forward in that study was inconsistent with the hypothesis. Thus, our study also offers novel empirical support for a long-standing hypothesis about the relationship between organizational form decisions and reputational or agency issues.
ACKNOWLEDGEMENTS
We appreciate the guidance from co-editor Will Mitchell and the comments from two anonymous reviewers. We also thank Liran Einav, Francine Lafontaine, and Raphael Thomadsen for helpful suggestions. IA gratefully acknowledges financial support from the Haley and Shaw Fellowship.
REFERENCES
Barthelemy J. 2008. Opportunism, knowledge, and the performance of franchise chains. Strategic Manage-ment Journal 29: 1451–1463.
Blair RD, Lafontaine F. 1999. Will Khan foster or hinder franchising? An economic analysis of maximum resale price maintenance.Journal of Public Policy & Marketing18: 25–36.
Bradach JL. 1997. Using the plural form in the man-agement of restaurant chains. Administrative Science Quarterly 42: 276–303.
Bradach JL. 1998. Franchise Organizations. Harvard Business School Press: Boston, MA.
Brickley JA, Dark FH. 1987. The choice of organizational form: the case of franchising. Journal of Financial Economics 18: 401–420.
Caves R, Murphy W. 1976. Franchising: firms, markets, and intangible assets.Southern Economic Journal 42: 572–586.
El Akremi A, Mignonac K, Perrigot R. 2011. Opportunis-tic behaviors in franchise chains: the role of cohe-sion among franchisees.Strategic Management Jour-nal 32(9): 930–948.
Fama EF, Jensen MC. 1983. Agency problems and residual claims. Journal of Law and Economics 26: 325–350.
Greve HR. 2003. Why are there so many multiunit organizations?Strategic Organization 1(1): 109–115. Greve HR, Baum JAC. 2001. Introduction: a multiu-nit, multimarket world. InMultiunit Organization and Multiunit Strategy, Advances in Strategic Manage-ment, Vol. 18, Baum JAC, Greve HR (eds). Emerald Group Publishing Limited: Bingley, UK; 1–28. Ingram P. 1996. Organizational form as a solution to
the problem of credible commitment: the evolution of naming strategies among U.S. hotel chains, 1896–1980. Strategic Management Journal 17: 85–98.
Kalnins A. 2003. Hamburger prices and spatial economet-rics. Journal of Economics & Management Strategy 12: 591–616.
Kaufmann PJ, Eroglu S. 1998. Standardization and adaptation in business format franchising. Journal of Business Venturing 14: 69–85.
Kaufmann PJ, Lafontaine F. 1994. Costs of control: the source of economic rents for McDonald’s franchisees.
Journal of Law and Economics 37(2): 417–453. Kidwell RE, Nygaard A, Silkoset R. 2007. Antecedents
and effects of free riding in the franchisor-franchisee relationship. Journal of Business Venturing 22: 522–544.
Kosov´a R, Lafontaine F, Perrigot R. 2013. Organizational form and performance: evidence from the hotel industry. Review of Economics and Statistics 95(4): 1303–1323.
Lafontaine F. 1992. Agency theory and franchising: some empirical results. RAND Journal of Economics 23: 263–283.
Lafontaine F. 1999. Franchising or corporate ownership: the effect on price dispersion. Journal of Business Venturing 14: 17–34.
Lafontaine F, Kosov´a R. 2012. Much ado about chains: a research agenda.International Journal of Industrial Organization 30(3): 303–308.
Lafontaine F, Shaw KL. 1999. The dynamics of franchise contracting: evidence from panel data. Journal of Political Economy 107: 1041–1080.
158 I. Ater and O. Rigbi
Levy D, Young AT. 2004. “The real thing”: nominal price rigidity of the nickel coke, 1886–1959. Journal of Money, Credit and Banking 36(4): 765–799. Michael SC. 2000. The effect of organizational form on
quality: the case of franchising.Journal of Economic Behavior & Organization 43: 295–318.
Robinson TN, Borzekowski DLG, Matheson DM, Krae-mer HC. 2007. Effects of fast food branding on young children’s taste preferences.Pediatrics and Adolescent Medicine 161(8): 792–797.
Shane S. 1996. Hybrid organizational arrangements and their implications for firm growth and survival: a study of new franchisers.Academy of Management Journal 39: 216–234.
Thomadsen R. 2005. The effect of ownership structure on prices in geographically differentiated industries.
Rand Journal of Economics 36(4): 908–929. Vroom G, Gimeno J. 2007. Ownership form, managerial
incentives and the intensity of rivalry. Academy of Management Journal 50(4): 901–922.
Williamson OE. 1991. Comparative economic organization: the analysis of discrete structural alternatives. Administrative Science Quarterly 36: 269–296.
Yin X, Zajac EJ. 2004. The strategy/governance structure fit relationship: theory and evidence in franchising arrangements. Strategic Management Journal 25(4): 365–383.
Zajac EJ, Westphal JD. 1994. The costs and benefits of managerial incentives and monitoring in large U.S. corporations: when is more not better?Strategic Management Journal 15: 121–142.