JEJAK
Journal of Economics and Policy http://journal.unnes.ac.id/nju/index.php/jejak
Valuing Ecotourism of a Recreational Site in Ciamis District
0f West Java, Indonesia
Endah Saptutyningsih1, Rini Selviana2
1,2Faculty of Economics Universitas Muhammadiyah Yogyakarta
Permalink/DOI: http://dx.doi.org/10.15294/jejak.v10i1.9134
Received: August 2016; Accepted: December 2016; Published: March 2017
Abstract
Ecotourism, as an alternative tourism, involves visiting natural areas in order to learn, to study or to carry out activities environmentally friendly, that is a tourism based on the nature experience which enables the economic and social development of local communities. Ecotourism encourages rural economics and provides benefits to income and employment generation. It is considered as an alternative for enhancing rural lifestyle and for leading positive changes in the distribution of income. One of the area which has ecotourism site in Indonesia is Karangkamulyan site, Ciamis District of West Java. There is a tourist attraction that not only offers natural beauty, history and cool atmosphere, it also serves as a place of education and research on the history in the field of archeology. This attraction should receive special attention from the local government so that the tourists and local people also get the benefits. Ecotourism can be classified as possessing public goods-type characteristics, and as such, welfare benefit estimates must utilize non-market valuation techniques. This study employs the travel cost method and contingent valuation method. Travel cost and contingent valuation methods are applied to the problem of estimating the potential consumer surplus available to tourists from ecotourism in Ciamis. The results are compared with contingent valuation analysis of willingness-to-pay of tourists in their current trip to ecotourism
sites of Ciamis. The result of travel cost method indicates that tourists’ average travel cost is estimated at no more than one hundred
thousand rupiahs. The contingent valuation method concludes that the tourists’ average willingness to pay in their trip to ecotourism sites of Ciamis is are about IDR 6,800 in average.
Key words : travel cost analysis; contingent valuation; non-market valuation; ecotourism; willingness to pay.
How to Cite: Saptutyningsih, E., & Selviana, R. (2017). Valuing Ecotourism of a Recreational Site in Ciamis District of West Java, Indonesia. JEJAK: Jurnal Ekonomi Dan Kebijakan, 10(1), 172-188. doi:http://dx.doi.org/10.15294/jejak.v10i1.9134
© 2017 Semarang State University. All rights reserved
Corresponding author :
Address: Jalan Lingkar Selatan, Tamantirto, Kasihan, Bantul, Yogyakarta 55183, Indonesia
E-mail: [email protected]
INTRODUCTION
The development of ecotourism aims to abolish the impacts of tourism on degrading the environmental and ecological systems. Ecotourism is planned to maintain the ecological health of the travel destinations for offering the visitors and residents opportunities to get multiple services from the nature, and for savoring the livelihoods of local residents. It is important to evaluate ecological services and environmental goods for both utilization and conservation (Costanza et.al., 1997).
One of the area which has ecotourism site in Indonesia is Karangkamulyan, Ciamis District of West Java. Karangkamulyan Site is an archaeological site of historic and archaeological site located in the village Karangkamulyan, Cijeungjing, Ciamis, West Java, Indonesia. This site is a holdover from the days of the Kingdom Galuh patterned Hindu-Buddhist. Area of land of approximately 25 hectares holds the objects that allegedly contains the history of the Kingdom Galuh largely shaped stones. There is as a tourist attraction that not only offers natural beauty, history and fresh atmosphere, it also serves as a place of education and research on the history in the field of archeology. Local government should pay attention for the attraction should receive special attention from the so that the tourists and local people also get the benefits.
In the field of tourism starting from research Cleverdon (1979) reinforced by Pearce (1989) research on the tourism area will not only provide some of the results as soon as the expansion of employment, income generation and a means for the region, but also often a negative impact. Hufsmid (1987) states that all benefits derived from environmental goods and services can be
included in the analysis cost-benefit for the damage caused by economic activity is a cost rather than the activity itself. Davis and Johnson (1987) provides a definition of the valuation of the activities related to the development of the concept and methodology to estimate the value of goods and services. Ecotourism can be classified as public goods-type characteristics, and as such, welfare benefit estimates must employ non-market valuation techniques.
In assessing the environment in tourist areas used Karangkamulyan largest non-market valuation techniques for this attraction included attractions that do not have market value. Non-market valuation techniques is a technique based on the concept wiilingness to pay (WTP) to measure economic benefits by providing an assessment of the environmental goods that also have distinctive properties of public goods (Turner et al. 1994). Non-market valuation techniques using methods of TCM (Travel Cost Method) so that will be known direct use value rating of the attractions Karangkamulyan Site.
uses a zonal TCM to estimate the visitor value component of the consumer surplus, for an urban museum, where the travel cost of substitute sites is included. The TCM used by Martin is typical of many TCMs, in that it excludes zonal demographic variables, which, as explained by Ward and Beal (2000), are often not significant due to aggregation within zones, and thus dropped from the final equations used to estimate demand. Forrest et al. (2000) apply a zonal travel cost model to estimate consumer surplus values for an urban theater. They observed problems with collinearity associated with demographic variables, resulting in a final model which included only two explanatory variables, age, and education, in addition to the travel cost variable.
Method of travel expenses (Travel Cost Method) was performed using the information about the amount of money or costs incurred and time spent to reach a place of recreation for estimating the value of the benefits of the change effort the environmental quality of recreational areas visited (Yakin, 1997). In addition to the costs incurred by tourists there are also factors that can affect the number of tourists to pay a visit to an attraction that is the length of time it takes to travel from their homes to the attraction. If the time to take more and more so the lower the level of traffic and vice versa. In addition to time, there are several socioeconomic variables that can indirectly affect tourists to visit a tourist attraction. The socioeconomic variables including age, sex, education, and income (Mill and Morrison, 1985). Age may indirectly affect tourists to visit an attraction, because of age related to leisure and tourist activities and the ability to conduct visits. The variable income is an important factor to affect the rating in order
to hold a sightseeing trip. Income a person receives will be used to cover all the expenses during excursions, so revenues will affect a person in making decisions. Variable levels of education can affect one's understanding of the psychological needs and curiosity of attractions as well as the motivation to travel.
On the contrary, CV relies on surveys containing hypothetical valuation scenarios in order to generate values for goods that cannot be priced directly through a market (Cummings, Brookshire, and Schulze, 1986). Thus, CV has more flexibility than TC in that a survey can be designed to elicit many different types of values, not only the use value of a specific area such as a national park. Although CV has been applied to developing countries less often than TC (Lindberg and Johnson, 1994), there is growing recognition of the importance of these applications, particularly when results have direct implications for natural resource management and policy. CV has been used to measure total preservation value, which includes both use and non-use components (Echeverria, Hanrahan, and Solorzano, 1995). Use values have been examined through analyses of the explanatory factors influencing WTP for increases in entrance fees and trip costs as well as improvements in park amenities (Abala, 1987; Baldares and Laarman, 1990; Moran, 1994; Shultz, Pinnazo, and Cifuentes, 1997). It is important to note that both CVM and TCM are alternative methods of valuation. CVM is also known as stated-preference method where the respondents just state their preference in a hypothetical situation. On the other hand, the TCM is also called indirect or revealed-preference method and the respondents report what he or she has actually paid.
Relevant literature also shows the superiority of TCM over CVM (Freeman, 1993; Koasa-ard et al. 1995 and Garrod and Willis, 1999; Arin and Sills, 2001; and Ward and Beal; 2000. The present study uses TCM for estimating consumer surplus as well as total consumer value. It also uses CVM to find out how the visitors will behave if the quality of park were improved. Thus a combination of
TCM and CVM is used in this study. This study estimates the value of tourism at the ecotourism sites in Karangkamulyan, Ciamis. The sites are the most visited ecotourism sites in Ciamis. The first method implemented to estimate the use-value is the Travel Cost Method (TCM). By applying TCM, we get the information on the willingness to pay of visitor and the price elasticity of demand estimates. The estimated price and income elasticity coefficients for the ecotourism sites can provide important information to site administrators. The second method utilized in this study is Contingent Valuation Method (CVM), aims to estimate tourists’ willingness to pay to ecotourism sites of Ciamis.
RESEARCH METHODS
This study intend to assess welfare benefits using non-market valuation techniques, i.e., travel cost method (TCM) and contingent valuation method (CVM). For estimating the value of recreational activities, the techniques can be used divided into two main groups, namely revealed preference and stated preference techniques. Revealed preference techniques depend upon the analysis of observable behavior and include the hedonic technique, the travel cost method and demand dependency. Besides that, stated preference techniques are based on individuals’ responses to surveys and questionnaires relating to hypothetical situations. The two main stated preference valuation techniques are choice experiments and contingent valuation.
The consumer surplus can then be deduced by integrating under the demand curve and assessing the area above the price line.
Contingent valuation is a survey-based technique where respondents are explicitly asked how much they are willing-to-pay (WTP) for the use of, or change in quality of, an environmental commodity. With CV studies, the type of question used will have an important effect on results. Open-ended questions have the advantage of giving respondents the possibility of suggesting whatever WTP figure they like but may result in upwardly or downwardly biased answers. Closed-ended questions avoid this problem but can have anchoring effects, meaning that they limit the range of answers the respondent can give and consequently reduce the scope of their answers. Finally, dichotomous choice questions are those most commonly used in practice; respondents are asked if they would be willing-to-pay amount X for an amenity and if so (or if not) would they be willing-to-pay Y as well (instead). It is possible to obtain more information from this type of question format than from the previous two. Strategic behavior on the part of respondents can limit the reliability of CV results. For example, ‘warm glow’ effects can bias results – these occur when individuals offer a higher bid because they feel they are making a contribution to a good cause. Respondents who offer a zero bid may be using their response as a form of protest to the proposed scheme or changes, these are ‘protest bids’ and care should be taken when analyzing results containing these types of answers.
As mentioned above, the TCM enables one to calculate an individual’s Consumer Surplus (CS) by integrating under the demand curve, whereas CV directly uncovers an
individual’s WTP. TCM only takes into account use values whereas CV can consist of the Total Economic Value (TEV) of the environmental amenity, that is, its use and non-use values.9 Use values comprise the utility obtained from direct interaction with the good in question. Non-use values include for instance, bequest value (the option of safeguarding an environmental good for future generations), option value (preserving a good for future direct use) and existence value (the value of knowing a good exists). Consequently, depending on the question posed the results from a contingent valuation analysis can be higher than those from a travel cost model.
the results of the two valuation methods.
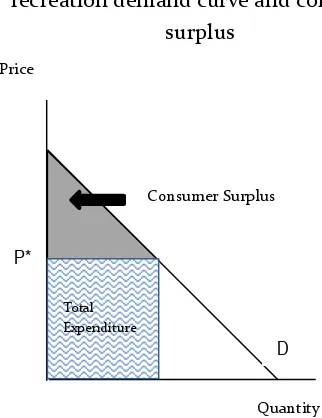
Figure 1. The relation between the recreation demand curve and consumer
surplus
Figure 1 indicates how CS and WTP are related by virtue of there being one demand curve, or more precisely one demand curve per type of person. It depicts a demand curve D and market price P*. The pale shaded area is the total expenditure on a good and the darker area under the demand curve and above the price line is the consumer surplus. In this case, total expenditure consists of travel and on-site costs, averaging P* per visit. The entrance fee that respondents say they are willing-to-pay is an indication of their consumer surplus. If the price of the good or the cost of travel is nil, the total CS will be the entire area under the demand curve and above the x axis up to the maximum quantity of trips.
Travel Cost Method (TCM)
The basic concept of the method of travel cost is time and expenses travel expenses (travel cost expenses) to be paid by the visitors to visit these sights that are hatga access to the sights (Garrod and Willis, 1999). That is called the willingness to pay (WTP),
which is measured by the difference in the cost of travel. Travel Cost is often used to assess a conservation area as well as tourist spots by seeing willingness to pay (willingness to pay) visitors. This approach shows that the value of a conservation area is not only seen by admission alone, but also consider the cost incurred travelers to the location of the region and their potential revenue loss due to the time spent on the visit (Hermawan Badar, 2012).
Travel Cost methods (TCM) can be said to be the oldest method for the measurement of indirect economic value of natural resources. This method is derived from the idea developed by Hotelling in 1931, which was then formally introduced by Wood and Trice (1958) as well as Clawson and Knetsh (1975). This method is mostly used to analyze the request to outdoor recreation (outdoor recreation), such as fishing, hunting, hiking and so forth (Fauzi 2006).
In principle, this method of assessing the cost of each individual to come to a place of recreation, such as fishing hobby or recreation on the beach, someone will sacrifice cost in time and money to come to the venue. By knowing the pattern expenditure of consumers, it will be studied how much value (value) given to consumers of natural resources and the environment. Thus, according to Fauzi (2010) this method can be used to measure the benefits and costs as a result of: (i) changes in the cost of access (entrance fee) for a recreation area; (Ii) the addition of new recreation areas; (Iii) changes in environmental quality recreational areas; and (iv) the closure of existing facilities. The basic goal of TCM is to know the value of the use of natural resources through a proxy approach. In other words, the costs incurred to consume services from natural resources are used as a proxy to determine the price of the natural resource.
According Hanley and Spash (1993), and Willis and Garrod (1991) in general there are two
Total Expenditure
Price
Consumer Surplus
Quantity P*
simple techniques that are used to determine economic value based on TCM, namely: (i) simple approach through zoning; and (ii) an individual approach. TCM approach through zoning approach is relatively simple and inexpensive because the necessary data are relatively more reliant on secondary data and some simple data from respondents at the time of the survey. In this technique, the recreational beach is divided into several zones visits and required data on the number of visitors per year to obtain data on visits per thousand inhabitants. By obtaining this data and the data of distance, travel time, as well as the cost of each trip per unit distance (per km), it will obtain the overall cost of travel and the demand curve for visits to tourist attractions.
Some of the basic assumptions that have to be built so that an assessment of the natural resources are not biased by TCM as proposed by Haabdan McConnel (2002) referred to under Fauzi (2010), among others: (i) the cost of travel and time costs are used as a proxy on the price of recreation; (Ii) travel time is neutral, meaning not produce utility or disutility; and (iv) the cost of the trip is a journey of a single (not multiple travel). In addition, according to Fauzi (2010), TCM should be built on the assumption that each individual has only one purpose for visiting tourist destination so as not analyze multiple aspects of the visit (multipurpose visit). Furthermore, the visitors or the individual must also be distinguished where they came to sort out the visitors who come from the local area (population around the tourist sites). To see the total cost of travelers and further to be used as a proxy in determining the price of natural resources by setting the demand function. Simply put, the demand function above can be written as follows:
Vij = f (Cij, TIJ, Qij, Sij, Mi) Where :
Vij = frequency of visits by individual i to point j, Ij = travel expenses incurred by individuals to
visit the site i j,
TIJ = cost of time spent by individuals to visit the site i j,
Qij = respondents' perceptions of the quality of the environment of the place visited, Sij = substitution characteristics that may exist
elsewhere,
Mi = revenue (income) of individual i.
There are wide varieties of empirical models have been devised to estimate willingness to pay based on travel cost models (Smith and Kaoru, 1990). These models have ranged from simple gravity models (Freund and Wilson, 1974) to complex multinomial logit, random utility models (Kaoru, Smith and Lieu, 1994). Recently, modelling the role that site quality and characteristics play in determining demand for specific sites has received much attention. Kling (1986) reviews the various theoretical and empirical models for incorporating site characteristics in multiple-site, travel cost models.
elegant restaurant. Establishing this assumption, however, need further research into the decision process involved in choosing ecotourism destinations.
For estimating typical trip models differ in the definition of the dependent variable. The dependent variable is defined as either the sum of all visits to the ecotourism site. We employ the first approach, determining the total number of visits to all sites by each individual as a function of the average travel cost and quality characteristics of the ecotourism site visited and socio-economic variables such as age, income, education, etc. The demand function of the following general form was estimated:
𝑋𝑖 = 𝛼0+ 𝛼1𝑇𝐶 + 𝛼2𝑠𝑜𝑠𝑒𝑐𝑖+ 𝛼3𝑞𝑢𝑎𝑙𝑖𝑡𝑦𝑖+ 𝑒𝑖
Xi is the number of visit individual i
takes to the Consistent with demand theory, Consistent with demand theory, in last one year; TC is travel cost for visit to the ecotourism site visited by i; sosec is vector of socio-economic characteristics; quality is subjective perception on quality of ecotourism sites in general. For collecting the data, we conduct a survey. Respondents were asked to provide information about their visit such as “How many times have you visited this ecotourism site in the last one year?”.
Contingent Valuation Method (CVM)
Based on Hanemann’s (1984) approach, we develop the empirical CVM model for estimating the average willingness to pay from answers to the referendum style of contingent valuation questions used in the present survey. Mitchell & Carson (1989) describe the pros and cons of the referendum and alternative CVM question formats. Referendum CVM questions divide the sample into a discrete number of sub-samples.
Tourists were approached by a surveyor who introduced him/her-self and the study first and then asked them if they were willing to participate in the survey, then propose their willingness to participate in the survey. If a visitor was not willing to participate, then the surveyor approached the next available visitor. There was approximately 15% of visitor reject to join the survey. If a visitor was willing to participate in the survey, the questionnaire on a clip board was given to him or her to fill out. The questionnaire was collected by the surveyor once it was done onsite. Similar onsite survey method has been used by recent contingent valuation studies (Lee and Han 2002; Togridou et al. 2006). In this study, respondents were first asked they were willingness to pay for their experiences to ecotourism sites, such as the ecotourism sites in Karangkamulyan, Ciamis. Respondents with “yes” answer were asked to provide the amount money they would willing to pay as a fee per trip if they had to pay for enjoying the ecotourism sites.
One common approach towards econometric analysis of payment card data is to use the interval midpoints as the true unobserved WTP values and to use these values as the dependent variable in an ordinary least squares (OLS) regression model (Cameron and Huppert, 1989). However, neglecting the fact that the midpoints are not necessarily to expect values within the intervals, this method may provide biased regression coefficients. We employed a more efficient maximum likelihood estimation method for estimating the parameters of a WTP function described by Cameron and Huppert (1989). The non-negative nature and the frequently skewed distribution of valuations have induced researchers to assume a lognormal conditional distribution for valuations (Cameron and Huppert 1989; Legget et al., 2003). The lognormal WTP function for the
log(𝑊𝑇𝑃𝑖) = 𝑌𝑖′𝛽 + 𝑍𝑖+ 𝜀𝑖,
Yi is a vector of social demography characteristics; Z is perception of sites quality in general; and N(0,2). If the respondent’s
true valuation, WTPi, is known to lie within the interval (ti, ti+1), then log(WTPi) will lie between log(ti) and log(ti+1). Each pair of individual thresholds for log(WTPi) can then be standardized to state the probability that
where zi is the standard normal random variable and
is the cumulative standard normal density function. With the assumed lognormal distribution of valuations, the median of an individual’s conditional WTP distribution was estimated as the anti-log ofthat individual’s predicted log(WTP)
(Cameron and Huppert, 1989). The mean of
WTP, for each individual, was obtained by scaling the median by exp(2/2). The median
and mean WTP per trip for the ecotourism sites in Karangkamulyan, Ciamis.were estimated by averaging across all tourists in the sample.
Data and Econometric Model
For estimating demand function, the basic assumptions needed include: sufficient variation in prices or travel costs to identify the demand function, inclusion of relevant variables, such as income and other demographic variables, then, there is no
shortage of the site in question or that congestion is not limiting use (Rosenthal et al., 1984). Most of the data used in our analysis are derived from a survey of tourists in the ecotourism sites of Karangkamulyan. for this study, we use 150 observations.
There are three functional forms were employed to estimate the econometric model of the Karangkamulyan visitor demand. The estimated models were then used to derive welfare measures for the annual average visitor. The three functional forms estimated are linear; semi-log where the dependent variable is transformed by taking the natural logarithm; and the third is a log-log model where both the dependent and continuous independent variables are transformed by taking the natural logarithms. The econometric models of this study are defined as follows:
Linear Model : visiti =β0 + dummy variable (1=male;0=female); quality is dummy variable which is the subjective
perception on site’s quality (1=good; 0=bad);
educ is schooling year; εi is the normally
distributed, random-error component with a mean of zero and a variance of . The parameters to be estimated are: β0, β1, β2, β3, β4,
β5, and β6. Table 2 provides the summary
We expected travels costs to be inversely related to the number of visitors which consistent with demand theory. Our expectations regarding the demographic variables were less definitive, given the uniqueness of the study site. However, typically we expect a positive relationship between the number of visits and income for a ecotourism sites as indicated by numerous cultural heritage studies in Europe (Ready and Navrud 2002).
We applied a Box-Cox test (Ziemer et al. 1980) to test the hypothesis of linear versus semi-log functional forms. The test statistic LAMBDA was equal to 0.00, specifying that the semi-log functional form (using the natural logarithm of the dependent variable) was a better fit for our data than the linear form. As we will show, the Box-Cox test result is consistent with the econometric estimation results presented in Table 2. The semi-log functional form consistent with the Box-Cox test, has been used with other TCM studies (Willis and Garrod 1991; Hanley 1989).
The important advantages of using the semi-log functional form include minimizing the problem of heteroscedasticity, as well as eliminating the potential problem of negative trip prediction, which can occur using a linear functional form (Loomis and Cooper, 1990). This is also true with the third model or the log-log functional form estimated for this site. Using a Breusch-Pagan test for heteroskedasticity, we found that by using either the semi-log or log-log functional forms, we failed to reject the null hypothesis of homoscedasticity at a significance level of 1%.
In this study, willingness to pay (WTP) for urban forests was modeled as a function of demographic characteristics, perceptions of tourism attribute importance and performance. The following functional
relationship was estimated using maximum likelihood technique.
log(WTPi)=f(Agei, Genderi, Educationi, Incomei,
Qualityi)
where age, gender, education, income of tourists, and quality perception were included in the model to control for demographic variables that may influence WTP.
RESULTS AND DISCUSSION
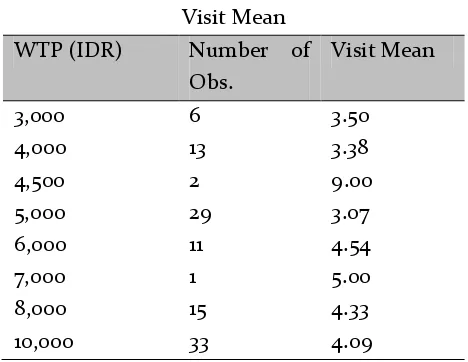
Table 1 shows the distribution of the willingness to pay (WTP) answers and the corresponding visit rates. The respondents were asked to state their maximum willingness to pay (WTP) for entering the Karangkamulyan site. Column 1 indicates the WTP (in IDR) for entering whereas the visit rate is shows in column 3.
Table 1. Willingness To Pay (WTP) and Visit Mean
WTP (IDR) Number of Obs.
Visit Mean
3,000 6 3.50
4,000 13 3.38
4,500 2 9.00
5,000 29 3.07
6,000 11 4.54
7,000 1 5.00
8,000 15 4.33
10,000 33 4.09
The data used in our analysis are derived from a survey of tourists in the ecotourism sites of Karangkamulyan. The on-site survey questionnaire included a series of question on: the costs of the trip; willingness to pay for visiting the ecotourism sites of Karangkamulyan; and socio-demographic background. Summary statistics from the collected data are presented in Table 2.
Table 2 shows that the average number of visits to ecotourism sites is about four times. The average willingness to pay for visiting there was about IDR 6,800. For visiting ecotourism sites need travel cost was about IDR 42,850. Average income per month of respondents was about IDR 2,511,050. The mean age of respondents was 28 years old in average. The average years of schooling which obtained by respondent was about 12 years.
Table 2. Variable summary statistics
Variable Explanation The ecotourism sites
Mean Standard
deviation
VISIT Number of visit 3.845 2.585
WTP Willingness to pay of respondent 6,790.91 2,460.124
COST Travel cost 42,836.36 33,019.60
INCOME Income per month 2,511,045 1,270,311.33
AGE Age of respondent 28.127 12.265
GENDER =1 if respondent is a man 0.527 0.501 EDUC Years of Schooling of respondent 11.264 2.547
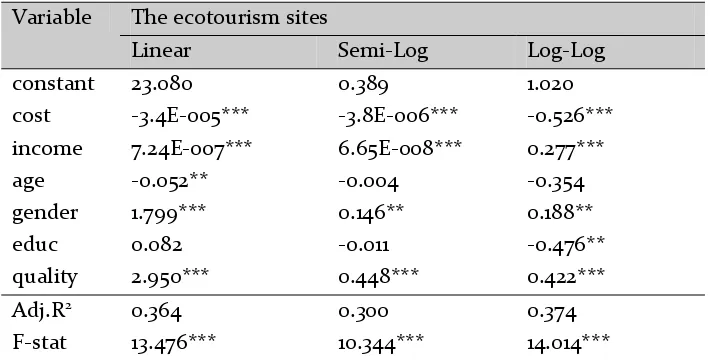
Table 3. Regression result for alternative functional formsa
Variable The ecotourism sites
Linear Semi-Log Log-Log
constant 23.080 0.389 1.020
cost -3.4E-005*** -3.8E-006*** -0.526*** income 7.24E-007*** 6.65E-008*** 0.277***
age -0.052** -0.004 -0.354
gender 1.799*** 0.146** 0.188**
educ 0.082 -0.011 -0.476**
quality 2.950*** 0.448*** 0.422***
Adj.R2 0.364 0.300 0.374
F-stat 13.476*** 10.344*** 14.014***
aDependent variable, the number of visits, is the natural logarithm of for the semi-log
and log-log models.
Travel Cost Method
The Ordinary Least Squares estimation results for each of the functional forms presented in three equations above were included in Table 3. Consistent with the previously noted Box-Cox test, the semi-log equation provided a better fit for the data than the linear specification.
In addition, a joint F-test of the explanatory variables indicated that the semi-log and semi-log-semi-log and the linear models were significant overall at the 1% level. As expected with the linear model, we rejected the null hypothesis of homoskedasticity using the Breusch–Pagan test. As such, White’s consistent standard errors are reported for the linear model in Table 3, and used to test the null hypotheses that the coefficient estimates are equal to zero.
With respect to the coefficient estimates of the ecotourism travel cost model, the price or travel cost coefficient estimate for each of the three model specifications, was consistent with demand theory which was inversely related to price or travel cost. The coefficient estimate associated with the travel cost variable was significantly different from zero at a 1% level for the linear, semi-log and log-log model. The coefficient of income variable was also significantly different from zero at the 1% level, for the linear, semi-log and log-log model specifications. The gender coefficient estimates were significantly different from zero at the 5% level for all models. The sign on the gender coefficient estimate was positive in all three model specifications, indicating more visitor of the ecotourism were male.
The age coefficient estimates were negative for all three models, but significantly
different from zero at the 5% level for the linear model and not significant for semi-log and log-log models. The years of schooling (educ) was significantly different from zero at 5% level in the log-log model. The sign on the years of schooling (educ) coefficient estimate was negative in the log-log model specifications, indicating that higher education, less visit to Karangkamulyan sites. The subjective quality perception was significantly different from zero at 1% level for the all three models.
Elasticity coefficient estimates provide information with regard to the visitor responsiveness to small changes in prices (both, entrance fees or travel cost components) or income, and can be useful to site administrators. Price and income elasticity coefficients for each of the models are presented in Table 3.1 For the
linear and semi-log of the regression models, the elasticity coefficients are evaluated at the variable means. The price elasticity coefficients of the ecotourism site regression model for the linear, semilog, and loglog models are -0.00038; -0.1627; and -0.526 respectively, indicating an inelastic demand such that a one percent increase in travel costs results in a corresponding less than one percent decline in the number of visits to ecotourism site for all three model specifications. However, both price and income elasticity coefficients for all regression model specification are slightly less inelastic.
categorize the site in economic terminology as a normal good, in that as visitor incomes increase, visitors are more likely to prefer spending money on ecotourism site.
Table 4. Price and Income Elasticity Coefficient Estimates
Functional form Ecotourism Site TC price Elasticity
Income Elasticity
Linear -0.00038 0.00047
Semi-Log -0.1627 0.1669
Log-Log -0.526 0.277
The welfare measures for each models are summarized in Table 5. Ward and Beal (2000) provide a summary of the formula used to estimate welfare measures for various visitor demand model functional forms using travel cost models2.The individual consumer
surplus estimates measure the value that the average visits to the ecotourism site is willing
to pay, but do not have to pay to visit the site, given an average access cost of IDR782.6 million.
Table 5. Consumer Surplus Estimates for the Ecotourism Site (Rupiahs)
Functional form Consumer Surplus
Linear 2,218,000
Semi-Log 3,483,000
Log-Log 3,112,300
The welfare estimates for this analysis are presented in Table 5. The consumer surplus estimates for individual visitors of the ecotourism site are IDR2,218,000; IDR3,483,000; and IDR3,112,300 for the linear, semi-log and log-log models, respectively. It is important to note that the functional form chosen for the visitor. It is important to remember that TCM estimate the nonmarket benefits to individual users of the site, and that stated preference non-market valuation methods must be employed to estimate the non-use external benefits (Ready and Navrud, 2002).
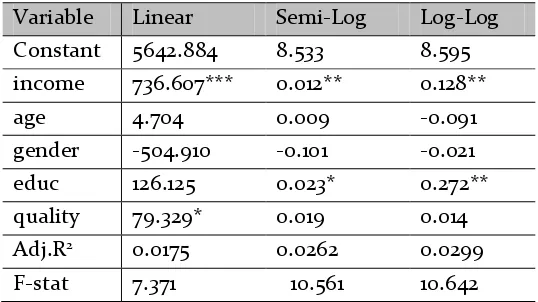
Table 6. Regression Result for Alternative Functional Formsa
Variable Linear Semi-Log Log-Log Constant 5642.884 8.533 8.595 income 736.607*** 0.012** 0.128**
age 4.704 0.009 -0.091
gender -504.910 -0.101 -0.021
educ 126.125 0.023* 0.272**
quality 79.329* 0.019 0.014
Adj.R2 0.0175 0.0262 0.0299
F-stat 7.371 10.561 10.642
aDependent variable, willingness to pay for ecotourism site, is the natural logarithm of for the
Contingent Valuation Method (CVM)
In the CVM section of the tourist survey, visitors were provided with background information about ecotourism site such as the natural, tradition, purpose of the sites, educational facilities, etc. They were then asked if they would have been willing to pay more for their current trip to the sites to include a visit to their itinerary. The linear specification which provided the best fit with the data, is presented in Table 6.
Willingness to pay of visitors in the ecotourism site was approximately IDR6,800 in average, (see Table 2). WTP estimation results for three model specification of the ecotourism site is given in Table 5.
Coefficients of age and gender of tourists were not significant (see Table 5). Coefficient of education was significant with positive sign for semi-log (significantly different from zero at level 10%) and log-log model. This indicates that the higher the education, the more visit to ecotourism sites will be. Income of visitor had a small but positive and significant influence on WTP.
CONCLUSION
Our results show that consumer surplus welfare estimates can vary significantly depending on the functional form used to estimate visitor demand. Our results show that the consumer surplus estimates for individual visitors of the ecotourism site are IDR2,218,000; IDR3,483,000; and IDR 3,112,300, for the linear, semi-log and log-log models, respectively. The estimated price and income elasticity coefficients for the ecotourism site can provide important information to site administrators.
We find that price elasticity of demand estimates and visitors of ecotourism site were slightly not responsive to price changes and thus, the site’s administrator should use
alternative way to attract their visitors. We also find positive income elasticity, which suggests marketing efforts toward potential higher income visitors were recommended, to the visitors from higher income zones of origin, are more likely to visit the ecotourism site. Although estimates of visitor benefits are informative, recall one major concern with TCM is the estimation of visitor-use benefits only, and in the case of cultural heritage sites, non-use benefits may be substantial (Ready and Navrud, 2002).
In order to investigate the non-use value of benefits associated with the ecotourism sites, additional non-market valuation techniques must be employed, of which the contingent valuation method is the most logical choice. Therefore, this study was also use contingent valuation method to estimate the willingness to pay (WTP) of visitors of the ecotourism sites. The function of visitors’ demographic characteristics, and perceptions of the ecotourism sites quality were examined. Willingness to pay of visitors in the ecotourism sites are about IDR6,800 and in average. The results indicate that WTP would be higher among visitors with longer years of schooling. It also seems that there was positive relationship between income and willingness to pay. One possible explanation might be the location of the ecotourism sites in the central of Yogyakarta City which might be attractive to higher income. The following section discusses some of the possible reasons behind the failure to assign a link between the results of the contingent valuation method (CVM) and travel cost method (TCM).
answer. It’s about 30% of responses are zero bids. This may be due to the fact that the respondents did not seriously consider the question.
Our results show that by applying travel cost method, the elasticity of demand estimates, visitors of ecotourism were slightly not responsive to price changes and thus, the site’s administrator should use alternative way to attract their visitors. We also find positive income elasticity, which suggests marketing efforts toward potential higher income visitors were recommended, to the visitors from higher income, are more likely to visit the ecotourism.
This study was also use contingent valuation method to estimate the willingness to pay (WTP) of visitors of the ecotourism. The function of visitors’ demographic characteristics, and perceptions of the ecotourism sites’ quality were examined. Willingness to pay of visitors in the reliable results in this analysis because of an open-ended question which intended a large a large variability in responses are not constrained by set range of answer. The problem with using open-ended questions is that people will have a tendency to choose the first number that comes to mind. When people were inquired how much they would willing to pay, they didn’t refer to their personal valuation of sites access but to what fee they might have paid in the past or in really consider the question, and gave the most common figure they could think of or an estimate of their spare cash holdings. Either way it seems that the WTP technique needs to be employed in a manner if it is to be reliable and lead to unbiased results. It would not be recommended to base policy formulations on the results of a CVM. The results of the travel cost method are also based on a number of assumptions but are nevertheless a result of the revealed choices of visitors and would be more sound.
REFERENCES
Arin, T. and E. Sills. (2001). “Developing Tourism to
National Parks in the Republic of Georgia”, World
Bank, Washington, D.C.
Badar, Hermawan, (2012),”Valuasi Ekonomi Pasca Erupsi
Merapi Terhadap Sektor Pariwisata Di Candi Borobudur Jawa Tengah Pendekatan Travel Cost
Method”, Skripsi, Yogyakarta: Universitas
Muhammadiyah Yogyakarta.
Cameron, T.A., Huppert, D.D. (1989). ‘OLS versus ML
Estimation of Non-Market Resource Values with
Payment Card Interval Data.’ Journal of
Environmental Economics and Management 17 (3):
230–246.
Clawson, M and J.L. Knetsch. (1975). Economic of Outdoor Recreation. Third Printing. The John Hopkins Press. Baltimore.
Cleverdon, R. (1979) The economic and social impact of international tourism on developing countries. Special Report No. 60. Economic Intelligence Unit. Costanza, R., D'Arge, R., De Groot, R., Farber, S., Grasso, M.,
Hannon, B., Limburg, K., Naeem, S., O'Neill, R.V., Paruelo, J., Raskin, R.G., Sutton, P., and Van Den
Belt, M. (1997). ‘The value of the world's ecosystem
services and natural capital’, Nature, Vol 387, pp
253-260. Damodar, N. Gujarati. 1995. Basic Econometrics.
Third Edition. McGraw Hill New York.
Davis, L. and Johnson, N. (1987). Forest Management. 3d ed. New York: McGraw-Hill: 790.
Durojaiye, B.O. and A.E. Ipki. (1988). “The monetary
value of recreational facilities in a developing
country: a case study of three centres in Nigeria”,
Natural Resources Journal 28: 315-328.
Echeverria, J., Hanrahan, M.and Solorzano, R.(1995).
“Valuation of non-priced amenities provided by
the biological resources within the monterverde
cloud forest preserve”, Costa rica. Ecological
Economics.13:43-52.
Fauzi A. 2006. Ekonomi Sumber Daya Alam dan Lingkungan. Jakarta (ID): Gramedia Pustaka Utama.
Freeman, A.M., (1993). The measurement of environmental and resource values: theory and methods. Resources for the Future, Washington DC.
Freeman, A. Myrick III. (1993). The Measurement of Environmental and Resource Values: Theory and Methods, Washington, D.C: Resources for the Future, Inc.
Forrest ,D., Grime, K., and Woods, R. (2000). “Is It
Worth Subsidizing Repertory Theatre?” Oxford
Economic Papers 52: 381–397
Freund, J.R. and R.R. Wilson, (1974). “An Example of a
Gravity Model to Estimate Recreation Travel,”
Journal of Leisure Research 6 (Summer). 241-256.
Garrod, Guy and K.G. Willis, (1999). Economic Valuation of the Environment: Methods and Case Studies, Cheltenham, UK and Northampton, MA, USA: Edward Elgar.
Haab, Timonty and K.E. McConnel. (2002). Valuating and Natural Resources: The Econometric of Non Market Valuation. Edward Elgar. USA.
Hanemann, M. W. (1984). “Welfare Evaluations In
Contingent Valuation Experiments with Discrete
Responses.” American Journal of Agricultural
Economics, 66: 332−341.
Hanley, N.D. (1989).’Valuing Rural Recreation Benefits:
An Empirical Comparison of Two Approaches’.
Journal of Agricultural Economics 40(3): 361–374.
Hanley, N and Spash, CL (1993). Cost-Benefit Analysis and the Environment. Edward Elgar: Vermont, 278.
Hufschmidt, M.M., D.E James., A.D. Meister. (1987). Environmental, Natural Systems, and Development, An Economic Valuation Guide. The John Hopkins University Press.
Kaosa-ard, M., D. Patmasiriwat, T. Panayotou, and J.R.
Deshazo, (1995). “Green financing: valuation and financing of Khao Yai National Park in Thailand”,
Thailand Development Research Institute, Bangkok.
Karsinah. (2013). “Identifikasi Keluarga Miskin di Sektor Pertanian dan Non Pertanian Kabupaten Bantul.”
JEJAK Journal of Economics and Policy, 6(2): 103-213
doi: 10.15294jejak.v7i1.3596.
Kling, C. L., (1986). Measuring the Recreational Benefits of Environmental Amenities Using Multiple Site Models: An Evaluation of Techniques. University of Maryland, College Park, MD., PhD Dissertation.
Lindberg, K. and R.L. Johnson, (1994). ‘Estimating demand
for ecotourism sites in developing nations’, Trends
31: 10-15.
Loomis, John and Cooper, Joseph (1990). “Comparison of
Environmental Quality-Induced Demand Shifts Using Time-Series and Cross-Section Data”. Western
Journal of Agricultural Economics 15(1): 83–90.
Martin, F. (1994) “Determining the Size of Museum
Subsidies”. Journal of Cultural Economics 18: 225–
270.
Mitchell R. C. and R. T. Carson (1989), Using surveys to value public goods, the contingent valuation method, Resources for the Future, Washington D.C., 1989
Mungatana, E.D. and S. Navrud, (1994). “Environmental valuation in developing countries: the recreational
value of wildlife viewing”, Ecological Economics 11:
135-151.
Lee, C.-K., Han, S.-Y., (2002). “Estimating the use and
preservation values of national parks’ tourism
resources using a contingent valuation method”.
Tourism Management 23, 531–540.
Legget, C.G., Kleckner, N.S., Boyle, K.G., Duffield, J.W.,
Mitchell, R.C., (2003). “Social desirability bias in
contingent valuation surveys administered through
inperson interviews.” Land Economics 79, 561–575
Mill, R. C., & Morrison, A. M. (1985). The tourism system: An introductory. Engelwood Cliffs, N.J.: Prentice Hall.
Pearce, D. (1989). Tourist development (2nd ed.). London: Longman Scientific & Technical.
Pearse, P.H., (1968). “A new approach to the evaluation of
non-priced recreational resources”, Land Economics
11: 135-151.
Ready, Richard C. and Navrud, St˙ale . (2002). “’Methods for Valuing Cultural Heritage’ in St˙ale Navrud and
Richard C. Ready (eds.). Valuing Cultural Heritage: Applying Environmental Valuation Techniques to
Historic Buildings, Monuments and Artifacts.
Edward Elgar, Cheltenham.
Rosenthal, Donald H., Loomis, John B., and Peterson,
George L. (1984) “The Travel Cost Model: Concepts
Agriculture Forest Service General Technical Report RM-109, Fort Collins, CO.
Smith, V. K. and Kaoru, Y., (1990). “What have we learned since Hotelling’s Letter? A Meta
Analysis”. Economics Letters, 32: 267-272.
Tobias, D. & Mendelsohn, R., (1991). “Valuing
ecotourism in a tropical rain forest reserve.”
Ambio, 20, 91−93
Togridou, A., Hovardas, T., Pantis, J.D., (2006).
“Determinants of visitors’ willingness to pay for the National Marine Park of Zakynthos, Greece.”
Ecological Economics 60, 308–319.
Turner, R.K., Pearce, D.W., and Bateman, I.J. (1994). Environmental Economics: An Elementary Introduction. Hemel Hempstead: Harvester Wheatsheaf.
Ward, Frank A. and Beal, Diana. (2000). Valuing Nature
with Travel Cost Models: A Manual. Edward
Elgar, Northampton, MA.
Wennergen, E.B., (1964). “Valuing non-market priced
recreational resources.” Land Economics 40:
234-241.
Willis, K.G. and Garrod, G.D. (1991). “An Individual Travel
-Cost Method of Evaluating Forest Recreation’.
Journal of Agricultural Economics 42(1): 33–42.
Wood, S. and Trice, A., (1958). "Measurement of Recreation Benefits". Land Economics, 34:195-207
Yakin, A. 1997. Ekonomi Sumberdaya dan Lingkungan. Teori dan Kebijakan Pembangunan Berkelanjutan. Jakarta : Akademika Presindo.
Ziemer, Rod F., Musser, Wesley N., and Hill, R. Carter.
(1980). “Recreation Demand Equations: Functional
Form and Consumer Surplus”. American Journal of