Lampiran 1
Analisis statistik menggunakan SPSS 16.0
a.
Data TPC bakteri pada senyawa hidrokarbon alifatik
NPar Tests
One-Sample Kolmogorov-Smirnov Test
ISOLAT WAKTU TPC
N 63 63 63
Normal Parametersa Mean 4.00 3.3333 8.3603
Std. Deviation 2.016 2.89047 2.89246
Most Extreme Differences Absolute .125 .231 .283
Positive .125 .213 .156
Negative -.125 -.231 -.283
Kolmogorov-Smirnov Z .993 1.834 2.248
Asymp. Sig. (2-tailed) .277 .002 .000
a. Test distribution is Normal.
Oneway
Test of Homogeneity of Variances
TPC
Levene Statistic df1 df2 Sig.
ANOVA
TPC
Sum of Squares df Mean Square F Sig.
Between Groups 367.064 6 61.177 22.592 .000
Within Groups 151.647 56 2.708
Total 518.711 62
Robust Tests of Equality of Means
TPC
Statistica df1 df2 Sig.
Brown-Forsythe 22.592 6 14.732 .000
a. Asymptotically F distributed.
Post Hoc Tests
Multiple Comparisons
TPC
Games-Howell
(I) ISOLAT
(J) ISOLAT
Mean Difference
(I-J) Std. Error Sig.
95% Confidence Interval
Lower Bound Upper Bound
OA2E1 SA1A .27778 .36772 .986 -.9888 1.5444
OA2G .32222 .58161 .997 -1.6717 2.3162
OA2E2 .46667 .34721 .819 -.7598 1.6931
MB1C -.10000 .36132 1.000 -1.3528 1.1528
SA2A -.02222 .50464 1.000 -1.7250 1.6805
OA1E 7.03333* 1.27279 .004 2.3174 11.7493
SA1A OA2E1 -.27778 .36772 .986 -1.5444 .9888
OA2G .04444 .52561 1.000 -1.8453 1.9341
OA2E2 .18889 .24197 .984 -.6288 1.0066
SA2A -.30000 .43892 .991 -1.8464 1.2464
OA1E 6.75556* 1.24820 .006 2.0472 11.4639
OA2G OA2E1 -.32222 .58161 .997 -2.3162 1.6717
SA1A -.04444 .52561 1.000 -1.9341 1.8453
OA2E2 .14444 .51147 1.000 -1.7313 2.0202
MB1C -.42222 .52116 .978 -2.3068 1.4624
SA2A -.34444 .62905 .997 -2.4653 1.7764
OA1E 6.71111* 1.32705 .005 1.9466 11.4756
OA2E2 OA2E1 -.46667 .34721 .819 -1.6931 .7598
SA1A -.18889 .24197 .984 -1.0066 .6288
OA2G -.14444 .51147 1.000 -2.0202 1.7313
MB1C -.56667 .23214 .246 -1.3483 .2150
SA2A -.48889 .42189 .895 -2.0111 1.0333
OA1E 6.56667* 1.24231 .008 1.8586 11.2748
MB1C OA2E1 .10000 .36132 1.000 -1.1528 1.3528
SA1A .37778 .26182 .772 -.5004 1.2560
OA2G .42222 .52116 .978 -1.4624 2.3068
OA2E2 .56667 .23214 .246 -.2150 1.3483
SA2A .07778 .43358 1.000 -1.4600 1.6156
OA1E 7.13333* 1.24633 .004 2.4251 11.8415
SA2A OA2E1 .02222 .50464 1.000 -1.6805 1.7250
SA1A .30000 .43892 .991 -1.2464 1.8464
OA2G .34444 .62905 .997 -1.7764 2.4653
OA2E2 .48889 .42189 .895 -1.0333 2.0111
MB1C -.07778 .43358 1.000 -1.6156 1.4600
OA1E 7.05556* 1.29516 .004 2.3244 11.7867
OA1E OA2E1 -7.03333* 1.27279 .004 -11.7493 -2.3174
SA1A -6.75556* 1.24820 .006 -11.4639 -2.0472
OA2E2 -6.56667* 1.24231 .008 -11.2748 -1.8586
MB1C -7.13333* 1.24633 .004 -11.8415 -2.4251
SA2A -7.05556* 1.29516 .004 -11.7867 -2.3244
*. The mean difference is significant at the 0.05 level.
b.
Data pH media kultur dengan senyawa hidrokarbon alifatik
NPar Tests
One-Sample Kolmogorov-Smirnov Test
ISOLAT WAKTU pH
N 63 63 63
Normal Parametersa Mean 4.00 3.3333 6.7905
Std. Deviation 2.016 2.89047 .32165
Most Extreme Differences Absolute .125 .231 .298
Positive .125 .213 .173
Negative -.125 -.231 -.298
Kolmogorov-Smirnov Z .993 1.834 2.367
Asymp. Sig. (2-tailed) .277 .002 .000
a. Test distribution is Normal.
Oneway
Test of Homogeneity of Variances
pH
Levene Statistic df1 df2 Sig.
ANOVA
pH
Sum of Squares df Mean Square F Sig.
Between Groups .065 6 .011 .096 .996
Within Groups 6.349 56 .113
Total 6.414 62
Post Hoc Tests
Homogeneous Subsets
pH
Duncan
ISOLAT N
Subset for alpha = 0.05
1
OA2E1 9 6.7444
OA1E 9 6.7556
SA1A 9 6.7889
OA2E2 9 6.7889
SA2A 9 6.7889
OA2G 9 6.8222
MB1C 9 6.8444
Sig. .594
Means for groups in homogeneous
c.
Data TPC bakteri pada senyawa hidrokarbon monoaromatik
NPar Tests
One-Sample Kolmogorov-Smirnov Test
ISOLAT WAKTU TPC
N 63 63 63
Normal Parametersa Mean 4.00 3.3333 8.7587
Std. Deviation 2.016 2.89047 1.65155
Most Extreme Differences Absolute .125 .231 .121
Positive .125 .213 .083
Negative -.125 -.231 -.121
Kolmogorov-Smirnov Z .993 1.834 .958
Asymp. Sig. (2-tailed) .277 .002 .317
a. Test distribution is Normal.
Oneway
Test of Homogeneity of Variances
TPC
Levene Statistic df1 df2 Sig.
1.576 6 56 .171
ANOVA
TPC
Sum of Squares df Mean Square F Sig.
Between Groups 20.722 6 3.454 1.303 .271
Within Groups 148.391 56 2.650
Post Hoc Tests
Homogeneous Subsets
TPC
Duncan
ISOLAT N
Subset for alpha = 0.05
1 2
OA2E1 9 7.7333
MB1C 9 8.2778 8.2778
OA2E2 9 8.6444 8.6444
OA1E 9 8.8667 8.8667
SA1A 9 8.9889 8.9889
SA2A 9 9.1556 9.1556
OA2G 9 9.6444
Sig. .110 .125
Means for groups in homogeneous subsets are displayed.
d.
Data pH pada media kultur dengan senyawa hidrokarbon monoaromatik
NPar Tests
One-Sample Kolmogorov-Smirnov Test
ISOLAT WAKTU pH
N 63 63 63
Normal Parametersa Mean 4.00 3.3333 6.8238
Std. Deviation 2.016 2.89047 .13879
Most Extreme Differences Absolute .125 .231 .231
Positive .125 .213 .219
Negative -.125 -.231 -.231
Asymp. Sig. (2-tailed) .277 .002 .002
a. Test distribution is Normal.
Oneway
Test of Homogeneity of Variances
pH
Levene Statistic df1 df2 Sig.
.115 6 56 .994
ANOVA
pH
Sum of Squares df Mean Square F Sig.
Between Groups .012 6 .002 .095 .997
Within Groups 1.182 56 .021
Total 1.194 62
Post Hoc Tests
Homogeneous Subsets
pH
Duncan
ISOLAT N
Subset for alpha = 0.05
1
OA2E2 9 6.8000
SA2A 9 6.8111
MB1C 9 6.8222
SA1A 9 6.8333
OA2G 9 6.8333
OA2E1 9 6.8444
Sig. .583
Means for groups in homogeneous subsets are displayed.
e.
Data TPC bakteri pada senyawa hidrokarbon poliaromatik
NPar Tests
One-Sample Kolmogorov-Smirnov Test
ISOLAT WAKTU TPC
N 63 63 63
Normal Parametersa Mean 4.00 3.3333 10.6111
Std. Deviation 2.016 2.89047 2.73697
Most Extreme Differences Absolute .125 .231 .152
Positive .125 .213 .119
Negative -.125 -.231 -.152
Kolmogorov-Smirnov Z .993 1.834 1.205
Asymp. Sig. (2-tailed) .277 .002 .110
a. Test distribution is Normal.
Oneway
Test of Homogeneity of Variances
TPC
Levene Statistic df1 df2 Sig.
ANOVA
TPC
Sum of Squares df Mean Square F Sig.
Between Groups 21.251 6 3.542 .448 .844
Within Groups 443.191 56 7.914
Total 464.442 62
Homogeneous Subsets
TPC
Duncan
ISOLAT N
Subset for alpha = 0.05
1
OA2E2 9 9.6444
OA2G 9 10.2222
SA1A 9 10.4000
OA1E 9 10.4444
OA2E1 9 10.8222
SA2A 9 11.3667
MB1C 9 11.3778
Sig. .268
f.
Data pH pada media kultur dengan senyawa hidrokarbon poliaromatik
NPar Tests
One-Sample Kolmogorov-Smirnov Test
ISOLAT WAKTU pH
N 63 63 63
Normal Parametersa Mean 4.00 3.3333 6.8254
Std. Deviation 2.016 2.89047 .16458
Most Extreme Differences Absolute .125 .231 .237
Positive .125 .213 .158
Negative -.125 -.231 -.237
Kolmogorov-Smirnov Z .993 1.834 1.878
Asymp. Sig. (2-tailed) .277 .002 .002
a. Test distribution is Normal.
Oneway
Test of Homogeneity of Variances
pH
Levene Statistic df1 df2 Sig.
ANOVA
pH
Sum of Squares df Mean Square F Sig.
Between Groups .039 6 .007 .224 .967
Within Groups 1.640 56 .029
Total 1.679 62
Post Hoc Tests
Homogeneous Subsets
pH
Duncan
ISOLAT N
Subset for alpha = 0.05
1
OA2E1 9 6.7889
SA1A 9 6.8000
OA1E 9 6.8111
OA2G 9 6.8333
OA2E2 9 6.8333
MB1C 9 6.8444
SA2A 9 6.8667
Sig. .414
Lampiran 2
Hasil analisis GC
a.
Hasil analisis standar baku 1000 ppm (n-heksadekana, fenol, dan
d.
Kalibrasi n-heksadekana
f.
Kalibrasi fenantren
Lampiran 3
Perhitungan persentase degradasi
a.
N-heksadekana
Faktor kalibrasi
y= 0,043x + 520,2
Luas area hari ke-0
x= 4924, y= 0,043 . 4924 + 520,2
= 731,932 ppm
Luas area hari ke-7
x= 4659, y= 0,043 . 4659 + 520,2
= 720,537 ppm
b.
Fenol
Faktor kalibrasi
y= 0,843x + 210,3
Luas area hari ke-0
x= 630, y= 0,843 . 630 + 210,3
= 741,39 ppm
Luas area hari ke-7
x= 560, y= 0,843 . 560 + 210,3
= 682,38 ppm
c.
Fenantren
Faktor kalibrasi
y= 0,038x + 532
Luas area hari ke-0
x= 12224, y= 0,038 . 12224 + 532
= 996,512 ppm
Luas area hari ke-7
x= 8152, y= 0,038 . 8152 + 532
Lampiran 4
Hasil uji kit dan uji fisiologis
a.
SA2A
No.
Substrat
Warna
Hasil
Keterangan
1
Lysine
kuning
(-)
2
Ornithine
kuning
(-)
3
H2S
warna jerami
(-)
4
Glucose
hijau
(-)
5
Mannitol
biru - hijau
(-)
6
Xylose
kuning
(+)
7
ONPG
tidak berwarna
(-)
8
Indole
tidak berwarna
(-)
9
Urease
merah muda
(+)
10
VP
merah ceri
(+/-)
11
Citrate
kuning
(-)
12
TDA
kuning
(-)
13
Gelatin
tidak berwarna
(-)
14
Malonate
kuning
(-)
15
Inositol
biru - hijau
(-)
16
Sorbitol
biru - hijau
(-)
17 Rhamnose
hijau
(-)
18
Sucrose
biru - hijau
(-)
19
Lactose
biru - hijau
(-)
20
Arabinose
kuning
(+)
21
Adonitol
biru - hijau
(-)
22
Raffinose
biru - hijau
(-)
23
Salicin
biru - hijau
(-)
24
Arginine
kuning
(-)
25
Nitrat
kuning
(-)
26
Nitrat
(+Zn)
kuning
(+)
b.
OA2G
Tabel persamaan karakteristik
a.
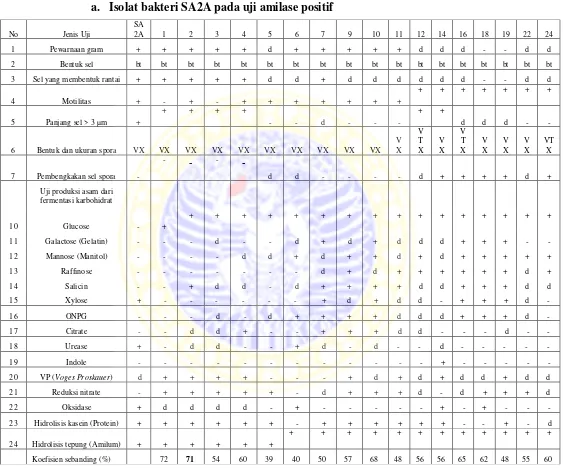
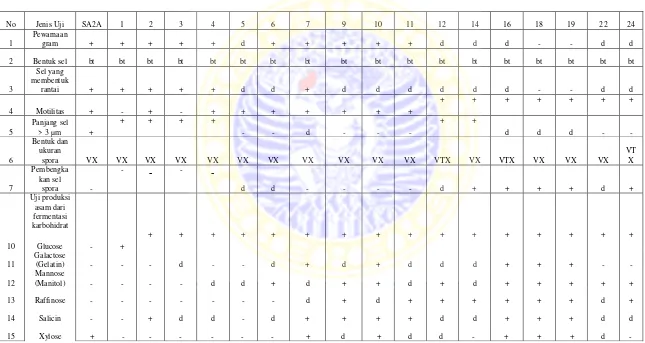
Isolat bakteri SA2A pada uji amilase positif
Keterangan:
(T) spora terminal, (V) spora sentral atau subteminal, (X) spora oval,(Y) spora bulat.
(1) B. anthracis; (2) B. cereus, B. anthracoide;(3) B. mycoides;(4) B. thuringiensis;(5) B. firmus;(6) B. lentus;(7) B. megaterium;(9) B.subtilis;(10) B. licheniformis;(11) B. amyloliquefaciens;(12) B. coagulans;(14) B. alvei;(16)
B.circulans;(18) B. macerans;(19) B.polymyxa;(22) B. stearothermophilus;(24) B. Stearothermophilus
b.
Isolat bakteri OA2G pada uji amilase positif
Keterangan:
(T) spora terminal, (V) spora sentral atau subteminal, (X) spora oval,(Y) spora bulat.
(1) B. anthracis; (2) B. cereus, B. anthracoide;(3) B. mycoides;(4) B. thuringiensis;(5) B. firmus;(6) B. lentus;(7) B. megaterium;(9) B.subtilis;(10) B. licheniformis;(11) B. amyloliquefaciens;(12) B. coagulans;(14) B. alvei;(16)
B.circulans;(18) B. macerans;(19) B.polymyxa;(22) B. stearothermophilus;(24) B. stearothermophilus
Lampiran 5
Dokumentasi
a.
Alat dan bahan
Keterangan :
a= colony counter
d= spektrofotometer
g= shaker
b
=
autoclave
e= inkubator
h= kompor listrik
c= timbangan analitik
f= lemari es
Keterangan :
1= kapas 11= tabung reaksi 2= korek api 12= pipetor 3= sendok media 13= hand counter
4= cawan petri 14= botol kultur 5= tip 1000µL 15= gelas ukur 10 mL 6= tip 100 µL 16= bunsen
7= spatula besi 17= botol aquades 8= mikropipet 18= beaker glass
b.
Isolat bakteri
c.
Media kultur
n-heksadekana (hari ke-3 dan hari ke-7)
Senyawa murni hidrokarbon:
1= fenantren
2= n-heksadekana
3= fenol
Lanjut Gambar Media Kultur
Fenol (hari ke-3 dan hari ke-7)
Fenantren (hari ke-3 dan hari ke-7)
d.
Hasil TPC
Hari ke-3
Hari ke-7
Hari ke-3
Hari ke-7
Lanjutan Gambar Hasil TPC
e.
Hasil uji fisiologi bakteri menggunakan
microbact identification kit
OA2E1
OA2E2
OA2G
SA1A
f.
Hasil uji oksidase
g.
Hasil uji amilolitik
h.
Hasil uji proteolitik
i.
Hasil uji H
2O
2Keterangan:
Warna kertas berubah = positif
Tabel persamaan karakteristik
a.
Isolat bakteri SA2A pada uji amilase positif
Keterangan:
(T) spora terminal, (V) spora sentral atau subteminal, (X) spora oval,(Y) spora bulat.
(1)
B. anthracis; (2)
B. cereus, B. anthracoide;(3)
B. mycoides;(4)
B. thuringiensis;(5) B. firmus;(6)
B. lentus;(7)
B.
megaterium;(9)
B.subtilis;(10)
B. licheniformis;(11)
B. amyloliquefaciens;(12)
B. coagulans;(14)
B. alvei;(16)
B.circulans;(18) B. macerans;(19) B.polymyxa;(22) B. stearothermophilus;(24) B. Stearothermophilus
16 ONPG - - - d - d + + + + d d d + + + d - 17 Citrate - - d d + - - + + + d d - - - d - - 18 Urease + - d d - - + d - d - - d - - - - - 19 Indole - - - + - - - - - 20
VP (Voges
Proskauer) d + + + + - - - + d + d + d d + d d
21
Reduksi
nitrate - + + + + + - d + + + d - d + + + d 22 Oksidase + d d d d - + - - - - - + - + - - -
23
Hidrolisis kasein
(Protein) + + + + + + - + + + + + + - - + - d
24
Hidrolisis tepung
(Amilum) + + + + + +
+ + + + + + + + + + + +
Koefisien sebanding
Keterangan:
(T) spora terminal, (V) spora sentral atau subteminal, (X) spora oval,(Y) spora bulat.
(1)
B. anthracis; (2)
B. cereus, B. anthracoide;(3)
B. mycoides;(4)
B. thuringiensis;(5) B. firmus;(6)
B. lentus;(7)
B.
megaterium;(9)
B.subtilis;(10)
B. licheniformis;(11)
B. amyloliquefaciens;(12)
B. coagulans;(14)
B. alvei;(16)
B.circulans;(18) B. macerans;(19) B.polymyxa;(22) B. stearothermophilus;(24) B. Stearothermophilus
18 Urease - - d d - - + d - d - - d - - - - - 19 Indole - - - + - - - - - 20
VP (Voges
Proskauer) d + + + + - - - + d + d + d d + d d
21 Reduksi nitrate + + + + + + - d + + + d - d + + + d 22 Oksidase + d d d d - + - - - - - + - + - - - 23
Hidrolisis kasein
(Protein) + + + + + + - + + + + + + - - + - d
25
Hidrolisis tepung
(Amilum) + + + + + +
+ + + + + + + + + + + +
Koefisien sebanding