ABIOTIC FACTORS INFLUE NCING MANTANGAN
(
Merremia peltata
) INVASION IN BUKIT BARISAN SE LATAN
NATIONAL PARK
JANI MASTE R , SOE KISMAN TJITROSOE DIRDJO and IBNUL QAYIM1* 2 3
1
Department of Biology, Faculty of Mathematics and Natural Sciences, Universitas L ampung, Bandar L ampung 35145, Indonesia
2
Weed Science Society of Indonesia
3
Department of Biology, Faculty of Mathematics and Natural Sciences, Institut Pertanian Bogor, Bogor 16680, Indonesia
Received 20 January 2015/Accepted 27 January 2016
ABSTRACT
Bukit Barisan Selatan National Park Merremia peltata
Some areas in have serious problems related to (Family
Convolvulaceae) invasion. The abiotic factors influencing M. peltata invasion were investigated in this study. This research compared abiotic factors in three forest locations with different invasion levels i.e. severe, moderate and mild invasions. Abiotic factors measured were percentage of tree canopy coverage, micro climate factors (temperature and humidity), elevation above sea level and physical and chemical properties of the soil surface. In this study, canopy coverage is classified as abiotic factors because it influences the intensity of light that can reach the forest floor. A post-hoc Duncan's Multiple Range Test (DMRT) was employed to determine significant differences ( < 0.05) among p
abiotic factors. In addition, a test of correlation and multiple linear regression were conducted to determine the relationships between abiotic factors andM. peltatainvasion. Multiple regression testing showed that canopy coverage significantly ( <0.05) influenced p M. peltata invasion. Based on the generated model, a 1% addition of canopy coverage would decrease M. peltata invasion by 2.8% Multiple linear regression analysis was used to predict the relationship . between soil nutrients and invasion. The C/N ratio and P O , Ca, Mg and Na concentration significantly ( < 0.05) 2 5 p influenced invasion level. Again, based on the generated model, the increase in the C/N ratio as well as in P O and Ca 2 5 concentrations were correlated with the reduction of M. peltata invasion; while the increase of Mg and Na concentrations were correlated with the increase of M. peltata invasion. M. peltata invasion in Bukit Barisan Selatan National Park was influenced by opened forest canopy and was correlated with high concentration of Na and Mg in the soil of the invaded forest areas.
: Bukit Barisan Selatan National Park, invasive species, mantangan,
Keywords Merremia peltata
INTRODUCTION
Indonesia is a country with abundant flora and fauna, some of which are conserved and protected in conservation areas such as national parks. E xisting national park areas in Indonesia are threatened by alien plant species that invade and threaten flora and fauna biodiversity.
Alien species that have the ability to grow quickly so as to impact biodiversity in invaded areas can be referred to as Invasive Alien Species (IAS) (Pyšek & Richardson 2010). Broadly, an IAS is a species that has the potential to harm the
economy, environment and/or cause damage to human, animal or plant health (National Invasive Species Council 2006).
Merremia peltata or mantangan in the local language, is an invasive species of conservation areas. This species causes severe problems in Bukit Barisan Selatan National Park (BBSNP)
with more than 7,000 ha covered by M. peltata
(Master et al. 2013). Infestation of the weed is suspected to be the cause of animal migrations, such as tiger, elephant and Sumateran rhinoceros, to rural areas up north (Irianto & Tjitrosoedirdjo 2010). Analysis of Landsat and Advanced Land Observing Satellite (ALOS) images indicated that
M. peltata invasion is found from south part of
BBSNP running 33 km to the north of the national park. It is also found in small outbreaks as
far as 50 km north of BBSNP (Master et al. 2013).
The BBSNP is the third biggest conservation area in Sumatera Island covering an area of 356,800 ha. Administratively, this area belongs to Lampung Barat, Pesisir Barat and Tanggamus Districts of Lampung Province and the Bengkulu District of Bengkulu Province, (4 31' – 5 57' S; 0 0 103 34' – 104 43' E ) (Gaveaua 0 0 et al. 2007).
M. peltata is a liana (climbing plant) of the
Convolvulaceae family (Paynter et al. 2006), and it
is distributed throughout Madagascar, the Mescarenes, Seychelles, Malay Peninsula, Malaya Islands, Philippines, New Guinea, Northen Aus t r al i a an d t h r o ugh o ut P o l yn e s i a (Ooststroom & Hoogland 1953). It is similar to sweet potato in morphology, with a wide heart shaped leaf connected by peltate petiole, in contrast to the petiole connection of sweet potato. The hairless plant stem grows to 20 m in length and excretes white liquid when injured. It may grow over other plants (Stone 1970). The corolla is white or yellow, 5–6 cm in length and forms a bell-shape corolla (Fosberg & Sachet 1977). Spreading of this plant occurs generatively, both by seeds or vegetatively from roots along its
stems which touch the ground. egetative growth V
rates can reach 16 cm/week (Pengembara 2014).
E nvironmental factors, both biotic and abiotic, determine the presence of a species in a
particular location (Huang et al. 2003).
Accordingly, not all alien species introduced to an area will become invasive; this can be influenced by factors including environmental fitness and the presence or absence of predators or competitors (Theoharides & Dukes 2007). The rapid growth of M. peltata in BBSNP is probably caused by a number of abiotic factors. The objective of this research was to determine abiotic factors
influencing M. peltata invasion in BBSNP.
MATE RIALS AND ME TH ODS
erremia
M peltata is found mostly in southern regions of BBSNP, but not all of M. peltata in this region grows densely. To determine abiotic factors influencing plant invasion, environmental factors were recorded in three forest locations with different invasion levels, i.e. severely invaded, moderately invaded and mildly invaded forest (Fig. 1). First location (severely invaded forest) is close to the village enclave Way Haru, Bandar Dalam and Tampang. Based on land cover maps, this site has a decreasing forest cover for an area of 2,565.54 ha from 2000 to 2009. Presumably these changes were the result of forest clearing
for plantations (Prasetyo et al. 2011). The second location (moderately invaded forest) is a post-fire forest in 1997; fires that occurred mostly on the forest floor affecting the lining of plant and open up some forest canopy (WCS-IP 2001). The third location (mildly invaded forest) is a primary forest. Selection and classification of these invasion
levels were based on coverage of M. peltata from
Landsat and ALOS image analyses in 2002 and location. Plots of 20 x 20 m were sampled along each line transect, at 100 m intervals, thus totaling
30 plots in each location. M. peltata invasion was
estimated based on the percentage of plot that
was covered by M. peltata. Environmental factors
recorded for each plot were: 1. the percentage of tree canopy coverage (tree canopies that were more than 4 m in height) which was estimated using a concave densiometer; 2. microclimate (temperature and humidity) were measured at noon, 1 m above the ground using thermometer and hygrometer on each plot; 3. elevation above sea level; and 4. physical and chemical properties
of top soil using composite method (Crozier et al.
2010). Soil physical and chemical properties
observed were soil texture, pH (H O), KCl, C-2
organic, N-Kjedahl, Cation E xchange Capacity (CE C) and exchangeable cations (K, Na, Ca, Mg). Soil texture fraction comparisons were separated as follows: 1. sand fraction having particles with diameter of 2 mm - 50µ; 2. loam fraction having particles with diameter of 50µ - 2µ; and 3. clay fraction having particles with diameter of < 2µ) (Hardjowigeno 2010).
Data for each environmental factor from each of the three locations were analyzed using ANOVA and the mean differences were tested using the Duncan's Multiple Range Test (DMRT) at < 0.05). Tests of correlation and linear p
regression were carried out using SPSS 12 program to determine any relationships existed
between abiotic factors and M. peltata invasion.
RE SULTS AND DISCUSSION
Percentage Cover of M. peltata Invading Forests
M. peltata
The mean coverage percentage of in
the mildly invaded forest ranged from 1 to 15%. In comparison, the mean coverage percentage in the moderate invaded forest ranged from 27 to 55%. In the severe invaded forest, the mean coverage percentage was 44%, while in some location the percentage was up to 100%.
Abiotic Factors (non-soil) and M. peltata
Invasion Levels
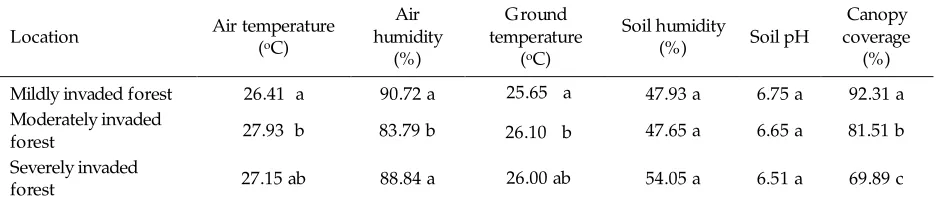
Of the six abiotic factors observed i.e. air temperature, air humidity, ground temperature, soil humidity, soil pH and percentage of tree canopy coverage (canopy above 4 m), only the percentage of tree canopy coverage was significantly varied ( < 0.05) among the three p
locations (Table 1). Forest canopy coverage had
significant negative correlation to M. peltata
invasion. Based on a generated model, every 1%
addition of canopy coverage would decrease M.
peltata invasion by 2.8% (Table 2).
The severely invaded forest locations had more open tree canopy coverage. The open canopies facilitate access of M. peltata to solar radiation such that the weed dominated these
Table 1 Summary of abiotic factors at the three research locations
Location Air temperature
areas. In the mildly invaded forest, mean canopy coverage was denser (92.31%). Denser canopy
coverage prevented extensive M. peltata growth
and development such that it only grew through gaps of canopy where there were collapsed trees. This result is consistent with other findings which reported that M. peltata grew on the edges of forest, especially in degraded land in Fiji (Kirkham 2005), and that this plant grew densely in logged
forest and open forest in other parts of Sumatera (Irianto & Tjitrosoedirdjo 2010).
Air temperature, air humidity and ground temperatures were all significantly ( < 0.05) higher p
in moderately invaded forest than in mildly invaded forest (Table 1). The increase in these factors was most likely related to tree canopy coverage, such that more open canopies would increase solar radiation, air and ground temperatures, as well as rainfall reaching the forest floor (Sasaki & Mori 1981).
Severely invaded forest had more open tree canopy coverage, but air temperature, air humidity and ground temperatures in that location were not
different to mildly invaded forest. This is probably because the ground coverage of
M. peltata in both levels of invaded forest produced similar microclimate.
There were no relationship between elevation above sea level and the infestation size of
M. peltata. This is despite the fact that M. peltata is known to occupy lowland habitats to 300-400 m above sea level in Samoa and Fiji (Meyer 2000, Kirkham 2005).
Soil Abiotic Factors and M. peltataInvasion Levels
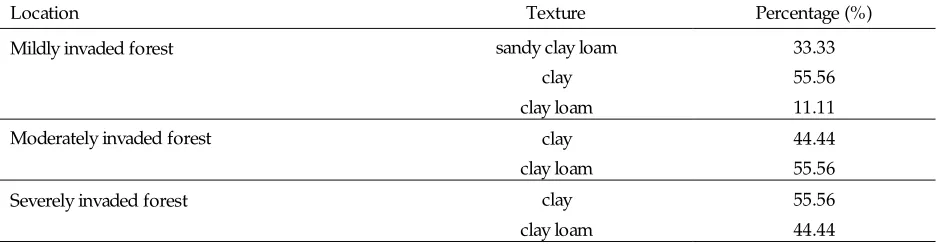
Beside the aforementioned environmental factors, the physical and chemical properties of the soil were also analyzed in the three research locations. T he mildly invaded forest was dominated with a sandy-clay-loam soil texture, while the moderately and severely invaded forest had clay and clay-loam soil texture (Table 3).
Soil in the secondary and invaded forests had higher clay content than soil in the primary forest. The clay fraction is the most important
Table 2 Results of multiple linear regression between percentages of M. peltata coverage and abiotic factors Coefficientsa
Model Unstandardized coefficients
Standardized
coefficients t Sig. Collinearity statistics
B
Std.
E rror Beta Tolerance VIF
1 (Constant) 89.020 53.253 1.672 0.099
Air temperature -2.841 3.189 - 0.148 -0.891 0.376 0.356 2.812
Air humidity -2.782 1.668 - 0.281 -1.668 0.100 0.345 2.897
Ground temperature 6.209 7.892 0.119 0.787 0.434 0.432 2.317
Soil humidity -0.603 0.386 - 0.236 -1.562 0.123 0.431 2.320
Soil pH -23.790 8.175 - 0.448 -2.910 0.005 0.414 2.418
Canopy coverage -1.218 0.301 - 0.427 -4.047 0.000 0.882 1.134
Note: a = Dependent Variable: percentage of M. peltata coverage
Table 3 Soil texture samples in the three research locations
Location Texture Percentage (%)
Mildly invaded forest sandy clay loam 33.33
clay 55.56
clay loam 11.11
Moderately invaded forest clay 44.44
clay loam 55.56
Severely invaded forest clay 55.56
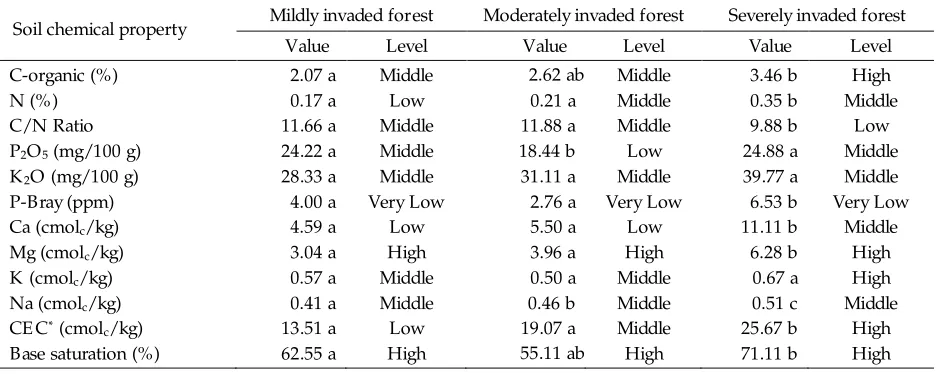
component because its particles have more surface area than sand particles. Soil with higher clay content has higher Cation E xchange Capacity (CE C) than sandy soil due to greater overall surface area of clay particles (Munawar 2011). The CE C value was higher in the severely invaded
forest (25.67 cmol /kg), followed by moderately c
invaded forest (19.07 cmol /kg), with the lowest in c
the mildly invaded forest (13.51 cmol /kg) (Table c
4). The CE C is a chemical property closely related to soil fertility. Soil with higher organic and clay contents had higher CE C values than soil with low o r ganic c o nt e nt an d/o r sandy so il s (Hardjowigeno 2010).
Further, soil with higher CE C values is able to better retain and provides nutrients (cations and anions) than soil with low CEC values. The lack of cation exchange capacity in low CE C soil results in the nutrients being easily washed through the soil with underground water movement (infiltration, percolation) such that these nutrients are no longer available for plant growth.
The severely invaded forest had a higher alkaline density (base saturation) value (71.11%) than the other two forest locations. Contributing to this higher alkaline density were the alkaline cations Ca, Mg, K and Na. These alkaline cations are important soil nutrients required by plants.
The presence of organic substances in the soil can improve soil fertility chemically, physically and biologically. The amount of organic carbon in the severely invaded forest was higher (3.46%) than that in the mildly invaded forest. Based on soil
fertility criteria, C-organic in the severely invaded forest belonged to high category.
Nitrogen (N) is a crucial soil nutrient, often found with low availability. Total nitrogen in the severely invaded forest was significantly ( < 0.05) p
higher (0.35%) than that in the other two locations. There was no significant difference ( > 0.05) of total nitrogen between the mildly p
invaded forest (0.17%) and the moderately invaded forest (0.21%). Higher nitrogen values contribute to low C/N ratios such that more nitrogen is available to microorganisms to decompose carbon containing material, recycling the nitrogen quickly (Munawar 2011). Higher nitrogen contents in plants will result in faster
vegetative growth. M. peltata was rarely found to
flower in severely invaded forest, and this may have been caused by high nitrogen contents in the soil.
Regression Analyses between Soil Factors and M. peltata Invasion
Double linear regression analyses were conducted to predict whether soil nutrient status was correlated with invasion. C/N ratio and
concentration of P O , Ca, Mg and Na 2 5
significantly ( < 0.05) contributed to p M. peltata
invasion (Table 5). Based on a generated model, the increase of C/N ratio and concentration of P O and Ca may reduce 2 5 M. peltata invasion; while the increase of Mg and Na concentration may increase M. peltata invasion. M. peltata invasion in the severely invaded forest was correlated with
Table 4 Average soil chemical properties in three research locations
Soil chemical property Mildly invaded forest Moderately invaded forest Severely invaded forest
Value Level Value Level Value Level
C-organic(%) 2.07 a Middle 2.62 ab Middle 3.46 b High
N (%) 0.17 a Low 0.21 a Middle 0.35 b Middle
C/NRatio 11.66 a Middle 11.88 a Middle 9.88 b Low
P2O5(mg/100 g) 24.22 a Middle 18.44 b Low 24.88 a Middle
K2O (mg/100 g) 28.33 a Middle 31.11 a Middle 39.77 a Middle
P-Bray (ppm) 4.00 a Very Low 2.76 a Very Low 6.53 b Very Low
Ca (cmolc/kg) 4.59 a Low 5.50 a Low 11.11 b Middle
Mg (cmolc/kg) 3.04 a High 3.96 a High 6.28 b High
K (cmolc/kg) 0.57 a Middle 0.50 a Middle 0.67 a High
Na (cmolc/kg) 0.41 a Middle 0.46 b Middle 0.51 c Middle
CE C*(cmolc/kg) 13.51 a Low 19.07 a Middle 25.67 b High
Base saturation (%) 62.55 a High 55.11 ab High 71.11 b High
Notes: CE C = Cation Exchange Capacity
low C/N ratios and high concentration of Mg and Na in the soil.
Sodium has an important role in determining soil characteristics and plant growth, especially in areas close to a beach. The severely invaded forest in this study is located close to a beach. This is a suspected cause of the high Na content in the soil in this location. E xcessive Na content can also be toxic for plants (Hanafiah 2007), influencing cell membrane and organelle functions, as well as disrupting plant metabolism sequences (Hamim 2008). Soil sodium concentrations significantly ( < 0.05) increased as invasion levels of p M. peltata
increased in this study. This weed is suspected of being a halophyte, being able to grow in a land with high salt content.
Another soil nutrient correlated with M. peltata
invasion was Mg. Soil samples from the severely invaded forest had significant ( < 0.05) higher p
content of Mg (6.28 cmol /kg) than either mildly c
invaded forest (3.04 cmol /kg) or moderately c
invaded forest (3.96 cmol /kg) (Table 4). c
Magnesium is a crucial element used in chlorophyll formation. Like other soil nutrients, magnesium deficiency results in a typical color change to leaf material. Premature leaf fall is also caused by magnesium deficiency (Hanafiah 2007). Magnesium is a macro element in soil when found in its organic form (Sutcliffe & Baker 1975) and has important role in phosphate availability (Agustina 2004).
CONCLUSIONS
Abiotic factors influencing M. peltata invasion
in Bukit Barisan Selatan National Park are opened forest canopy coverage and high content of Na and Mg in the soil.
ACKNOWLE DGE ME NTS
This study was part of Master thesis of the first author, financially supported by SE AME O-BIOTROP DIPA 2011. The author thanked Artha Graha Peduli and Wildlife Conservation Society Indonesia Program for their assistance in conducting the field work.
RE F E RE NCE S
Agustina L. 2004. Dasar-dasar Nutrisi Tanaman. Jakarta (ID): PT Rineka Cipta.
Crozier CR, Heiniger RW. 2001. Soil Facts: Soil Sampling for Precision Farming Systems. North Carolina (USA): North Carolina State University.
Fosberg FR, Sachet MH. 1977. Flora of Micronesia, part 3, Convolvulaceae. Contributii Botanice 36:1-34.
Gaveaua DLA, Wandono H, Setiabudi F. 2007. Three decades of deforestation in southwest Sumatera: Have protected areas halted forest loss and logging, and promoted re-growth Biol Conserv 134:495-.
504.
Table 5 Result of multiple linear regression between the percentage of M. peltata coverage and soil nutrient factors Coefficientsa
1 (Constant) 50.768 144.015 0.353 0.729
Loam 0.797 1.181 0.117 0.675 0.509 0.315 3.173
Clay -0.569 0.905 - 0.140 -0.629 0.538 0.190 5.277
H2O -11.183 23.641 - 0.128 -0.473 0.642 0.128 7.818
CNRatio -8.535 2.739 - 0.370 -3.116 0.006 0.668 1.498
P2O5 -2.721 1.197 - 0.377 -2.273 0.036 0.342 2.924
Ca -5.902 1.694 - 0.888 -3.485 0.003 0.145 6.899
Mg 18.726 4.721 0.970 3.966 0.001 0.157 6.351
Na 210.264 74.615 0.390 2.818 0.012 0.493 2.029
Base
saturation(%) 0.735 0.459 0.292 1.601 0.128 0.284 3.522
Hamim. 2008. Fisiologi Tumbuhan. Jakarta (ID): Universitas Terbuka.
Hanafiah KA. 2007. Dasar-dasar Ilmu Tanah. Jakarta (ID): PT. Raja Grafindo Persada.
Hardjowigeno S. 2010. Ilmu Tanah. Jakarta (ID): Akademika Pressindo.
Huang W, Pohjonen V, Johansson S, Nashanda M, K atigula MIL, Luukkanen O. 2003. Species Diversity, Forest Structure and Species Composition in Tanzania Tropical Forest. For Ecol Manage 173:11-24.
Irianto R, Tjitrosoedirdjo S. 2010. Invasi Merremia peltata (L.) Merr., Convolvulaceae di Taman Nasional Bukit Barisan Selatan, Indonesia. Journal Gulma dan Tumbuhan Invasi Tropika 1:65-70.
Kirkham WS. 2005. Valuing invasives: Understanding the
Merremia peltata invasion in Post-Colonial Samoa.
Dissertation. Austin (USA): The University of Texas at Austin.
Master J, Tjitrosoedirdjo SS, Qayim I, Tjitrosoedirdjo S. 2013. E cological Impact of Merremia peltata (L.) Merrill Invasion on Plant Diversity at ukit Barisan B Selatan National Park. Biotropia20(1):29-37.
Meyer JY. 2000. Preliminary review of the invasive plants in the Pacific islands. In: Sherley G, editor. Invasive Species in the Pacific: A Technical Review and Draft Regional Strategy. Samoa (WS): South Pacific Regional Environment Programme. p 85-114.
Munawar A. 2011. Kesuburan Tanah dan Nutrisi Tanaman. Bogor (ID): IPB Press.
National Invasive Species Council. 2006. Invasive Species Definition Clarification and Guidance White Paper. https://www.invasivespeciesinfo.gov/docs/council / isacdef.pdf (accessed October 20 , 2014).th
Ooststroom van SJ, Hoogland RD. 1953. Convolvulaceae. Flora Malesiana I 4:452-3.
Paynter Q, Harman H, Waipara N. 2006. Prospects for biological control of Merremia peltata Report. . New Zealand: Conservation International.
Pyšek P, Richardson DM. 2010. Invasive species, environmental change and management and health. Ann Rev Environ Resour 35: 25-55.
Pengembara T, Master J, Yulianty, Rustiati EL, Subiakto A. 2014. Laju pertumbuhan mantangan (Merremia peltata L. Merr.) ang umbuh y t melalui egenerasi r vegetatif. Proceedings of Seminar Nasional Pengembangan Teknologi Pertanian. Lampung (ID): Politeknik Negeri Unila.
Prasetyo A, Hikmat A, Prasetyo LB. 2011. Pendugaan Perubahan Cadangan K arbon di Tambling Wildlife Conservation Taman Nasional Bukit Barisan Selatan. Media Konservasi 16: 87 – 91.
Sasaki S, Mori T. 1981. Growth responses of Dipterocarp seedlings to light. Malaysian Forester 44: 319-45.
Stone BC. 1970. The flora of Guam. Micronesica6:1-659.
Sutcliffe JF, Baker DA. 1975. Plant and Mineral Salts. London (UK): Edward Arnold Publishing.
Theoharides KA, Dukes JF. 2007. Plant invasion across space and time: factors affecting non indigenous species success during four stages of invasion. J New Phytol 176:256-73.