John Coates
in
Encyclopedia of Analytical Chemistry
R.A. Meyers (Ed.)
pp. 10815–10837
Interpretation of Infrared
Spectra, A Practical Approach
John Coates
Coates Consulting, Newtown, USA
1 Introduction 1
2 The Origins of the Infrared Spectrum 2
3 Spectral Interpretation by Application of
Vibrational Group Frequencies 6
3.1 The Hydrocarbon Species and
Molecular Backbone 6
3.2 Simple Functional Groups 9
3.3 The Carbonyl Group 12
3.4 Other Functional Groups Associated
with Heteroatoms 13
3.5 Simple Inorganics 14
4 The Practical Situation – Obtaining the
Spectrum and Interpreting the Results 15
4.1 Sample History 16
4.2 Physical Characteristics of the
Sample 17
4.3 The Chemistry of the Sample 17 4.4 The Infrared Sampling Method 18
5 An Overview to Infrared Spectral
Interpretation – Some Simple Rules and
Guidelines 19
5.1 A Quick Diagnostic Assessment of
an Infrared Spectrum 20
Abbreviations and Acronyms 22
Related Articles 22
References 23
The vibrational spectrum of a molecule is considered to be a unique physical property and is characteristic of the molecule. As such, the infrared spectrum can be used as a fingerprint for identification by the comparison of the spectrum from an ‘‘unknown’’ with previously recorded reference spectra. This is the basis of computer-based spectral searching. In the absence of a suitable reference database, it is possible to effect a basic interpretation of the spectrum from first principles, leading to characterization, and possibly even identification of an unknown sample. This first principles approach is based on the fact that structural features of the molecule, whether they are the backbone of the molecule or the functional groups attached to the molecule, produce characteristic and reproducible
absorptions in the spectrum. This information can indicate whether there is backbone to the structure and, if so, whether the backbone consists of linear or branched chains. Next it is possible to determine if there is unsaturation and/or aromatic rings in the structure. Finally, it is possible to deduce whether specific functional groups are present. If detected, one is also able to determine local orientation of the group and its local environment and/or location in the structure. The origins of the sample, its prehistory, and the manner in which the sample is handled all have impact on the final result. Basic rules of interpretation exist and, if followed, a simple, first-pass interpretation leading to material characterization is possible. This article addresses these issues in a simple, logical fashion. Practical examples are included to help guide the reader through the basic concepts of infrared spectral interpretation.
1 INTRODUCTION
The qualitative aspects of infrared spectroscopy are one of the most powerful attributes of this diverse and versatile analytical technique. Over the years, much has been published in terms of the fundamental absorption frequencies (also known as group frequencies) which are the key to unlocking the structure – spectral relationships of the associated molecular vibrations. Applying this knowledge at the practical routine level tends to be a mixture of art and science. While many purists will argue against this statement, this author believes that it is not possible to teach a person to become proficient as an interpretive spectroscopist by merely presenting the known relationships between structure and the observed spectra. Instead, the practical approach, which has been adopted in this text, is to help the reader appreciate the visual aspects of the spectroscopy and how to interpret these relative to the structure and chemistry of the sample. This is achieved by recognizing characteristic shapes and patterns within the spectrum, and by applying the information obtained from published group frequency data, along with other chemical and physical data from the sample.
Included in the text is a discussion of the interrelation-ships that exist between the practical side of acquiring the spectrum, the chemistry and physics of the sample under study, the physical interactions of the sample with its environment, and the impact of the structure on the spectrum. In essence, the interpretation of infrared spec-tra is much more than simply assigning group frequencies. The spectrum is rich in information, and this article is intended to help the reader to extract the maximum using the knowledge available for the sample and the acquired spectral data. One important factor to bear in
Encyclopedia of Analytical Chemistry
mind is that a successful interpretation is based not only on thepresenceof particular bands within the spectrum, but also theabsenceof other important bands. Complete classes of compounds can be rapidly excluded during the interpretation by the use ofno-bandinformation.
It must be understood that this article addresses the issue of infrared spectral interpretation from the perspective of the average operator of an infrared instrument. It is not a detailed treatise on the theory of infrared spectroscopy where the modes of vibration are discussed in terms of group theory, and where mathematical models are used to compare theoretical and observed values for the fundamental vibrations of a molecule. There are many excellent texts that cover this subject.⊲1 – 4⊳ Instead, this article focuses on the
day-to-day problems associated with characterizing a material or attempting to perform some form of identification. One of the main challenges in presenting a text on spectral interpretation is to form a balance between the theory that is needed to appreciate the links between molecular structure and the observed spectrum and the practice. For this reason, a minimum amount of relevant theory is included in the next section, which provides a basic understanding of why the spectrum exists, how it is formed, and what factors contribute to the complexity of observed spectra. It has been assumed that the reader has a fundamental knowledge of molecular theory and bonding, and that there is an understanding of basic structures, in particular for organic compounds.
Infrared spectral interpretation may be applied to both organic and inorganic compounds, and there are many specialized texts dealing with these compounds, in combination and as individual specialized texts. There are too many to reference comprehensively, and the reader is directed to a publication that provides a bibliography of the most important reference texts.⊲5⊳
However, the most informative general reference texts are included,⊲6 – 14⊳ with books by Socrates⊲10⊳ and
Lin-Vien⊲11⊳ being recommended for general organics, and
by Nakamoto⊲13⊳ and Nyquist et al.⊲14⊳ for inorganics
(salts and coordination compounds). There are numerous specialized texts dealing with specific classes of materials, and undoubtedly polymers and plastics form the largest individual class.⊲15 – 17⊳ In this particular case, texts by
Hummel and Scholl⊲16⊳ and Koenig⊲17⊳ provide a good
basic understanding.
The following comments are made relative to the con-ventions used within this article. The term frequency is used for band/peak position throughout, and this is expressed in the commonly used units of wavenum-ber (cm 1). The average modern infrared instrument
records spectra from an upper limit of around 4000 cm 1
(by convention) down to 400 cm 1 as defined by the
optics of the instrument (commonly based on potassium
bromide, KBr). For this reason, when a spectral region is quoted in the text, the higher value will be quoted first, consistent with the normal left-to-right (high to low cm 1)
representation of spectra. Also, the terms infrared band, peak and absorption will be used interchangeably within the text to refer to a characteristic spectral feature.
The spectral group frequencies provided in this text were obtained from various literature sources published over the past 30 years, and most of these are included in the cited literature. Every attempt to ensure accuracy has been taken; however, there will be instances when individual functional groups may fall outside the quoted ranges. This is to be expected for several reasons: the influences of other functional groups within a molecule, the impact of preferred spatial orientations, and environ-mental effects (chemical and physical interactions) on the molecule.
The preferred format for presenting spectral data for qualitative analysis is in the percentage transmittance format, which has a logarithmic relationship ( log10) with
respect to the linear concentration format (absorbance). This format, which is the natural output of most instruments (after background ratio), provides the best dynamic range for both weak and intense bands. In this case, the peak maximum is actually represented as a minimum, and is the point of lowest transmittance for a particular band.
2 THE ORIGINS OF THE INFRARED
SPECTRUM
In the most basic terms, the infrared spectrum is formed as a consequence of the absorption of electromagnetic radiation at frequencies that correlate to the vibration of specific sets of chemical bonds from within a molecule. First, it is important to reflect on the distribution of energy possessed by a molecule at any given moment, defined as the sum of the contributing energy terms (Equation 1):
EtotalDEelectronicCEvibrationalCErotationalCEtranslational ⊲1⊳
are distributed throughout the molecule, either localized within specific bonds, or delocalized over structures, such as an aromatic ring. In order to observe such electronic transitions, it is necessary to apply energy in the form of visible and ultraviolet radiation (Equation 2):
EDhn frequency/energy ⊲2⊳
The fundamental requirement for infrared activity, lead-ing to absorption of infrared radiation, is that there must be a net change in dipole moment during the vibration for the molecule or the functional group under study. Another important form of vibrational spectroscopy is Raman spectroscopy, which is complementary to infrared spectroscopy. The selection rules for Raman spectroscopy are different to those for infrared spectroscopy, and in this case a net change in bond polarizability must be observed for a transition to be Raman active. The remain-ing theoretical discussion in this article will be limited to a very simple model for the infrared spectrum. The reader is encouraged to refer to more complete texts⊲2 – 4⊳ for
detailed discussion of the fundamentals.
While it was stated that the fundamental infrared absorption frequencies are not the only component to be evaluated in a spectral interpretation, they are the essence and foundation of the art. For the most part, the basic model of the simple harmonic oscillator and its modifica-tion to account for anharmonicity suffice to explain the origin of many of the characteristic frequencies that can be assigned to particular combinations of atoms within a molecule. From a simple statement of Hooke’s law we can express the fundamental vibrational frequency of a molecular ensemble according to Equation (3):
nD 1 2pc
rk
µ ⊲3⊳
where nDfundamental vibration frequency, kDforce constant, andµDreduced mass. The reduced mass,µD m1m2/⊲m1Cm2⊳, wherem1 and m2 are the component
masses for the chemical bond under consideration. This simple equation provides a link between the strength (or springiness) of the covalent bond between two atoms (or molecular fragments), the mass of the inter-acting atoms (molecular fragments) and the frequency of vibration. Although simple in concept, there is a rea-sonably good fit between the bond stretching vibrations predicted and the values observed for the fundamentals.
This simple model does not account for repulsion and attraction of the electron cloud at the extremes of the vibration, and does not accommodate the concept of bond dissociation at high levels of absorbed energy. A model incorporating anharmonicity terms is commonly used to interpret the deviations from ideality and the overall energy – spatial relationship during the vibration
of a bond between two atomic centers. The fundamental, which involves an energy transition between the ground state and the first vibrational quantum level, is essen-tially unaffected by the anharmonicity terms. However, transitions that extend beyond the first quantum level (to the second, third, fourth, etc.), which give rise to weaker absorptions, known as overtones, are influenced by anharmonicity, which must be taken into account when assessing the frequency of these higher frequency vibrations.
Having defined the basis for the simple vibration of an atomic bond, it is necessary to look at the molecule as a whole. It is very easy to imagine that there is an infinite number of vibrations, which in reality would lead to a totally disorganized model for interpretation. Instead, we describe the model in terms of a minimum set of fundamental vibrations, based on a threefold set of coordinate axes, which are known as the normal modes of vibration. All the possible variants of the vibrational motions of the molecule can be reduced to this minimum set by projection on to the threefold axes. It can be shown that the number of normal modes of vibration for a given molecule can be determined from Equations (4) and (5): number of normal modesD3N 6 (nonlinear) ⊲4⊳
D3N 5 (linear) ⊲5⊳
where N is the number of component atoms in the molecule.
In practice, apart from the simplest of compounds, most molecules have nonlinear structures, except where a spe-cific functional group or groups generate a predominant linear arrangement to the component atoms. If we calcu-late the number of modes for a simple hydrocarbon, such as methane (nonlinear, tetrahedral structure), a value of nine is obtained. This would imply that nine sets of absorp-tion frequencies would be observed in the spectrum of methane gas. In reality, the number observed is far less, corresponding to the asymmetric and symmetric stretch-ing and bendstretch-ing of the C H bonds about the central carbon atom. The reason for the smaller than expected number is that several of the vibrations are redundant or degenerate, that is, the same amount of energy is required for these vibrations. Note that although a small number of vibrational modes is predicted, and in fact observed, the appearance of the methane spectrum at first glance is far more complex than expected, especially at higher spectral resolutions (<1 cm 1). At relatively high
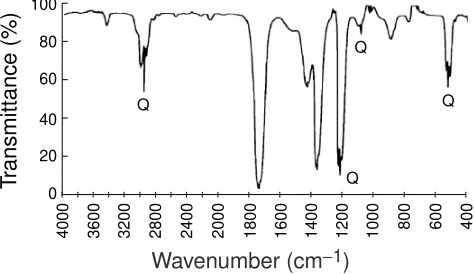
compounds may also show evidence of some fine struc-ture when studied in the vapor state. For example, it is common to observe the sharp feature (or spike) assigned to the Q-branch of the vibrational – rotational spectrum, as indicated by the vapor spectrum of acetone (Figure 1). If we proceed up the homologous series from methane (CH4) to n-hexane (C6H14), there are 20 component
atoms, which would imply 54 normal modes. In this case the picture is slightly more complex. Methane is a unique molecule, and only contains one type of C H group – no other types of bond exist in this molecule. In hexane there are several types of bond and functionality. For reference, a simple two-dimensional representation of the structure is provided in Figure 2(a).
As we can see, there are two terminal methyl groups (CH3) and four connecting methylene groups (CH2).
Each of these groups has its corresponding C H stretching and bending vibrations (see later text for the actual absorption frequencies). Also, the methyl groups are linked to a neighboring methylene group, which is in turn linked to neighboring methylene groups, and so on. These linkages feature carbon – carbon bonds. For interpretation, we view the C H groups as functional groups, giving rise to the common group frequencies, and the C C linkages as the backbone, producing the skeletal vibrations. As a rule, a group frequency may be applied generally to most compounds featuring the corresponding functional group. In contrast, the skeletal vibrations are unique to a specific molecule. The group frequencies help to characterize a compound, and the
100
80
60
40
20
0
4000 3600 3200 2800 2400 2000 1800 1600 1400 1200 1000 800 600 400
T
ransmittance (%)
Q
Q Q
Q
Wavenumber (cm
−1)
Figure 1 Vapor spectrum of acetone with characteristic
Q-branch slitting, denoted by Q. Copyright Coates Consulting.
H C H H C
C C
C C
H HH H H HH H H
H H
(a) (b)
C
C CC H H H H H
H H C H HH H
C H H H
Figure 2 Structures for hexane isomers: (a)n-hexane and
(b) isohexane (2-methylpentane). Copyright Coates Consulting.
combination of the bands associated with these group frequencies and the skeletal frequencies are used to identify a specific compound. The latter forms the basis of the use of reference spectra for spectral matching by visual comparison or by computer-based searching, for the identification of an unknown from its infrared spectrum.
The group frequencies may be viewed quantitatively, as well as qualitatively. A given absorption band assigned to a functional group increases proportionately with the number times that functional group occurs within the molecule. For example, in the spectrum ofn-hexane, the intensities measured for the group frequency absorptions assigned to methyl and methylene correspond to four methylene groups and two methyl groups on a rel-ative basis, when compared with other hydrocarbon compounds within a homologous series. For example, if we examine the C H stretching (or bending) band intensities for CH3 and CH2, we will observe that the
relative intensities of CH3to CH2decrease with increase
in chain length. Restated, there is less methyl contribu-tion and more methylene contribucontribu-tion with increase in chain length/molecular weight. The reverse holds true if we examine the spectra of linear hydrocarbons with chain lengths shorter than that of hexane.
If we apply these ideas to a different hexane iso-mer, such as isohexane (2-methylpentane), we would see significant differences in the spectrum. These can be explained by evaluating the structure (Figure 2b), which contains three methyl groups, two methylene groups, and a group that contains a single hydrogen attached to car-bon (the methyne group). This adds a new complexity to the spectrum: the main absorptions show differences in appearance, caused by the changes in relative band intensities, splittings of absorptions occur (originating from spatial/mechanical interaction of adjacent methyl groups), and changes are observed in the distributions of the C C skeletal vibrations, in part due to the splitting by the methyl side chain. Further discussions concerning the impact of chain branching are covered later in this article. Comparison of Figures 3 and 4 provides a graphical repre-sentation of the aspects discussed for the hexanes of struc-turally similar compounds, i.e.n-heptane and isooctane.
From a first-order perspective, the idea of the quan-titative aspects of the group frequencies carries through for most functional groups, and the overall spectrum is essentially a composite of the group frequencies, with band intensities in part related to the contribution of each functional group in the molecule. This assumes that the functional group does give rise to infrared absorption frequencies (most do), and it is understood that each group has its own unique contribution based on its extinc-tion coefficient (or infrared absorpextinc-tion cross-secextinc-tion).
4 0 0 0 3 6 0 0 3 2 0 0 2 8 0 0 2 4 0 0 2 0 0 0 1 8 0 0 1 6 0 0 1 4 0 0 1 2 0 0 1 0 0 0 8 0 0 6 0 0 100 80 60 40 20 0
Wavenumber (cm
−1)
T
ra
n
s
m
it
ta
n
c
e
(
%
)
CH3 (CH2)5 CH3
Figure 3 Attenuated total reflectance (ATR) spectrum of
n-heptane. Copyright Coates Consulting.
CH3 C
CH3
CH3
CH2 CH CH3
CH3 4 0 0 0 3 6 0 0 3 2 0 0 2 8 0 0 2 4 0 0 2 0 0 0 1 8 0 0 1 6 0 0 1 4 0 0 1 2 0 0 1 0 0 0 8 0 0 6 0 0 100 80 60 40 20 0
Wavenumber (cm
−1)
T
ra
n
s
m
it
ta
n
c
e
(
%
)
Figure 4 ATR spectrum of 2,2,4-trimethylpentane (isooctane).
Copyright Coates Consulting.
observed absorption frequencies in the infrared spectrum to much more that just simple harmonic (or anharmonic) stretching vibrations. In practice, we find that various other deformation motions (angular changes), such as bending and twisting about certain centers within a molecule, also have impact, and contribute to the overall absorption spectrum. By rationalizing the effort needed to move the atoms relative to each other, one can appreciate that it takes less energy to bend a bond than to stretch it. Consequently, we can readily accept the notion that the stretching absorptions of a vibrating chemical bond occur at higher frequencies (wavenumbers) than the corresponding bending or bond deformation vibrations, with the understanding, of course, that energy and frequency are proportionally related. A good example is the C H set of vibrations, observed in the hydrocarbon spectra, and in virtually all organic compounds. Here, the simple C H stretching vibrations for saturated aliphatic species occur between 3000 and 2800 cm 1, and the
corresponding simple bending vibrations nominally occur between 1500 and 1300 cm 1.
Next in our understanding is that it can take slightly more energy to excite a molecule to an asymmetric than a
symmetric vibration. While this might be less intuitive, it is still a rational concept, and therefore easy to understand and accept. Again, we see a good example with the C H stretch of an aliphatic compound (or fragment), where we observe the asymmetric C H stretch of the methyl and methylene groups (2960 and 2930 cm 1, respectively)
occurring at slightly higher frequency than symmetric vibrations (2875 and 2855 cm 1, respectively for methyl
and methylene). For the most part, this simple rule holds true for most common sets of vibrations. Naturally there are always exceptions, and a breakdown of the rationale may occur when other effects come into play, such as induced electronic, spatial or entropy-related effects.
There are many other spatially related scenarios that tend to follow well-orchestrated patterns, examples being in-plane and out-of-plane vibrations, the differences betweencisandtransspatial relationships, and a variety of multicentered vibrations that are defined as twisting or rocking modes. Many of these are exhibited with the C H vibrations that occur in saturated, unsaturated and aromatic compounds. Molecular symmetry of the static or the dynamic (during vibration) molecule has a large impact on the spectrum, in addition to factors such as relative electronegativity, bond order and relative mass of the participating atoms.
Finally, while discussing the vibrational origins of infrared spectra, it is worth commenting that further complexity may be noted in the spectrum, beyond what is expected based on the fundamentals. As noted, transitions to higher energy levels, although theoreti-cally not allowed, can occur and these give rise to overtone bands, which in the mid-infrared region occur at approximately twice the fundamental frequency for the first overtone. Higher overtones exist, typically the second (3ðfundamental) and third (4ðfundamental), and sometimes higher, and these are observed, with extremely low intensity, relative to the fundamental in the near-infrared spectral regions, between 800 and 2500 nm (12 500 and 4000 cm 1). Other types of bands that can add
complexity to a spectrum are combination bands (sum and difference), bands due to transitions from energy states higher than the ground state or ‘‘hot bands’’, and bands due to interactions between a weaker overtone or com-bination band and a fundamental of the same or similar frequency, known as Fermi resonance bands. In the lat-ter case, two relatively strong absorptions are observed, where normally only a single absorption is expected for the fundamental.⊲3⊳
functional groups or the basic substructure. Such interac-tions can be severe, and result in overwhelming distorinterac-tions in the appearance of the spectrum, a good example being hydrogen bonding. This will be dealt with in depth later.
3 SPECTRAL INTERPRETATION BY
APPLICATION OF VIBRATIONAL
GROUP FREQUENCIES
This section includes tabulated data relative to the most significant group frequencies for the most common functional groups and structural components found in organic compounds. Brief reference is also made to simple inorganic compounds, in the form of simple ionic species. More detailed listings can be found in published literature, and the reader is encouraged to acquire one or more of these reference texts.⊲9 – 13⊳As already indicated, the use
of tabulated data is only a part of the interpretation process, and other facets of the spectrum must be taken into account.
To help gain an understanding of infrared spectral interpretation, it is instructive to start at the root of most organic compounds, namely the fundamental backbone or the parent hydrocarbon structure. We shall start with the simple, aliphatic hydrocarbon, which is at the root of most aliphatic compounds. Aliphatic hydrocarbons exist in simple linear chains, branched chains and in cyclic structures – examples of the linear and branched chain scenarios were provided earlier for hexane isomers. Any one molecule may exist with one or more of these component structures. The infrared spectrum can provide information on the existence of most of these structures, either directly or by inference.
The introduction of unsaturation in the form of a double or triple bond has a profound impact on the chemistry of the molecule, and likewise it has a significant influence on the infrared spectrum. Similarly, the same is observed when an aromatic structure is present within a molecule. Infrared spectroscopy is a powerful tool for identifying the presence of these functionalities. It provides information specific to the group itself, and also on the interaction of the group with other parts of the molecule and on the spatial properties of the group. Examples of these include conjugation between a double bond and another unsaturated center, an aromatic ring or a group, such as a carbonyl (CDO), and the orientation or location of the double bond within the molecule, such ascisortransand medial or terminal. It should be noted thatcis/transrelationships are not specific to unsaturated hydrocarbons, and the terminology is referenced elsewhere, such as with secondary amide structures. Again, the associated changes in the spatial
arrangement of the groups involved is reflected in the infrared spectrum as additional bands and added complexity.
As we move on to simple organic compounds, where one or more functional groups or heteroatoms are added to the molecule, we see many changes occurring in the spectrum. These result from the bonding associated with the functional group, and also local disturbances to the basic backbone spectrum that relate again to spatial changes and also to local and neighboring electronic effects. Examples of such functionalities are halogens, simple oxygen species, such as hydroxy and ether groups, and amino compounds. Carbonyl compounds, where the added functional group includes the CDO bond, also provide very profound contributions to the spectrum, and because of the wide diversity of these compounds they are best dealt with as a separate class.
A very characteristic group of compounds, from a spectral point of view, are the multiple-bonded nitrogen compounds, such as cyanides and cyanates. These typically have very characteristic absorptions, which are easy to assign, and are free from spectral interferences. The same can be said for some of the hydrides of heteroatoms, such as sulfides (thiols), silanes, and phosphines. Finally, there are other, oxygen-containing functional groups, as encountered in the nitrogen-oxy (NOx), phosphorus-oxy (POx), silicon-oxy (SiOx), and sulfur-oxy (SOx) compounds. These are sometimes more difficult to identify from first principles, and a knowledge of the presence of the heteroatom is helpful. The spectra are characteristic, but many of the oxy absorptions occur within a crowded and highly overlapped region of the spectrum, mainly between 1350 and 950 cm 1. Also, many of these compounds feature C O bonding, which is common in other frequently encountered functionalities such as ethers and esters.
3.1 The Hydrocarbon Species and Molecular Backbone
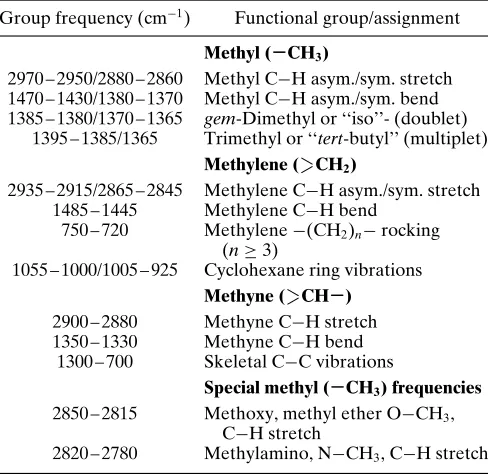
Table 1 Saturated aliphatic (alkane/alkyl) group frequencies
Group frequency (cm 1) Functional group/assignment
Methyl (−CH3)
2970 – 2950/2880 – 2860 Methyl C H asym./sym. stretch 1470 – 1430/1380 – 1370 Methyl C H asym./sym. bend 1385 – 1380/1370 – 1365 gem-Dimethyl or ‘‘iso’’- (doublet)
1395 – 1385/1365 Trimethyl or ‘‘tert-butyl’’ (multiplet) Methylene ( CH2)
2935 – 2915/2865 – 2845 Methylene C H asym./sym. stretch 1485 – 1445 Methylene C H bend
750 – 720 Methylene (CH2)n rocking
(n½3)
1055 – 1000/1005 – 925 Cyclohexane ring vibrations Methyne ( CH−)
2900 – 2880 Methyne C H stretch 1350 – 1330 Methyne C H bend
1300 – 700 Skeletal C C vibrations
Special methyl (−CH3) frequencies 2850 – 2815 Methoxy, methyl ether O CH3,
C H stretch
2820 – 2780 Methylamino, N CH3, C H stretch
3.1.1 Saturated Aliphatic and Alicyclic Compounds
See Table 1. The C H stretch vibrations for methyl and methylene are the most characteristic in terms of recognizing the compound as an organic compound containing at least one aliphatic fragment or center. The bending vibrations help to tell more about the basic structure. For example, a strong methylene/methyl band (1470 cm 1) and a weak methyl band (1380 cm 1), plus
a band at 725 – 720 cm 1 (methylene rocking vibration)
is indicative of a long-chain linear aliphatic structure (note that splitting may be observed for the 1470 and 720 cm 1 bands, which is indicative of a long-chain
compound, and is attributed to a crystallinity and a high degree of regularity for the linear backbone structure). In contrast, strong methyl bands, showing significant splitting, and a comparatively weaker methylene/methyl band indicate chain branching, and the possibility of isopropyl or tert-butyl substituents (depending on the amount of splitting, and the relative band intensities). A comparison between linear and branched chain hydrocarbons can be seen in Figures 3 and 4, where in the case of isooctane, both isopropyl and tert-butyl groups are present.
3.1.2 Unsaturated Compounds
See Table 2. As already commented upon, the saturated hydrocarbon C H stretching absorptions all occur below 3000 cm 1. Any band structures observed between 3150
and 3000 cm 1 are almost exclusively indicative of
unsaturation (CDC H) and/or aromatic rings. The
Table 2 Olefinic (alkene) group frequencies
Origin Group frequency, Assignment wavenumber (cm 1)
CDC 1680 – 1620 Alkenyl CDC stretch 1625 Aryl-substituted CDC 1600 Conjugated CDC
C H 3095 – 3075 Terminal (vinyl) C H stretch C3040 – 3010
3095 – 3075 Pendant (vinylidene) C H stretch
3040 – 3010 Medial,cis- ortrans-C H stretch
C H 1420 – 1410 Vinyl C H in-plane bend 1310 – 1290 Vinylidene C H in-plane
bend
C H 995 – 985C915 – 890 Vinyl C H out-of-plane bend 895 – 885 Vinylidene C H out-of-plane
bend
C H 970 – 960 trans-C H out-of-plane bend 700 (broad) cis-C H out-of-plane bend
4000 3600 3200 2800 2400 2000 1800 1600 1400 1200 1000 800 600
100
80
60
40
20
0
Wavenumber (cm
−1)
T
ransmittance (%)
C C H H
H
(CH2)3 CH3
Figure 5 ATR spectrum of 1-hexene. Copyright Coates
Con-sulting.
Table 3 Aromatic ring (aryl) group frequencies
Origin Group frequency, Assignment wavenumber (cm 1)
CDC Ca 1615 – 1580 Aromatic ring stretch
CDC Ca 1510 – 1450 Aromatic ring stretch
C H 3130 – 3070 Aromatic C H stretch C H 1225 – 950 (several) Aromatic C H in-plane
bend C H 900 – 670 (several) Aromatic C H
out-of-plane bend 770 – 730C710 – 690 Monosubstitution (phenyl)
770 – 735 1,2-Disubstitution (ortho) 810 – 750C900 – 860 1,3-Disubstitution (meta)
860 – 800 1,4-Disubstitution (para) ‘‘Combi’’b 2000 – 1660 (several) Aromatic combination
bands
aCDC C used as an approximation of the unique aromatic ring
bonding.
b‘‘Combi’’ denotes assignment to combination bands.
3.1.3 Aromatic Compounds
See Table 3. The existence of one or more aromatic rings in a structure is normally readily determined from the C H and CDC C ring-related vibrations. The C H stretching occurs above 3000 cm 1 and is typically
exhibited as a multiplicity of weak-to-moderate bands, compared with the aliphatic C H stretch. The structure of the bands is defined by the number and positions of the C H bonds around the ring, which in turn are related to the nature and number of other substituents on the ring. Note that the same applies to the C H out-of-plane bend-ing vibrations, which are frequently used to determine the degree and nature of substitution on the ring – examples are provided in Figure 6(a – c), with the comparison of the three xylene isomers. This picture often becomes more complex if multiple- or fused-ring structures exist in a compound. The other most important set of bands are the aromatic ring vibrations centered around 1600 and 1500 cm 1, which usually appear as a pair of band
structures, often with some splitting. The appearance and ratio of these band structures is strongly dependent on the position and nature of substituents on the ring.
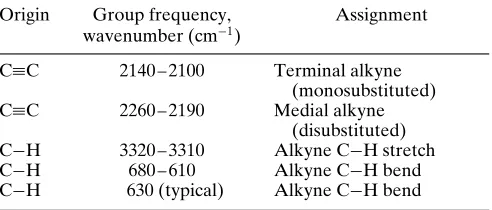
3.1.4 Acetylenic Compounds
See Table 4. Although acetylenic compounds are not very common, the spectrum associated with the CC structure can be characteristic. It is instructive to note the impact on the carbon – carbon bond stretching as a function of increase in bond order for the series of single-, double-, and triple-bonded carbon:
C C stretch:¾1350 – 1000 cm 1(skeletal vibrations) CDC stretch: 1680 – 1620 cm 1
CC stretch: 2260 – 2100 cm 1
4000 3600 3200 2800 2400 2000 1800 1600 1400 1200 1000 800
100
80
60
40
20
0
CH3
H
H H
CH3
H
(a)
4000 3600 3200 2800 2400 2000 1800 1600 1400 1200 1000 800
100
80
60
40
20
0
T
ransmittance (%)
CH3
H
H CH3
H
H
(b)
4000 3600 3200 2800 2400 2000 1800 1600 1400 1200 1000 800
100
80
60
40
20
0
Wavenumber (cm
−1)
CH3
CH3
H
H
H
H
(c)
Figure 6 ATR spectra of xylene isomers: (a)o-xylene,
1,2-dimethylbenzene; (b)m-xylene, 1,3-dimethylbenzene; (c)p -xylene, 1,4-dimethylbenzene. Copyright Coates Consulting.
Table 4 Acetylenic (alkyne) group frequencies
Origin Group frequency, Assignment wavenumber (cm 1)
CC 2140 – 2100 Terminal alkyne (monosubstituted) CC 2260 – 2190 Medial alkyne
(disubstituted) C H 3320 – 3310 Alkyne C H stretch C H 680 – 610 Alkyne C H bend C H 630 (typical) Alkyne C H bend
constant,k(see Equation 3), supporting the Hooke’s law model described earlier.
As noted in Table 4, the position of the CC bond is influenced by whether the group is terminal or medial. The single hydrogen of the terminal acetylene itself is very characteristic, reflecting the labile nature of the acetylenic C H.
3.2 Simple Functional Groups
Obviously, there is a potentially broad number of molecular fragments that can be considered to be functional groups attached to an organic structure or backbone. This section features the most simple and most common of the functional groups, C X, i.e. the halogens (XDF, Cl, Br and I), hydroxy (XDOH), oxy or ether (XDOR, where RDalkyl), and amino (XDNH2, DNH or N). With the exception of the
carbonyl functionality, these three basic functional groups cover most of the common occurrences in simple organic compounds. Note that for the oxy/hydroxy and amino functionalities, these are molecular fragments, and they contribute their own set of characteristic absorptions to the spectrum of the compound. In fact, the bonding between the functional group and the backbone is only one part of the overall picture used for the spectral interpretation.
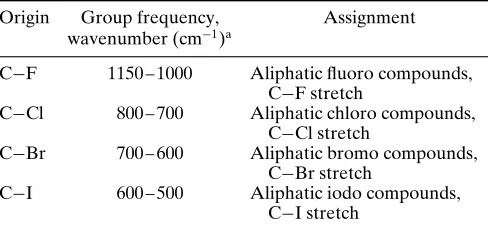
3.2.1 Halogenated Compounds
See Table 5. In principle, the interpretation of the spectra of molecules containing one or more halogens would seem to be straightforward. The functionality is simple, with just a single atom linked to carbon to form the group. With the polar nature of this group, one would expect the spectral contribution to be distinctive. In reality, this is not always the case.
In aliphatic compounds, the C X bond typically possesses a unique group frequency, which may be
Table 5 Aliphatic organohalogen compound group
frequencies
Origin Group frequency, Assignment wavenumber (cm 1)a
C F 1150 – 1000 Aliphatic fluoro compounds, C F stretch
C Cl 800 – 700 Aliphatic chloro compounds, C Cl stretch
C Br 700 – 600 Aliphatic bromo compounds, C Br stretch
C I 600 – 500 Aliphatic iodo compounds, C I stretch
a Note that the ranges quoted serve as a guide only; the actual ranges
are influenced by carbon chain length, the actual number of halogen substituents, and the molecular conformations present.
assigned to the halogen – carbon stretching. When a single halogen is present, the determination of this group is straightforward. However, if more than one halogen is present, the interpretation is usually more complex. In such cases, the result varies depending on whether the halogens are on the same or different carbon atoms, and, if on different atoms, whether the atoms are close neighbors. This is particularly the case with small molecules, and the resultant spectral complexity arises from the fact that there is restricted rotation about the carbon – carbon bond.
Single bonds usually exhibit free rotation, which would normally mean that there are no preferred spatial orientations for the molecules. However, owing to the size of the halogen atom, relative to the carbon and hydrogen that form the backbone, the molecules tend to exhibit certain specific conformations, where the spatial interaction between neighboring halogen atoms is minimized, and each conformation provides its own contribution to the overall spectrum. It is important to appreciate that this issue of spatial orientation has an impact even on high-molecular-weight compounds, such as the polyhalogenated polymers, e.g. poly(vinyl chloride). Here preferred orientations have an impact on the crystallinity of the polymer, and this in turn has a significant impact on both the spectrum and the physical properties of the material.
Another important issue to consider with halogen substituents is the high electronegativity of the halogen atom. This can have a noticeable impact on the spectrum of neighboring group frequencies, including adjacent hydrogen atoms. In such cases, significant shifting of the C H frequencies can occur – the direction of the shift being dependent on the location of the C H, and whether the halogen adds or extracts electron density from the C H bond – adding strengthens (higher frequency) and extracting weakens (lower frequency). The same influences can be observed with halogen-substituted carbonyl compounds, such as acyl halides and a-substituted acids, where the bond strength of the carbonyl group is increased (see section 3.3). In most cases, both a shift to higher frequency and an increase in absorption strength for the band are observed.
to other absorptions by as much as three to four times. For reference, it is informative to compare the intensities for these bands, between 1150 and 1000 cm 1, for the
spectra of toluene and chlorobenzene (Figure 7a and b).
3.2.2 Hydroxy and Ether Compounds
See Table 6 for alcohols and hydroxy compounds. The hydroxy function is probably one of the most dominant and characteristic of all of the infrared group frequencies. In most chemical environments, the hydroxy group does not exist in isolation, and a high degree of association is experienced as a result of extensive hydrogen bonding with other hydroxy groups. These hydroxy groups may be within the same molecule (intramolecular hydrogen bonding) or they most likely exist between neighboring molecules (intermolecular hydrogen bonding). The impact of hydrogen bonding is to produce significant band broadening and to lower the mean absorption frequency. The lowering of the frequency tends to be a function of the degree and strength of the hydrogen bonding. In compounds such as carboxylic acids, which exhibit extremely strong hydrogen bonding, forming a stable dimeric structure, a highly characteristic, large shift to lower frequencies is observed.
4000 3600 3200 2800 2400 2000 1800 1600 1400 1200 1000 800 600
100
80
60
40
20
0
Wavenumber (cm
−1)
T
ransmittance (%)
(a)
Cl H
H H
H
H
4000 3600 3200 2800 2400 2000 1800 1600 1400 1200 1000 800
100
80
60
40
20
0
Wavenumber (cm
−1)
T
ransmittance (%)
(b)
CH3 H
H
H
H H
Figure 7 Comparison of ATR spectra of (a) chlorobenzene
and (b) toluene. Copyright Coates Consulting.
Table 6 Alcohol and hydroxy compound group frequencies
Origin Group frequency, Assignment wavenumber (cm 1)
O H 3570 – 3200 (broad) Hydroxy group, H-bonded OH stretch
3400 – 3200 Normal ‘‘polymeric’’ OH stretch
3550 – 3450 Dimeric OH stretch
3570 – 3540 Internally bonded OH stretch O H 3645 – 3600 (narrow) Nonbonded hydroxy group,
OH stretch
3645 – 3630 Primary alcohol, OH stretch 3635 – 3620 Secondary alcohol, OH stretch 3620 – 3540 Tertiary alcohol, OH stretch 3640 – 3530a Phenols, OH stretch
O H 1350 – 1260 Primary or secondary, OH in-plane bend
1410 – 1310 Phenol or tertiary alcohol, OH bend
720 – 590 Alcohol, OH out-of-plane bend
C O ¾1050b Primary alcohol, C O stretch
¾1100b Secondary alcohol, C O
stretch
¾1150b Tertiary alcohol, C O stretch
¾1200b Phenol, C O stretch
aFrequency influenced by nature and position of other ring substituents. bApproximate center of range for the group frequency.
In special circumstances, where the hydroxy group is isolated – either because of steric hindrance effects or because the sample is in the vapor state or in a dilute solution of a nonpolar solvent – the band is characteristically narrow, and is observed at the natural, higher frequency. This absorption is important for the characterization of certain hindered phenol antioxidants, a commercially important class of compounds in the food, polymer, and formulated oil industries.
to another form of bending vibration, the out-of-plane bend or wagging vibration of the O H. The OH bend-ing vibrations are broadened by hydrogen bondbend-ing as is the stretching absorption, but often to a lesser extent. The differences between primary and secondary alcohols can be appreciated from Figure 8(a) and (b), where the spectra of 1- and 2-octanol are presented.
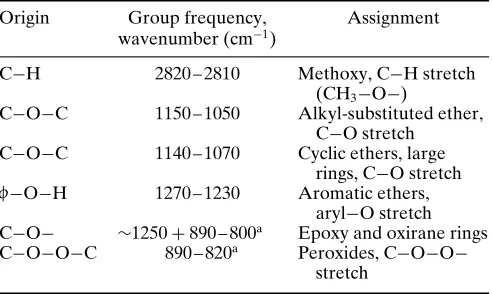
See Table 7 for ethers and oxy compounds. In some respects, ethers are related to alcohol and hydroxy
4000 3600 3200 2800 2400 2000 1800 1600 1400 1200 1000 800 600
100
50
0
Wavenumber (cm
−1)
T
ransmittance (%)
(a)
4000 3600 3200 2800 2400 2000 1800 1600 1400 1200 1000 800 600
100
50
0
Wavenumber (cm
−1)
T
ransmittance (%)
(b)
Figure 8 ATR spectra of (a) primary (1-octanol) and (b)
sec-ondary (2-octanol) alcohols. Copyright Coates Consulting.
Table 7 Ether and oxy compound group frequencies
Origin Group frequency, Assignment wavenumber (cm 1)
C H 2820 – 2810 Methoxy, C H stretch (CH3 O )
C O C 1150 – 1050 Alkyl-substituted ether, C O stretch
C O C 1140 – 1070 Cyclic ethers, large rings, C O stretch
f O H 1270 – 1230 Aromatic ethers, aryl O stretch C O ¾1250C890 – 800a Epoxy and oxirane rings
C O O C 890 – 820a Peroxides, C O O
stretch
a Typically very weak, and not very characteristic in the infrared. Tend
to be more characteristic in the Raman spectrum.
compounds, where the hydrogen of the hydroxy group is replaced by an aliphatic (alkyl) or aromatic (aryl) molecular fragment. Having stated that, the overall appearance of an ether spectrum is drastically different from that of a related alcohol. This is due to the overwhelming effect of hydrogen bonding on the hydroxy group. However, many of the relationships that exist for the C O component of the alcohol carry over to the corresponding ether. The relationships that pertain to primary, secondary, and tertiary structures remain intact. The main difference is that one now considers the bonding on both sides of the oxygen, because if carbon is on both sides, then two ether bonds exist. Ethers can exist as simple ethers (same group both sides) and mixed ethers (different groups both sides). Infrared spectroscopy is fairly sensitive for differentiating these ether functions, especially when the structures are mixed aliphatic or aliphatic/aromatic.
3.2.3 Amino Compounds
See Table 8. In some respects, the infrared spectra and the characteristic group frequencies of amines tend to
Table 8 Amine and amino compound group frequencies
Origin Group frequency, Assignment wavenumber (cm 1)
Primary amino
N H 3400 – 3380 Aliphatic primary amine, C3345 – 3325 NH stretch
N H 3510 – 3460 Aromatic primary amine, C3415 – 3380 NH stretch
N H 1650 – 1590 Primary amine, NH bend C N 1090 – 1020 Primary amine, CN stretch
Secondary amino
N H 3360 – 3310 Aliphatic secondary amine, NH stretch
N H ¾3450 Aromatic secondary amine, NH stretch
N H 3490 – 3430 Heterocyclic amine, NH stretch DN H 3350 – 3320 Imino compounds,
NH stretch
N H 1650 – 1550 Secondary amine, NH bend C N 1190 – 1130 Secondary amine,
CN stretch Tertiary amino
C N 1210 – 1150 Tertiary amine, CN stretch Aromatic amino
C N 1340 – 1250 Aromatic primary amine, CN stretch
C N 1350 – 1280 Aromatic secondary amine, CN stretch
parallel those of alcohols and ethers. Before proceeding, there is an important distinction to be made between the nomenclature used to describe alcohol structures, compared with that used for amines. The terms primary, secondary, and tertiary are used to describe amines, but the substitution relates to the nitrogen, not the adjoining carbon (as with alcohols). The terminology used is NH2
primary, NH secondary and N tertiary. As before, these structural differences are important, and they strongly influence the chemistry and the reactivity of the nitrogen and the N H group (primary and secondary). Again, the infrared spectrum is very diagnostic, and it is possible to differentiate readily the functional group structures, especially for the primary and secondary amino compounds (see Figure 9a – c for an example comparison of primary, secondary, and tertiary aromatic amines).
As with hydroxy compounds, hydrogen bonding is important, but the effect tends to be weaker than for the hydroxy group, and the overall effect on the spectrum is slightly less pronounced. This situation alters in the related ammonium and amino salts, where strong hydrogen bonding is experienced, and a corresponding broadening of the associated NH absorptions is observed. Note that only the primary and secondary amines exhibit the most characteristic group frequencies, which are associated with the N H bond. Tertiary amines are very comparable to ethers, and the main diagnostic information is gathered from the C N vibrations only. An important exception is the methylamino (and dimethyl-amino) group, which like its counterpart (methoxy in ethers) has a characteristic C H stretching vibration at lower than the normal C H stretching frequency for methyl.
3.3 The Carbonyl Group
Carbonyl compounds are not only chemically important, but are also important in the interpretation of infrared spectra. The CDO absorption is almost always one of the most characteristic in the entire spectrum, and it is also most likely to be the most intense spectral feature. Table 9 provides an example listing of some of the common carbonyl frequencies as a function of the particular type of carbonyl group. In essence, a ketone is considered the root compound, with an aldehyde being a special case, where the carbonyl group is terminal, and only has one substituent, the other being a single hydrogen atom. All of the other carbonyl compounds, in a way, can be considered to be derived from the base ketone structure, where one or both alkyl (or aryl) substituents are replaced by another functionality, e.g. from a single hydroxy group, in the case of carboxylic acids, to two ether groups, as in the case of an organic carbonate.
NH2 H
H H
H
H
4000 3600 3200 2800 2400 2000 1800 1600 1400 1200 1000 800 600
100
80
60
40
20
0
(a)
4000 3600 3200 2800 2400 2000 1800 1600 1400 1200 1000 800 600
100
80
60
40
20
0
T
ransmittance (%)
(b)
NH H
H H
H
H CH3
4000 3600 3200 2800 2400 2000 1800 1600 1400 1200 1000 800 600
100
80
60
40
20
0
Wavenumber (cm
−1)
(c)
N H
H H
H
H CH3 CH3
Figure 9 ATR spectra of (a) primary (aniline), (b) secondary
(N-methylaniline) and (c) tertiary (N,N-dimethylaniline) aro-matic amines. Copyright Coates Consulting.
Table 9 Example carbonyl compound group frequencies
Group frequency (cm 1) Functional group
1610 – 1550/1420 – 1300 Carboxylate (carboxylic acid salt)
1680 – 1630 Amide
1690 – 1675/(1650 – 1600)a Quinone or conjugated ketone
1725 – 1700 Carboxylic acid 1725 – 1705 Ketone 1740 – 1725/(2800 – 2700)b Aldehyde
1750 – 1725 Ester
1735 Six-membered ring lactone 1760 – 1740 Alkyl carbonate
1815 – 1770 Acid (acyl) halide 1820 – 1775 Aryl carbonate
1850 – 1800/1790 – 1740 Open-chain acid anhydride 1870 – 1820/1800 – 1775 Five-membered ring
anhydride
2100 – 1800 Transition metal carbonyls
aLower frequency band is from the conjugated double bond.
bHigher frequency band characteristic of aldehydes, associated with
the terminal aldehydic C H stretch.
As previously discussed, a lowering of the parent group frequency is observed. This effect is important for the differentiation of certain types of carbonyl compound, in the determination of whether the carbonyl group is directly or indirectly attached an aromatic ring, e.g. the ability to differentiate aryl acetates from alkyl benzoates. In the case of the acetate, the ring is joined to the ‘‘ether oxygen’’ of the ester group, and is not conjugated with the carbonyl, whereas with the benzoate, the ring is directly conjugated with the group, and the carbonyl absorption frequency is correspondingly lowered.
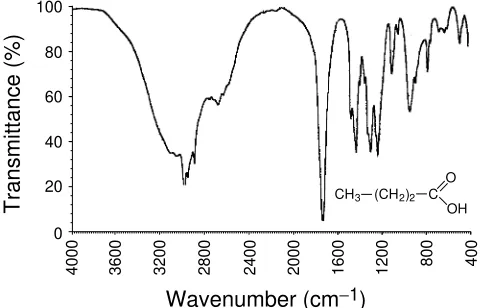
Often, the frequency ranges for the different classes of carbonyl compound overlap, and the carbonyl frequency alone is not sufficient to characterize the functional group. In most cases, spectral information from the other component of the functional group is used for the characterization. Carboxylic acids are a good example, where the C O, C O H and O H vibrations are highly characteristic. Similarly, esters (C O C) and amides (C N and N H) are other frequently encountered examples. The frequencies provided earlier for these additional functionalities (C O, C N, and N H) in general apply, although the actual observed frequencies may differ slightly, being modified by the carbonyl group. It is worthwhile returning momentarily to carboxylic acids, because they are unique, in so far as the hydroxy group has direct interaction with the carbonyl group, by the formation of a stable dimeric hydrogen-bonded structure in the condensed phase (solid and liquid). Note that this structure disappears in the vapor state. A characteristic broad feature in the range 3300 – 2500 cm 1,
that overlaps the C H stretching region, and with a secondary absorption close to 2600 cm 1, is observed for
the hydrogen-bonded O H of most carboxylic acids. The impact of this overlap can be appreciated by reference to the spectrum of butyric acid, provided in Figure 10. Other bands that are associated with the C O and O H components tend to be less pronounced, and sometimes may be overlapped with other fingerprint absorptions of the molecule. These are located in the ranges 1320 – 1210 cm 1(C O stretch) and 960 – 850 cm 1
(hydrogen-bonded O H out-of-plane bending).
3.4 Other Functional Groups Associated with Heteroatoms
Potentially there are very large numbers of different organic-based compounds that are associated with one or more heteroatoms. These are in addition to the simple halogen- and amino-based compounds that have already been covered. A detailed discussion of such compounds is beyond the scope of this article. A few illustrative examples are included here in order to provide the reader with a feel for the spectral contributions of commonly encountered compounds that feature heteroatoms. These include triple-bonded and cumulated double-bonded nitrogen compounds, such as cyano and cyanato com-pounds, hetero-oxy comcom-pounds, such as nitro, sulfoxy, phosphoroxy and silicoxy compounds, and thiols and thio-substituted compounds. Many of these belong to important compound classes, and complete texts exist that focus on the spectral attributes of such compounds.
3.4.1 Multiple-bonded and Cumulated Double-bonded Nitrogen Compounds
Nitrogen compounds featuring triple or cumulated double bonds, such as cyanides or nitriles ( CN) and cyanates ( O CN), all provide a unique spectrum, typically with a single, normally intense absorption at 2280 – 2200 cm 1
100
80
60
40
20
0
4
0
0
0
3
6
0
0
3
2
0
0
2
8
0
0
2
4
0
0
2
0
0
0
1
6
0
0
1
2
0
0
8
0
0
4
0
0
T
ra
n
s
m
it
ta
n
c
e
(
%
)
Wavenumber (cm
−1)
CH3 (CH2)2 C
O
OH
Figure 10 Transmission spectrum ofn-butyric acid. Copyright
(for cyano compounds) and 2285 – 1990 cm 1 (cyanates,
isocyanates, thiocyanates, etc.). The band is assigned to the stretching vibration, which is the asymmetric stretch in the case of the cumulated double-bonded compounds (the symmetric stretch is typically weak, and is not diagnostic of the group).
Double-bonded nitrogen groups, such as imino groups ( CDN ) and azo groups ( NDN ), exhibit absorptions close to the carbonyl (CDO) and alkene (CDC) double bond stretching region. While they are characteristic for the functional group, they are sometimes difficult to assign from first principles because of the overlap with other common functional groups in the region. For example, dependent on substitution or location, the CDN group can occur in the same spectral region as the CDO of an amide. Examples of the group frequencies for a few common multiple-bonded and cumulated double-bonded compounds are provided in Table 10.
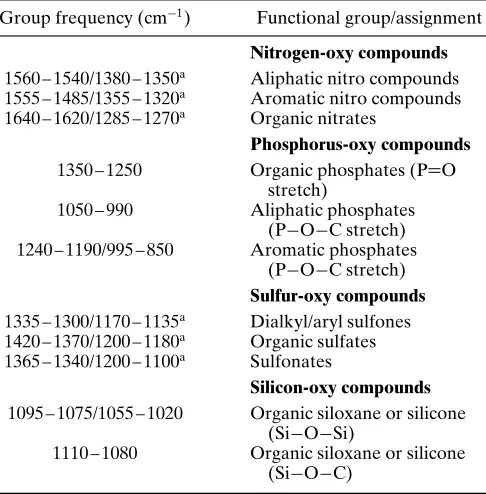
3.4.2 Hetero-oxy Compounds
The group of compounds covered here feature X O (where XDnitrogen, sulfur, phosphorus, and silicon) and XDO vibrations. In general, the characteristic absorp-tions span a similar range to that covered by the corresponding carbon – oxygen compounds, with most of the stretching frequencies observed within the main fingerprint spectral region (1500 – 400 cm 1). Many of
the compounds can be considered to be analogs of ethers, especially when an alkoxy group is present, featuring the X O C linkage. Interestingly, the nitro group ( NO2) is isoelectronic with the carboxylate
ion group ( CO2 ), and both provide very similar
spectra for the main functional group. See Table 11 for example group frequencies for hetero-oxy com-pounds.
3.4.3 Thiols and Thio-substituted Compounds
Thiols and thio-substituted compounds, by definition, can be considered to be the direct analogs of the equivalent
Table 10 Examples of nitrogen multiple and cumulated
double bond compound group frequencies
Group frequency (cm 1) Functional group/assignment
2280 – 2240 Aliphatic cyanide/nitrile 2240 – 2220 Aromatic cyanide/nitrile 2260 – 2240/1190 – 1080 Cyanate ( OCN and C OCN
stretch)
2276 – 2240 Isocyanate ( NDCDO asym. stretch)
2175 – 2140 Thiocyanate ( SCN) 2150 – 1990 Isothiocyanate ( NCS) 1690 – 1590 Open-chain imino ( CDN ) 1630 – 1575 Open-chain azo ( NDN )
Table 11 Example group frequencies for simple hetero-oxy
compounds
Group frequency (cm 1) Functional group/assignment
Nitrogen-oxy compounds 1560 – 1540/1380 – 1350a Aliphatic nitro compounds
1555 – 1485/1355 – 1320a Aromatic nitro compounds
1640 – 1620/1285 – 1270a Organic nitrates
Phosphorus-oxy compounds 1350 – 1250 Organic phosphates (PDO
stretch)
1050 – 990 Aliphatic phosphates (P O C stretch) 1240 – 1190/995 – 850 Aromatic phosphates
(P O C stretch) Sulfur-oxy compounds 1335 – 1300/1170 – 1135a Dialkyl/aryl sulfones
1420 – 1370/1200 – 1180a Organic sulfates
1365 – 1340/1200 – 1100a Sulfonates
Silicon-oxy compounds 1095 – 1075/1055 – 1020 Organic siloxane or silicone
(Si O Si)
1110 – 1080 Organic siloxane or silicone (Si O C)
a Asymmetric/symmetric XO
2stretch (NO2and SO2).
oxygenated compounds such as alcohols and ethers. Unlike the oxygen-containing analogs, the equivalent C S and C S H stretching vibrations tend to give rise to very weak absorptions in the infrared spectrum. The C S and S H bonds are highly polarizable, and hence produce stronger spectral activity in the Raman spectrum than the infrared spectrum. The higher mass of sulfur, compared with oxygen, results in the characteristic group frequencies occurring at noticeably lower frequencies than the oxygen-containing analogs, as noted in Table 12 for compounds containing S H and C S bonds. The thiol S H is probably the only infrared absorption that can be considered to be of use for the general characterization of these compounds, and most of the others are obtained by inference, or from knowledge of the compound type. Catenation is a unique chemical characteristic of sulfur, where the formation of S S bonds in extended chains is common, hence the inclusion here of the S S stretching frequencies.
3.5 Simple Inorganics
Table 12 Common group frequencies for thiols and thio-substituted compounds
Group frequency (cm 1) Functional group/assignment
2600 – 2550 Thiols (S H stretch) 710 – 685 Thiol or thioether, CH2 S
(C S stretch)
660 – 630 Thioethers, CH3 S (C S
stretch)
715 – 670 Aryl thioethers,f S (C S stretch)
705 – 570 Disulfides (C S stretch) 620 – 600 Disulfides (S S stretch) 500 – 430 Aryl disulfides (S S stretch) 500 – 470 Polysulfides (S S stretch)
Table 13 Example group frequencies for common inorganic
ions
Group frequency (cm 1) Functional group/assignment
1490 – 1410/880 – 860a Carbonate ion
1130 – 1080/680 – 610a Sulfate ion
1380 – 1350/840 – 815a Nitrate ion
1100 – 1000 Phosphate ion 1100 – 900 Silicate ion 3300 – 3030/1430 – 1390a Ammonium ion
2200 – 2000 Cyanide ion, thiocyanate ion, and related ions
a Typically, the first absorption is intense and broad, and the second
has weak to medium intensity and is narrow. Both often exist as multiple band structures, and this may be used to characterize individual compounds.
have already been covered for inorganic compounds in the form of salts of carboxylic acids and amino and ammonium compounds, which can be extended to metal complexes, chemical fragments associated with hetero-oxy groups (nitrates, sulfates, phosphates, silicates, etc.), and transition metal carbonyl compounds. All complex ionic compounds (containing more than one atom) and coordination compounds produce characteristic spectra. Many of the associated group frequencies can be used diagnostically for characterization. The structure and orientation of the ion or complex, both as an isolated entity or within a crystal lattice, are important factors that affect the appearance and nature of the infrared spectrum. Hydration of compounds (water of crystallization) also has a large effect on the spectrum, and often adds a lot of complexity, in the form of additional absorption bands and structure to existing bands. The subject is far too broad to be covered in this article, and only a few example group frequencies are included here (Table 13). The reader is directed to the recommended standard texts for more detailed information.⊲13,14⊳
4 THE PRACTICAL SITUATION –
OBTAINING THE SPECTRUM AND
INTERPRETING THE RESULTS
Up to this point, the fundamentals of interpretation have been discussed from the most basic concepts of infrared absorption by a molecular species and the impact of chemical functionality on the resultant spectrum. In many ways, this discussion has treated the molecule as a more or less isolated species, with no consideration of the physical state of the actual sample or the environment in which the molecule exists. Physical state and the molecular, chemical and physical environments have a profound effect on the infrared spectrum. As a result, it is just as important to understand and interpret these effects as it is to perform the fundamental interpretation of the functional groups from first principles.
This particular section may be one of the most important for many of the readers, because it reflects the real world, that is taking a sample, preparing it for analysis, and making use of all of the available information on the sample and the spectrum or spectra obtained. Note that sometimes there are several options in the way that a sample may be handled for infrared analysis. It is often beneficial to consider the different options. Before we start to examine the situation it is important to understand the importance of the interpretation and to determine the real requirements. Here are some example scenarios:
1. The sample (or spectrum) is a ‘‘total unknown’’ and an identification is required – examples include forensic samples, environmental waste samples, or new discovery samples, where a new material has been synthesized or discovered.
2. The sample (or spectrum) is an unknown and it needs to be characterized or classified – examples include commercial applications where new additives or components are included in a material to pro-vide a specific property; in such cases this could be considered the basis of competitive product analy-sis.
3. The sample generally is known but the existence of a specific chemical class needs to be determined – examples include contaminant analysis, analysis for toxicology or environmental reasons, material additives, etc.
There are clearly many other scenarios that can be considered, and the examples presented may cross over into more than one of these scenarios. However, the idea here is to help define a strategy for the interpretation. For the most part, this text will focus on scenarios 1 and 2, although a passing reference may be made to the others. Note also that there are two ways to address the interpretation:
ž one is to attempt to assign as many bands as possible using group frequency tables;
ž the other is to attempt to build up a picture using information from key spectral bands (with a knowl-edge of the group frequencies) and rationalizing the spectrum relative to the sample as known, and any known history, including the sample preparation and presentation technique.
The latter approach is the best way to go, and is typically far more rewarding. Also, it is seldom that all bands in the infrared spectrum of a sample can be fully or accurately assigned. There are too many ambiguities and coincidences for a definitive interpretation to be obtained from the spectra of most materials – remembering, of course, that the sample may be a mixture.
To begin, let us start from either the point where a spectrum has been generated or where a sample is presented. In practice, these are very different starting points. The latter is always preferred because with the sample in hand it is possible to gain a lot of first-hand information about nature which will ultimately help in the final interpretation. The term ‘‘unknown’’ is used because this is how people often view the interpretation process; however, in reality there are seldom true unknowns – in other words, the reason for the interpretation itself often provides implied information about the sample. Even if a person presents a prerecorded spectrum, it is usually accompanied by some additional information. This at minimum should include a knowledge of how the sample was prepared, whether it is a solid, liquid, or gas, or some mixed state, and maybe some physical characteristics (color, appearance, melting point/boiling point, etc.). For the benefit of presenting a complete picture, we shall assume that the sample is available and that we have the opportunity to perform additional tests and measurements on it. Further, more detailed discussions of this practical approach can be found in the literature.⊲18 – 20⊳
4.1 Sample History
As noted, we are seldom dealing with a true unknown, and typical situations include the following:
ž a sample of fiber taken or extracted from a particular environment;
ž a contaminant removed from a material;
ž a suspicious liquid found leaking out of some drums; ž a residue extracted from a surface;
ž a residual liquid or solid remaining after storage or treatment of a product;
ž extracted additives or components from a commercial product;
ž a mass that was produced after a specific chemical reaction;
ž or simply a manufactured product.
Most people can equate with these different sets of circumstances. Each one brings information about the sample.
In the case of a fiber, if it is organic, then it typically fits within certain classes of polymeric materials. It may have orientation properties, which will influence the appearance of the infrared spectrum, depending on how it is sampled, and if there is more than one fiber, then the original material may have been a blend. The environment from where the sample was taken will be important because there may be surface contaminants that may produce spurious bands in the spectrum, which may be removed by some sample pretreatment, such as washing with a solvent. Alternatively, the fiber may be coated, or degraded, thermally or by oxidation.
The characterization of contaminants is a common application for infrared spectroscopy. For this type of exercise it is necessary to know the importance of the contaminant and why it is believed to be a contaminant. Was it extracted from a liquid or solid matrix? if so, what type of matrix, and what was the composition of the matrix? Is it possible that the contaminant originated from the matrix itself, as a breakdown product? – if so, then there should be some chemical similarities or common heritage. Was it embedded within a matrix, such as a plastic/polymer film or a sheet of paper? – if so, is the contaminant itself potentially contaminated by the matrix? This is especially important for interpretation, because the matrix may have a very intense infrared spectrum of its own.
Looking at residues and residual products of a reaction is similar to the concept of characterizing a contaminant. Residues formed within products are often the result of a breakdown reaction or an unexpected interaction between components. If derived from one or more of the components, then a knowledge of all of the ingredients is essential – again we would be looking for chemically related species in the residue, and reference spectra of each of the ingredients would be important in attempting to characterize the material. In the case of a reaction product, spectra for the reactants and any solvents or substrates (catalysts, etc.) used would be helpful.
Finally, the identification of an end product from its infrared spectrum is common practice. By definition, unless the final product is a pure chemical, most manufactured products are mixtures, often featuring blended solid and/or liquid components from percentage range concentrations to trace amounts. Often at issue is how much can be identified from the interpretation of a single spectrum. It is often necessary to perform some form of preconcentration on one or more ingredients, or to perform a chemical modification to change the spectral response of one or more of the major ingredients. This latter operation may help to remove the spectral interferences from a major component for determining the presence of minor components.
4.2 Physical Characteristics of the Sample
From considerations based on the discussions in the section above, a good working knowledge of the sample allows one to determine basic information about the sample. This information can help in the determination of the best method of sampling. It can also help to indicate if any special treatments to the sample are necessary before proceeding, such as the removal of residual solvents, or the need for selective extraction, in the event that the sample has more than one phase, or is known to be a mixture. Beyond this there are other important physical characteristics of the sample that can assist the interpretation process. As indicated, physical state can be very important. For example, it has been noted that nitro compounds are isoelectronic with organic acid salts. Many simple nitro compounds are liquids, whereas simple carboxylates are usually solids.
There are, however, many other physical characteristics and attributes that can be linked to the sample and its chemistry. This in turn can be linked to important spectral features in the infrared spectrum. Two important charac-teristics are color and odor. Nitrogen compounds often have color associated with them, e.g. nitro-substituted compounds often have a characteristic yellow or orange color, especially substituted phenols and amines. Sim-ilarly, unsaturated nitrogen compounds, such as azo
compounds, and highly conjugated olefinic compounds, such as carotenes, are similarly colored. This can be used as a guide to look for the specific functionality in the spectrum.
Likewise, odor can be a useful guide. This author is not advocating that a person should inhale the vapor of a sample directly, for obvious reasons. However, if under cautious sampling conditions a characteristic odor is detected, then this can provide a valuable insight regard-ing the presence of particular functional groups. Common examples are alcohols, esters, and ketones, which often possess relatively pleasant fragrances, especially when associated with some degree of unsaturation. An almond-like odor might indicate a nitro compound, benzaldehyde, or a cyano compound (caution!), a fish-like odor is often associated with amino or amido compounds, and a putrid or ‘‘bad-cheese’’ odor is associated with certain carboxylic acids. With time, one can build up a mental library of com-mon odors and fragrances, and these can be very valuable for initial material screening, by helping one look for the presence of specific functional groups.
Volatility and flammability can be useful guides. Most volatile compounds tend to have a relatively low molecular weight, and they usually are