and Business Application 5 (2) 103-116 ©UB 2016 University of Brawijaya Malang, Indonesia http://apmba.ub.ac.id
Factors Attributing to Outwards Direct Investments from
Developing Countries to Developed Countries:
Evidence from China and India
Diyah Ayu Amalia Avinaa
Henry Kusuma Adikarab*
aCommunication Science Department,Faculty of Social and Political Science,
University of Brawijaya, Malang, Indonesia; bTanri Abeng University, Jakarta,
Indonesia
Abstract
The purpose of this research is to explore the growing trend of outward foreign direct investments (OFDIs) from developing countries to developed countries. Market-seeking and strategic asset explorations are the main motivations for conducting OFDIs in
developed countries. Meanwhile, cross-border greenfield investments and cross-border
mergers and acquisitions are the main entry strategies used by developing countries when penetrating the developed markets. Finally, this paper reveals mixed results about the explaining ability of John Dunning’s International Development Path (IDP) theory on the patterns of selected developing markets’ OFDIs to developed countries. On the one hand, China’s OFDIs follow the paths in the IDP theory. On the other hand, those
of India do not confirm so.
Keywords
OLI framework, IDP theory, Market, Strategy, Strategic Asset Motivation, Cross-Border
Greenfield Investments, Mergers and Acquisitions
Received: 25 October 2016; Accepted: 14 November 2016; Published Online: 30 December 2016. DOI: 10.21776/ub.apmba.2016.005.02.4
Introduction
There is a global trend toward outward foreign direct investment (OFDI) by developing countries in other countries, especially in developed countries, namely in European Union and the US. For example, BRICS countries (Brazil, Russia, India, China, and South Africa)
are now not only the recipients of inward FDIs but are also actively investing
abroad. Their OFDIs rose significantly
from US$7 billion dollars in 2000 to US$145 billion dollars in 2012, or 10
percent of the world total FDI flows
of which 34 percent are in European Union and 3 percent are in the US. According to Buckley et al (2007) and Dunning (1998), developing countries undertake OFDIs in developed countries in order to take advantage of low labor cost advantages they have. This paper is to discuss motivations of developing countries investing in developed countries and also to discuss strategies they take in doing OFDIs in those countries. It is argued that market seeking and strategic asset seeking are the main motives of developing countries investing in developed countries. Next,
Greenfield investment and cross-border
mergers and acquisitions (M&As) are the main strategies they conduct when doing OFDIs in those countries.
The remainder of this paper is organized as follows. A review of the literature of OFDI is presented in section II. Section III will discuss data and approach to the study and section IV will discuss motivations for doing the outwards investments, respectively. Section V will present entry strategies for outwards investments conducted by developing countries and section VI will overview OFDIs from China and India. Finally, section VII will discuss the conclusion of this paper.
A Review of the Scholarly Outward Foreign Direct Investment Literature
Outward foreign direct investment
(OFDI) is defined as ‘assets and
liabilities transferred between resident direct investors and their direct investment enterprises. It also covers transfers of assets and liabilities between resident and nonresident fellow enterprises, if the ultimate controlling
parent is resident’ (World Bank, 2015). Doing outward direct investment is a
natural move from domestic firms to
better grasp business opportunities that are available in foreign countries when further expansions in domestic markets are constrained.
To explain reasons why firms from
developing countries expand abroad, an ownership, location, and internalization (OLI) framework proposed by John Dunning will be used here. OLI framework is a framework consisting of ownership, location, and internalization advantages used to explain reasons FDIs are conducted instead of doing arm’s length business operations abroad (Dunning 1995). Ownership advantages
are defined as ‘those are specific to a particular firm and that enable it to take
advantage of investment opportunities abroad’ (Tatoglu and Glaister, 1998,p.
283). These are firm-specific advantages that could be in forms of ‘technology and
information, managerial, marketing and entrepreneurial skills, organizational systems’ (Chen 2013a, p. 47). Locational
advantages are advantages specific to
a country attracting foreign countries to invest (Tatoglu and Glaister, 1998). These are host-side advantages that could be in forms of natural resources, market size, infrastructure, and cheap labor costs (Chen, 2013a).
Next, internalization is defined as a condition where firms prefer to
attractive home markets. It is because each component of OLI framework comprehensively explains important determinants of internationalization of a multinational enterprise (MNE). With respect to the internationalization
of developing countries’ firms, location
determinants such as market size of a host country are the main things to focus when analyzing OFDI patterns of developing countries in developed markets. Buckley et al (2007) argue that location advantages of a developed country are the main attracting factors for OFDIs from developing markets. In addition to OLI framework, an International Development Path (IDP) theory proposed by John Dunning is
worth mentioning here to explain the trend of developing countries expanding overseas to developed countries. IDP approach is a theory trying to explain reasons for a country to do OFDI. According to this theory, an increase in GDP per capita (PGDP) can lead to outward investments of a country (Verma and Brennan, 2009). This theory has a direct link with the OLI framework. For example, China who is an active investor in many developed markets has shown a sharp increase in GDP per capita from US$3,414 in 2008 to US$6,188 in 2012, leading to an 81% increase over a four year period (Worldbank, 2013). There
are five development stages according
to this model, as follows (Verma and Brennan, 2009):
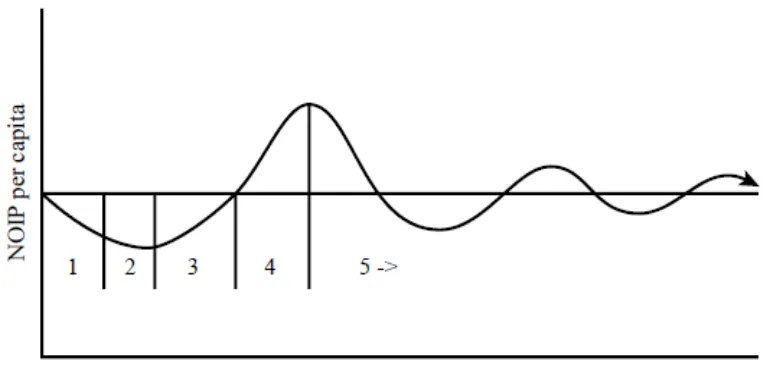
Figure 1. The IDP Model
Stage one (PGDP below US$1,000 based on 1994 prices). This is a stage experienced by the least developed countries (EDCs) facing a negative net outward investment position (NOIP)
Stage two (PGDP US$1,000-3,000). In this stage, there is still negative NOIP.
However, an insignificant OFDI starts to emerge when domestic firms generate
experience in doing international
operations from foreign firms investing
in their home countries. Next, stage three (PGDP US$3,000-10,000). In this stage, there are gradual decreases in inward FDI and gradual increases in OFDI. This condition leads to increased per capita income, industrialization acceleration, and demand for quality products.
Stage four (PGDP exceeding US$10,000). This stage is characterized by OFDI stocks equal or exceeding
those of IFDI. Finally, in stage five,
OFDIs of the most advanced countries, such as the US, Japan, and the UK tend
to fluctuate around zero showing high
levels of IFDI and OFDI; furthermore, the link between NOIP and development level stabilizes.
Data and Research Methodology
This research takes the form of a qualitative methodology, using China and India as the subject countries for the overviews of the applicability of theories discussed in this paper. Hence, relevant literature on the matter is reviewed. In applying the methodology secondary data are used for the analysis. Time series data for the Chinese and Indian OFDIs were drawn from the United Nation Conference on Trade and Development (UNCTAD), which tracks the OFDI projects from those countries between 1970 and 2014. This database
consists of the OFDI figures in the
United States (US) dollar. For the growth domestic product (GDP) per capita data collection, time series data from
the World Bank Statistics from 1960 to 2015 were used to track the yearly dollar amount of GDP per capita data for China and India and their respective growth trend. The database was in US Dollar. The UNCTAD and World Bank data were used to observe the pattern of OFDIs for the two countries, whether they follow the IDP framework or not.
Motivations for Doing Outward FDIs
There are many determinants of developing countries undertaking OFDIs in developed markets derived from FDI theories. However, the most important determinants are as follows: 1. Market-seeking motivation
Many developing countries’ firms
undertake overseas investments in order to expand their market reach despite their attractive home markets. The main explanation for this motive is that those
firms want to compensate for increased
operational costs at home markets.
Initially, those firms enjoy ownership
advantages in their home markets, such as low labor costs and natural resources endowments. However, since the economic activities in their home markets are increasing rapidly, the labor costs start
to increase, leading to lower profit margins.
For example, since 2007, the labor costs in China have doubled leading to reduced domestic market competitiveness (The international, 2013).
One way to compensate those increasing operational costs is by looking for new markets in developed markets having higher market size. Kim and Rhe
(2009) argue that firms from developing
high operational costs at home. For
example, many Chinese firms are
expanding their businesses abroad, especially to developing countries so as to sell their products (Buckley et al., 2007). Similarly, a Chinese auto parts company, Wangxiang, also did the same thing by buying some insolvent component manufacturing companies in the US so as to retain better access to leading car assembling companies in the US (Buckley et al., 2008).
Those developing countries’ MNEs invest in developed markets since those markets provide better location advantages. For example, the US is the highest recipient of OFDI from developing countries, such as China, South Korea, and India. It is because, until 2011 data, the GDP of the US is still the highest in the world, which is US$15,135,390,722,486 trillion, accounting for 22% of the world’s GDP (United Nations, 2012). The main reason why those MNEs invest in developed countries having high GDPs is that the gross domestic product (GDP) is the most common measure of market size. GDP estimates the overall economic activity in terms of all the goods and services produced during a period in a certain country (Landefeld et al., 2008). Similarly, Chen (2013b, p. 14) argues that GDP is the most representative measurement of how big the market size of a country is.
2. Strategic asset seeking motivation In this type of FDI, many developing countries invest abroad in order to get technological and advanced production expertise from the developed countries in which they are investing (Kim
and Rhe, 2009; Buckley et al., 2007; Buckley et al., 2008). It is the easiest way to gain technological advantages owned by developed countries, such as the US. The famous example of this is what Haier did in Germany. Haier is an electrical household appliances and electronic products company, based in Qingdao, China. In 1992, it was licensed technology from Germany’s Liebherr in order to improve its poor production quality (Holtbrügge and Kreppel 2010, p. 15).
It is true that home markets of developing countries are increasingly attractive. For example, Indonesia is currently experiencing an emerging middle-class boom. The number of new
middle-class and affluent consumers
(MACs) is expected to increase from 74 million in 2012 to 141 million in 2020 (BCG, 2013). Those MACs will be demanding more on quality products and services, compared to basic need products. However, since Indonesia is still experiencing issues in technological advancement, it needs to expand to developed countries in order to grasp more market opportunities and to learn technology advancement, new operation methods, and better management skills from those countries.
also want to gain technology transfers from its subsidiaries in those developed countries. Luo and Tung (in Panibratov, 2010) underpin that EMNEs conduct OFDIs so as to counter-attack their home markets from international competitors. Hence, by doing OFDIs, those EMNEs not only gain new markets abroad but also learn new and the latest technology to cater their domestic MACs’ needs and to protect their market bases from international competitions.
Entry Strategies for Outward FDIs
There are many entry strategies of OFDIs done by EMNEs to developed countries.
However, in this paper, only greenfield
investments and cross-border mergers and acquisitions will be discussed since those two entry modes are the most common strategies EMNEs conduct in doing OFDIs in developed countries.
1. Cross-border greenfield investment
Greenfield investment is defined as ‘creation of a subsidiary from scratch
by one or more non-resident investors’ (Organisation for Economic Co-operation and Development (OECD), 2004). EMNEs have done this type of FDI in many developed countries. For example, CITIC Group, a state-owned investment company of China, built a new metal facility in Australia with a total investment value of US$4,600 million (Fudan and FCC, 2008). Similarly, Hyundai Motor of South Korea built new plants in strategic locations in North America, European,
and Asia through cross-border greenfield
investments (Kim and Rhe, 2009).
Similar to China and South Korea MNEs, Indian MNEs also undertake
cross-border investments in developed countries, such as in the US and Germany. For example, between 2000 and 2007, there were 84 Indian MNEs
undertaking cross-border Greenfield
investments in Germany (Tiwari, 2009). Those investments had an FDI value of US$137.9 million and created employment for approximately 20,000 people. It is argued here that some EMNEs conduct OFDIs through this strategy so as to protect their home
country firm-specific advantages (FSAs).
Also, bigger control can be exercised
through subsidiaries by using greenfield
investments. Harzing (2002) states that
greenfield investments are conducted in
order to transfer home country FSAs to
greenfield subsidiaries.
2. Cross-border mergers and acquisitions (M&As)
Cross-border Merger and Acquisition
(M&A) is defined as ‘any transactions in assets of two firms belonging to two
different economies’ (Chen 2013c, p. 2). Cross-border mergers and acquisitions are often undertaken by EMNEs in many developed countries in order to quickly gain technological advancement and global market bases those acquired companies have. Lenovo of China, for example, acquired IBM PC Business in 2006 in order to quickly establish and get global brand name worldwide as IBM has already had worldwide international standing in the personal computer industry (Buckley et al., 2008; Holtbrügge and Kreppel, 2010). Also, by acquiring IBM, Lenovo is able to absorb
‘leading-edge technology’ possessed by
Similarly, Tata Motors of India acquired Jaguar and Land Rover (JLR), a UK based luxurious car manufacturing company, in 2008 with an acquisition deal of US$2.5 billion (Athukorala, 2009). Similar to Lenovo, this acquisition was intended to boost the global brand standing of Tata Motors in the global car industry. Indeed, Tata’s takeover of Jaguar Land Rover is a successful example of cross-border M&A, as JLR recorded new big sales in the sales of its luxurious cars from Shanghai to London. Also, JLR is
now a profit center for Tata (The New
York Times, 2012).
Based on those two examples, it is clear that Chinese and Indian MNEs undertake OFDIs in developed countries in order to gain the technological advantages those developed countries have. In other words, location determinants are indeed the important factors for OFDIs from developing countries. This phenomenon
again confirms the OLI framework of
John Dunning suggesting that location advantages in developed countries are the most sought after determinants for OFDIs from developing countries.
An Overview of FDI Outflow Patterns
of China and India
According to the 2015 World Investment Report of United Nation Conference on Trade and Development (UNCTAD), Asian developing countries, such as China, India, Malaysia, Indonesia, Thailand, and Singapore, contributed to 32 percent of the world OFDIs in 2014 (UNCTAD, 2015). For the purpose of the overview of OFDIs from developing countries, China and India are selected in this section as the examples for the overview OFDI patterns from
developing countries. Those countries are representative to discuss here since those countries are the members of BRICS countries contributing for 10 percent of world’s OFDIs in (UNCTAD, 2013).
1. China
After the release of the ‘Open Door’
policy reforms in 1978, a large number of small-scale investments by Chinese SOEs have been expanding abroad (OFDI). However, only state-owned companies under the ministry of foreign trade and economic cooperation (MOFTEC) were allowed to invest abroad. Their OFDIs are mainly in services sectors, such as international
trade, transportation, and financial
services (Buckley et al., 2008). The focus of OFDI at that time was to get physical assets and natural resources. Furthermore as a result of the launch
of China’s ‘go global’ policy in 1999, a massive number of FDI outflows
increase from China abroad. This sharp increase in OFDIs from China has continued to rise since 1970 up to 2014
(see figure 2). At this stage, Chinese firms aim at getting technological
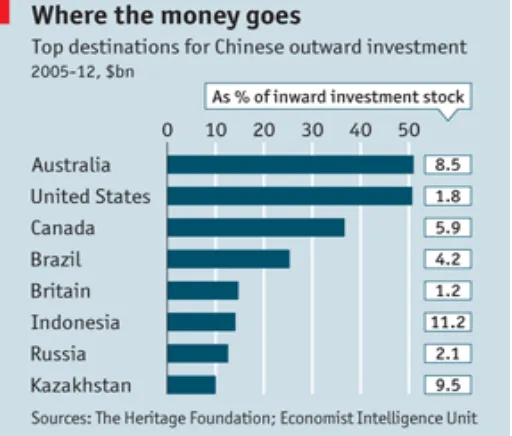
know-how from developed markets. The Economist (2013) argues that Chinese
firms are expanding abroad not only in
service sectors, but also in other sectors, such as mining, infrastructure projects, and personal computer as the following
data suggest (see figure 3). From the
Still, based on figure 3, the top three
Chinese investments were in countries having the highest GDP per capita in the world, those are Australia, the US,
and Canada. This trend confirms the
argument of the OLI framework stating that location determinants, such as market size become the major factors for EMNEs to invest in developed countries. As explained in part II of the paper, many developed markets are attractive places for EMNEs’ OFDIs as they have abundant location advantages that Chinese MNEs want to generate, such as technological advancement, market size, and managerial skills.
Nanjing Automobile, for example, acquired MG Rover in 2005 with a total investment of US$50 million, in order to gain Rover’s technological advancement (Buckley et al., 2008; The Economist, 2005). Those examples show that location advantages become
the major determinants for Chinese MNEs investing in developed countries, despite their home market attractiveness. By doing so, they can quickly upgrade their technology capabilities and get international brand recognition. Once they have gained those advantages, they can both compete domestically and internationally.
Looking at consistency with IDP theory, it is clear that China’s OFDI patterns
follow the IDP stages. As seen in figure
2, there has been a sharp increase in OFDIs from China since 2007 onwards. Since 2008, GDP per capita of China has exceeded US$3,000. The GDP per capita of China from 2008 to 2014 were US$3,414, US$3,800, US$4,515, US$5,574, US$6,265, US$6992, and US$7587, respectively (World Bank, 2016). The increase in OFDI is consistent with the increase in GDP per capita as suggested by the IDP concept.
$20,000.00 $40,000.00 $60,000.00 $80,000.00 $100,000.00 $120,000.00 $140,000.00
1970 1972 1974 1976 1978 1980 1982 1984 1986 1988 1990 1992 1994 1996 1998 2000 2002 2004 2006 2008 2010 2012 2014
FDI Outwards from China between 1970
and 2014 (in US dollars
at current prices and current exchange rates, in
millions)
China
Figure 3
2. India
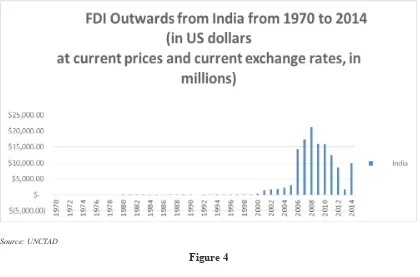
The current wave of FDI outflows from
India was heavily led by India’s efforts to liberalize and globalize its economy dating back in 1992. These actions were undertaken so as to respond to the need to accommodate the growing economy of India at that time (Khan, 2012). However, during the period of 1992-1995, overseas investment regulations were still restrictive in a way that there was no cash remittance
allowed and profit repatriation to India
was mandatory (Khan, 2012). Then after 2000, a big increase in overseas
investments from Indian firms abroad can be seen (see figure 4).
Similar to Chinese firms, Indian MNEs
are investing in developed markets for market seeking and technology acquisition motivations. For example, Reliance acquired Trevira, a German company, in 2006 in order to access
market and technology knowledge Trevira has (Holtbrügge and Kreppel, 2010). Also, Wipro Technologies acquired Infocrossing of the US in 2007, in order to gain advanced information and technology capabilities Infocrossing has and also to easily penetrate the US markets (Athukorala, 2009). Those
examples again confirm the OLI
framework saying that location factors are the main determinants for EMNEs investing in developed markets.
However, it is interesting to analyze here that the Indian OFDI does not follow the proposition of the IDP theory. It is because India’s GDP per capita was still substantially below US$3,000 until 2014, but India’s enterprises had managed to expand their investments overseas. However, India’s negative trend of
OFDIs was seen (see figure 4). The trend
steadily between 2008 and 2014, those were US$1,023, US$1,125, US$1,388, US$1,456, US$1,444, US$1,456, and US$1,577, respectively (World Bank, 2016).
It is argued that even though GDP per capita is still below $3,000, India can still expand abroad due to strong support from the government of India. Khan (2012) argues that the internationalization of
Indian firms is strongly encouraged by the
government of India by easing the credit
and non-credit loans to those firms. With
respect to the declining trend of OFDIs from India since 2008, there were two reasons attributing to it, namely declining interests over investments in developed markets and the use of third countries for investments. According to the 2013
Asia-Pacific Trade and Investment Report of
the United Nations Economic and Social
Commission for Asia and the Pacific
(UNESCAP) (2013), the value of the M&A deals of India corporations fell by over 50 percent due to the reduced focus over investments in developed countries. Similarly, still according to the report,
Indian firms preferred to channel their investments through financial centers,
namely Mauritius, Singapore, and the Netherlands (UNESCAP, 2013). Using this method of investment, their funds are channeled out of a country via Singapore, for example. The funds sent out to Singapore are then channeled back to India. This method is called “round-tripping”. This is done for the purpose
of tax advantages or other financial
measures (UNESCAP, 2013).
Source: UNCTAD
Conclusion
In conclusion, the motivations of EMNEs conducting OFDIs in developed countries are to get bigger market bases and to access advanced technological know-how from those countries, despite their home market attractiveness. Also, by gaining new global market potentials and technological expertise, those EMNEs can compensate high operational costs incurred in their home markets and counter-attack global competitors
in their home markets. Next, Greenfield
investment and cross-border M&As are the main entry strategies conducted by EMNEs when investing in developed markets. As discussed in part II, III, and V, location determinants in developed countries play a major role in attracting OFDIs from developing countries, despite attractive home markets of those developing countries.
However, there are mixed results regarding the consistency of the IDP theory in explaining the OFDIs from developing markets. While China’s OFDI patterns follow the paths of the IDP theory, it is not seen in India’s OFDI patterns. OFDIs from India experienced a sharp decrease after 2008, while India’s GDP per capita increased during the same period. This mixed result leads to the suggestion to expand the study to other developing countries to see the applicability of IDP theory in explaining OFDI patterns in developing markets.
Notes on Contributors
Diyah Ayu Amalia Avina is a well-respected and aspiring academic at
Brawijaya University, Indonesia. She has been lecturing at the Department of Communication Sciences, Brawijaya University, for almost ten years. She has been actively involved in academic research and presented her papers at national and international conferences. Apart from her academic role, she is also actively engaged in consulting activities to local governments and businesses
in Indonesia, especially in the fields of
City Branding and Behavioural Change Communication (BCC). Her educational background is B.Ec. in Human Resources Management (honors), Brawijaya University, Indonesia; Master of Science (M.Si.), the University of Indonesia, Indonesia. She has strong focus and research interests in culture, local wisdom, leadership, international business, business development, and human resources management.
Henry Kusuma Adikara is the lecturer at Tanri Abeng University. He holds the bachelor of economics degree from Brawijaya University of Indonesia and the Master of Business Administration (MBA) degree from the Australian National University (ANU). He has strong passions and focuses
on applied finance, such as corporate finance, financial modeling, investment,
References
Athukorala, P. C. (2009), ‘Outward
Foreign Direct Investment from India’, Asian Development Review, 26(2), pp. 125-153.
Bajaj, V. (2012), Tata Motors Finds Success in Jaguar Land Rover, The New York Times, Mumbai, retrieved 11 October 2016, http:// www.nytimes.com/2012/08/31/
business/global/tata-motors-finds-success-in-jaguar-land-rover. html?pagewanted=all&_r=0
Boston Consulting Group (2013),
Indonesia Offers Sizable Opportunity Because of Rising
Middle-Class and Affluent
Consumers, Boston Consulting Group, retrieved 1 October 2013, http://www.bcg.com/
of Chinese outward foreign direct investment’, Academy of International Business, 38 pp. 499-518.
Buckley, P. J., Cross, A. R., Tan, H., Xin,
L., & Voss, H. (2008), ‘Historic
and Emergent Trends in Chinese Outward Direct Investment’,
Management International Review, 48( 6), pp. 715-747.
Chen, C. (2013), ‘Introduction of Foreign
Direct Investment Theories’,
Services and Investment Policy
POGO 8015, The Australian
National University, Canberra, 26 July 2013.
Chen, C. (2013), ‘Cross-border Mergers
and Acquisitions’, Services
and Investment Policy POGO 8015, The Australian National University, Canberra, 16 August 2013.
Chen, C. (2013), ‘Location Determinants
of Foreign Direct Investment’,
Services and Investment Policy
POGO 8015, The Australian
National University, Canberra, 2 August 2013.
Coonan, C. (2013), Risinglabour costs erode China’s competitiveness, The International, retrieved in 11 October 2016, http:// www.thenational.ae/business/ industry-insights/economics/ rising-labour-costs-erode-chinas-competitiveness
Dunning, J. H. (1995), ‘Reappraising
the Eclectic Paradigm in an Age of Alliance Capitalism’, Journal of International Business Studies,
26(3), pp. 461-491.
Dunning, J. H. (1998), ‘Location and
the Multinational Enterprise: A Neglected Factor?’, Journal of International Business Studies, vol. 29(1), pp. 45-66.
Fudan & Vale Columbia Center. (2008), Chinese Multinationals Make Steady Progress, Fudan & Vale Columbia Center, retrieved 20 September 2013, http://www.vcc.columbia.
edu/files/vale/documents/
RankingofChineseMultinationals-Final_2008.pdf
Harzing, A. W. (2002), ‘Acquisitions versus Greenfield Investments:
International Strategy and Management of Entry Modes’,
Strategic Management Journal,
Holtbrügge, D. & Kreppel, H. (2010),
‘Determinants of outward foreign
direct investment from BRIC countries: an explorative study’,
International Journal of Emerging Markets, 7(1), pp. 4-30.
International Monetary Fund (IMF). (2004), Mergers and Acquisitions
(M&As), Greenfield Investments
and Extension of Capacity, Organisation for Economic Co-operation and Development (OECD), retrieved 4 November 2015, https://www.imf.org/ External/NP/sta/bop/pdf/
diteg42829.pdf
Khan, S. H. R. (2012), Outward Indian FDI – Recent Trends & Emerging Issues, Mumbai, Retrieved 20 September 2013 http://rbi.org. in/scripts/BS_SpeechesView. aspx?Id=674
Kim, J. M. & Rhe, D. K. (2009), ‘Trends
and Determinants of South Korean Outward Foreign Direct Investment’, The Copenhagen Journal of Asian Studies, 1, pp. 126-154.
Landefeld, J. S., Seskin, E. P., &
Fraumeni, B. M. (2008), ‘Taking
the Pulse of the Economy: Measuring GDP’, Journal of Economic Perspectives, 22(2) pp. 193-216.
Panibratov, A. (2010), ‘Russian
multinationals: entry strategies and post-entry operations’, Pan-European Institute, pp. 1-67.
Tatoglu, E. & G, K. W. (1998),
‘Determinants of Foreign
Direct Investment in Turkey’,
Thunderbird International Business Review, 40(3), pp.
279-314.
The Economist. (2013), China’s overseas investment: ODI-lay-hee-ho, The Economist, Beijing, retrieved 10 August 2013, http:// www.economist.com/news/ china/21569775-expanding-scale- and-scope-chinas-outward-direct-investment-odi-lay-hee-ho
The Economist. (2005), MG Rover: Rover’s return, The Economist, retrieved 11 October 2016, http://www.economist.com/
node/4227922
The United Nation Conference on Trade and Development (UNCTAD). (2016), World Investment Report 2015, UNCTAD, retrieved 8 October 2016, http://unctad.org/
en/pages/PublicationWebflyer.
aspx?publicationid=588
The United Nation Conference on Trade and Development (UNCTAD), (2016), World FDI Outwards from 1970 to 2014, UNCTAD, retrieved 8 October 2016, http://unctadstat. unctad.org/TableViewer/
tableView.aspx
The United Nations Economic and Social Commission for Asia
and the Pacific (UNESCAP),
(2016), Asia-Pacific Trade
and Investment Report 2013, retrieved 11 October 2016, http:// www.unescap.org/sites/default/
files/Foreign%20Direct%20 Investment%20Trends%20
and%20Developments.PDF
The World Bank, (2015), What is the difference between Foreign Direct
Investment (FDI) net inflows and net outflows?, The World Bank, retrieved 4 November 2015,https:// datahelpdesk.worldbank.org/ knowledgebase/articles/114954- what-is-the-difference-between-foreign-direct-inve
Tiwari, R., (2009), Indian Investments in Germany: Motives, Status-quo and trends, Global Innovation, retrieved 15 September 2013, http://www.global- innovation. net/team/tiwari/PDF/Indian_ Investments_in_Germany.pdf
Verma, R. & Brennan, L., (2011), ‘The
investment development path theory: evidence from India’,