Application of 3D Resistivity Method for Distribution of Seawater
Intrusion in The Tanah Mas Residential North Semarang
Andya Satya Purnomo Putro1)*, Supriyadi1, Khumaedi1
1) Department of Physics, Faculty of Mathematics and Natural Science, Semarang State University, Semarang, Indonesia
Accepted 04 October 2016, Revised 25 October 2016
ABSTRACT
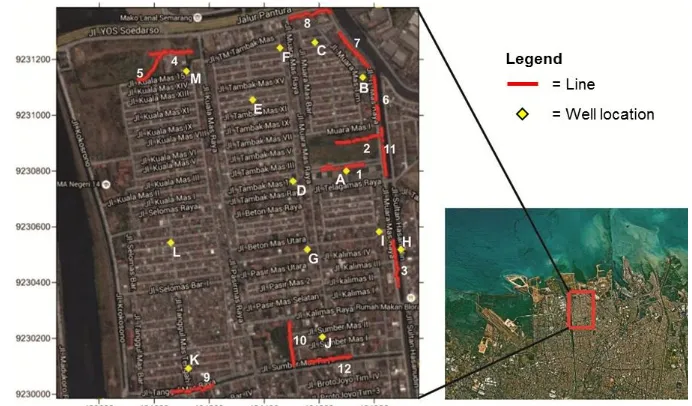
The seawater intrusion into the groundwater in Tanah Mas Residential North Semarang was investigated by chlorides ion levels from production wells and 3D electrical resistivity profiling. Tanah Mas residential area is a densely populated area located in the northern coastal city of Semarang. At the area, the exploitation of groundwater through production wells is quite high, that potential to produce the phenomenon of seawater intrusion. Analysis of groundwater samples from production wells was carried out as an early indication of the seawater intrusion in the study area. The profiles acquired across the study area, using a multi-electrodes acquisition system in a Wenner array configuration by electrode spacing of 10 m were used for the profiling. The results of groundwater chemical testing, there are three groundwater samples that has high levels of chloride ions. Three groundwater samples have the high levels of chloride ions that are in wells F, J and M. Apparent resistivity data of the 2D profiles over the models were collated to 3D data sets for each array studied. From 3D electrical resistivity profiling, obtained the distribution of seawater intrusion that has reached the north, east and south of Tanah Mas residential.
Keywords: 3D resistivity; seawater intrusion; Wenner array; resistivity; groundwater; Tanah Mas; Semarang
INTRODUCTION
Groundwater is a renewable natural resource that has important role towards living [1]. A number of factors can effect the quality of a groundwater reservoir, such as contamination by seawater intrusion or by toxic industrial chemical waste [2]. The increase of population, the extensive water use, the interbasin water transfer, and the climate change effect have and will impact the groundwater level change [3, 4]. It has been showed that groundwater over exploitation leads to seawater intrusion in coastal area [3, 5]. Seawater intrusion is a global issue, exacerbated by increasing demands for freshwater in coastal zones and predisposed to the influences of rising sea levels and changing climates [6]. Seawater intrusion is commonly associated to aquifers located in coastal regions of the world
and responsible for freshwater resource depletion and availability. Tanah Mas residential area is a densely populated area located in the northern coastal city of Semarang. At the area, the exploitation of groundwater through production wells is quite high, that potential to produce the phenomenon of seawater intrusion. The seawater intrusion in the coastal aquifers has thoroughly been studied using observation wells and water sample analysis [7]. To indicate the seawater intrusion in the study area, analysis of chlorides ion levels from production wells is performed. Geoelectrical resistivity imaging has played an important role in addressing a wide variety of hydrogeological, environmental and geotechnical issues [8-10]. The goal of geoelectrical resistivity surveys is to determine the distribution of subsurface resistivity by taking measurements of the potential difference on the ground surface. The resistivity surveys were carried out to provide accurate interpretation on distribution of seawater intrusion in Tanah Mas residential.
--- *Corresponding author:
METHODS
Chemical Analysis of Groundwater Samples. Chemical analysis of groundwater samples from production wells performed to indicate the seawater intrusion in the study area. The primary detrimental effects of seawater intrusion are reduction in the available freshwater storage volume and contamination of production wells, whereby less than 1% of seawater (~250 mg/l chloride) renders freshwater unfit for drinking [6]. Groundwater samples were tested in laboratory using the Argentometry analysis method SNI 6989.19: 2009 to determine the chlorides ions level.
Resistivity Acquisition. The purpose of geoelectrical resistivity surveys is to determine the subsurface resistivity distribution by making measurements on the earth surface. The ground resistivity is related to various geological parameters such as the mineral and fluid content, porosity and degree of water saturation in the rock. Resistivity measurements were conducted during November and October 2015. The 10 geoelectrical sections were obtained up to penetration depth of about 27m and for a total length of 150m. The main equipment is primarily used is Resistivity Multichannel S-Field with Wenner array configuration. The data were processed using two softwares, RES2DINV for 2D profiling and Rockwork for 3D profiling.
Figure 1. (Location map of the investigated area showing the resistivity measurements and well location)
RESULTS AND DISCUSSION
Chemical Analysis Results. Chemical testing of groundwater samples was carried out as an early indication of the intrusion of sea water in the research area. The parameters measured were the levels of chloride ions contained in the groundwater samples. Groundwater samples were taken from 13 points wells that used by the people in the area. The water samples were then tested using the argentometry analysis method SNI 6989.19: 2009 to determine of chloride ions level. The test results of chloride ions level in groundwater samples are presented in Table 1.
Table 1. Testing results of chloride ion levels from groundwater samples
Sample Coordinate (UTM)
Chlorides ion level (mg/l)
A 434696, 9230800 123
B 434755, 9231133 191
C 434582, 9231258 92
D 434503, 9230761 216
E 434358, 9231053 245
F 434455, 9231239 2489
G 434554, 9230518 118
H 434894, 9230518 130
I 434815, 9230580 76
J 434610, 9230204 869
K 434124, 9230093 68
L 434062, 9230541 121
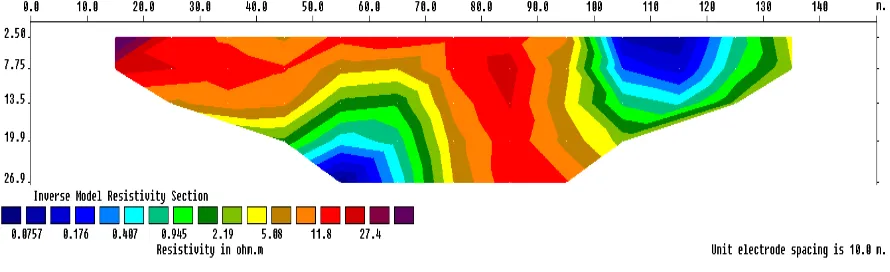
Figure 2. (The 2D subsurface resistivity profiling of line 1)
From the results shown in table 1, there are three groundwater samples that has high levels of chloride ions. three groundwater samples had high levels of chloride ions that are in s F, J and M. High levels of chlorides ion means the samples have chlorides ion levels more than 250 mg/l in groundwater. The high levels of chloride can be used as an indication that there has been a seawater intrusion in the area. Referring to the research that conducted by Werner et al (2013) that the primary detrimental effects of seawater intrusion are reduction in the available freshwater storage volume and contamination of production wells, whereby less than 1% of seawater (~250 mg/l chloride) renders freshwater unfit for drinking [6].
Result of Resistivity Acquisition. Resistivity measurement has been conducted to determine the distribution of seawater intrusion in Tanah Mas residential. The profiles acquired across the study area using a multi-electrodes survey with a 3D model of interpretation, where the resistivity values are allowed to vary in all the three directions, namely vertical, lateral and perpendicular directions, should in theory give a more accurate and reliable results [8]. Apparent resistivity data of the 2D profiles over the models were collated to 3D data sets for each array studied. In 2D resistivity surveys, subsurface resistivity is usually assumed to vary vertically with depth and laterally along the profile, but constant in the direction perpendicular to the profile [11]. One of 2D
profiles obtained through measurement in line 1 shown in Figure 2.
Based from Figure 2, which represents the 2D subsurface resistivity profiling acquired at the east of Tanah Mas residential area at line 1. The resistivity values that ranges from 0.0757
Ωm to 27.4 Ωm. At depth of approximately 19.9 m to 26.9 m is identified as a seawater intrusion because it has small resistivity range between
Ωm. Based on the geological map, Tanah Mas Residential areas that including the coastal plain which generally consists of clay and sand.
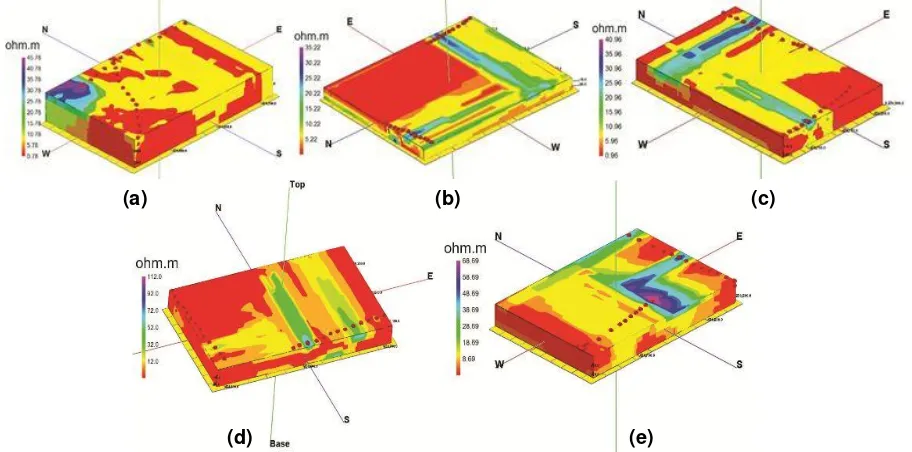
Five profiles of perpendicular 2D resistivity using Wenner array configuration, were then collected to 3D data sets of each array studied. 3D geoelectrical resistivity profiling which allows resistivity variation in all possible directions should give more accurate and reliable inverse models of the subsurface resistivity. 3D visualization resistivity model showing the distribution of resistivity. Distribution of seawater intrusion in the 3D profils are shown in red. Seawater intrusion has small resistivity range between 0.0179 Ωm to 0.407 Ωm, for other resistivity value is thought to be a layer of clay and sand that has a range of 1 Ωm to 100 Ωm resistivity to clay and sand 1
north, east and south parts of Tanah Mas residential. Seawater intrusion in the study area is predicted resulting from the sea-level
fluctuations of Java Sea and by prolonged changes in coastal groundwater levels due to pumping.
Figure 3. 3D resistivity profiling from 2D resistivity profiling of line 4 and 5 (a), 7 and 8 (b), 2 and 6 (c), 10 and 12 (d), 1 and 11(e).
CONCLUSION
Phenomenon of seawater intrusion has occurred in Tanah Mas residential north of Semarang that studied using chemical testing and resistivity method. From the results of chemical testing, there are three groundwater samples that has high levels of chloride ions. Three groundwater samples had high levels of chloride ions that are in wells F, J and M. High levels of chlorides ion means the samples have chlorides ion levels more than 250 mg/l in groundwater. Seawater intrusion has small resistivity range between 0.0179 Ωm to 0.407
Ωm, for other resistivity value is thought to be a layer of clay and sand that has a range of 1 Ωm to 100 Ωm resistivity to clay and sand 1 Ωm to 1000 Ωm. The study shows that 3D geoelectrical resistivity profiling can be achieved by collating orthogonal sets of 2D profiles. Distribution of seawater intrusion has reached north, east and south parts of Tanah Mas residential. Seawater intrusion in the study area is predicted resulting from the sea-level fluctuations of Java Sea and by prolonged changes in coastal groundwater levels due to pumping.
REFERENCES
[1] Supriyadi, A. Yulianto, A. Haryanto, (2011), Research of Model Scale Seawater Intrusion using Geoelectric Method. IPTEK, The Journal for Technology and Science, 22(3):129-134.
[2] Islami, N., (2011). Geoelectrical resistivity method for salt/brackish water mapping. Journal of Coastal Development, 14(1): 104-114.
[3] Rahmawati, N., J. F. Vuillaume, I. L. S. Purnama, (2013). Salt intrusion in Coastal and Lowland areas of Semarang City. Journal of Hydrology, 494(2013): 146-159.
[4] Tillman, F. D., S. A. Leake (2010). Trends in groundwater levels in wells in the active management areas of Arizona, USA. Hydrogeol. J, 18, 1515-1525.
[5] Pousa, J., Tosi, L., Kruse, E., Guaraglia, D., Bonardi, M., Mazzoldi, A., Rizzetto, F., Schnack, E., (2007). Coastal processes and environmental hazards: the Buenos Aires (Argentina) and Venetian (Italy) littorals. Environmental Geology, 51(8): 1307-1316.
(a) (b) (c)
[6] Werner, A. D., M. Bakker, V. E. A. Post, A. Vandenbohede, C. Lu, B. A. Asthiani, C. T. Simmons, D. A. Barry, (2013). Seawater intrusion processes, investigation and management: Recent advances and future challenges. Advances in Water Resources, 51(2013): 3-26. [7] Ravindran A. A., Ramanujam, N., dan
Sudarsan, R., (2013). Delineation of saltwater and freshwater interphase in beach groundwater study using 2D ERI technique in the Northern sector of the Gulf of Mannar Coast, Tamilnadu. Water,
5(2013): 1 - 11.
[8] Aizebeokhai, A. P. dan Olayinka, A. I., (2010). Application of 2D and 3D geoelectrical resistivity imaging for engineering site investigation in a crystalline basement terrain, southwestern Nigeria. Environment Earth Science, 61, 7. [9] Aizebeokhai, A. P. dan Olayinka, A. I., (2010). Anomaly effects of arrays for 3d
geoelectrical resistivity imaging using orthogonal or parallel 2D profiles. African Journal of Environmental Science and Technology,4(7):446-454.
[10] Aizebeokhai, A. P., Olayinka, A. I., Singh, V. S., dan Uhuegbu, C. C., (2011). Effectiveness of 3D geoelectrical resistivity imaging using parallel 2D profiles. International Journal of Physical Sciences, 6(24):5623-5647.
[11] Aizebeokhai, A. P., Olayinka, A. I., Singh, V. S., dan Uhuegbu, C. C., (2011). Effectiveness of 3D geoelectrical resistivity imaging using parallel 2D profiles. Current Science, 101(8 ):1036-1052.