Journal of Insect Physiology 47 (2001) 173–184
www.elsevier.com/locate/jinsphys
Diapause in the gypsy moth: a model of inhibition and
development
David R. Gray
1,a,*, F. William Ravlin
b, Jodi A. Braine
caNatural Resources Canada, Canadian Forest Service, Laurentian Forestry Centre, 1055 du P.E.P.S., P.O. Box 3800, Sainte-Foy, Que´bec,
G1V 4C7 Canada
bOhio Agricultural Research and Development Center, The Ohio State University, Wooster, OH 44691-4096, USA cGWN Consulting, Fredericton, New Brunswick, Canada
Received 4 January 2000; accepted 6 June 2000
Abstract
We present here the first recorded age-specific estimates of the developmental response to temperature in diapausing gypsy moth, Lymantria dispar(L.). The effect of temperature on diapause development in gypsy moth eggs was examined by exposing individual eggs to temperature regimes of 5°C interrupted by a single, brief exposure to an experimental temperature. Exposure to each of six experimental temperatures took place at six different times during diapause. The relative effect of the exposure on diapause development was estimated by comparing the duration of diapause in each of the treatments to the duration in a control treatment of constant 5°C. The effect of each temperature did not remain constant throughout the diapause phase and the pattern of change was not uniform among the experimental temperatures. We propose a model of diapause where the developmental phase is controlled by two simultaneous temperature-dependent processes: a typical developmental response to temperature that is inhibited by a tem-perature-activated biochemical agent, and the temperature-dependent removal of the inhibiting agent. This simple model of two simultaneous and temperature-dependent processes explains 92% of the variability in diapause duration observed in the experimental regimes.2000 Elsevier Science Ltd. All rights reserved.
Keywords: Lymantria dispar; Diapause; Developmental response; Phenology
1. Introduction
Models of insect development in response to tempera-ture typically assume that the developmental response to a given temperature remains constant throughout a developmental stage. Thus, ifddays atx°C are required
to complete the stage, each 24 h exposure to x°C
advances development 1/dregardless of when during the
stage the exposure occurs. The relationship between x
and 1/dis used to sum the developmental responses over time and completion of the stage occurs when the sum equals unity. However, if the developmental response is not consistent over time such a model will not accurately
* Corresponding author. Tel.:+1-506-452-3462; fax:+ 1-506-452-3525.
E-mail address:[email protected] (D.R. Gray).
1 Present address: Natural Resources Canada, Canadian Forest
Ser-vice, Atlantic Forestry Centre, P.O. Box 4000, Fredericton, NB E3B 5P7 Canada
0022-1910/00/$ - see front matter2000 Elsevier Science Ltd. All rights reserved. PII: S 0 0 2 2 - 1 9 1 0 ( 0 0 ) 0 0 1 0 3 - 7
predict completion of the stage. Such a model is cer-tainly inadequate to describe development of stages that include a hibernal diapause, such as gypsy moth (Lymantria dispar L.) eggs, because of the complex changes that occur during the stage in the relationship
between temperature and developmental response
(Masaki, 1956).
tempera-tures and will hatch within 11–18 d at 25°C or 14–25 d at 15°C (Gray et al., 1995). Thus, the egg stage is com-prised of three distinct phases which differ in develop-mental response to temperature. Distinguishing the com-pletion of the phases has been problematic and as a result, so also has been deriving an estimate of the relationship between temperature and developmental response within each phase. Consequently, most models of gypsy moth egg phenology and hatch have ignored the prediapause and diapause phases when simulating egg development and hatch. The models of Johnson et al. (1983), Waggoner (1984), Lyons and Lysyk (1989) and Hunter (1993) all must assume that diapause is com-pleted by an arbitrary calendar date. The model of Saw-yer et al. (1993) ignores the prediapause phase and assumes that diapause is initiated on an arbitrary calen-dar date.
Descriptions of the relationship between temperature and developmental response in the diapause phase have remained qualitative mainly because measurements of diapause completion have been “inseparably linked to hatching” (Giese and Casagrande, 1981). But this relationship and the resulting time of diapause com-pletion may be the single most important factor in pre-dicting the date of eventual gypsy moth egg hatch across large and divergent landscapes or across years.
Sawyer et al. (1993) produced the only published model of gypsy moth egg phenology that included the diapause phase. Their model has no clear demarcation between diapause and postdiapause. Instead, there is a gradual transition through 200 arbitrary age classes in the developmental response function from low threshold and optimum temperatures to higher threshold and opti-mum temperatures. They used published data from egg hatch vs. temperature experiments to estimate parameter values because experiments to estimate age-specific developmental responses to temperature had never been conducted (Sawyer et al., 1993).
Gray et al. (1991) developed a method of measuring respiration rates in individual gypsy moth eggs that can be used to estimate phase transition. An abrupt decrease in respiration rates under constant temperature con-ditions was observed and used to indicate the transition from prediapause to diapause. They consequently pro-posed a three-phase sequential model of gypsy moth egg development. Gray et al. (1995) interpreted a similarly abrupt increase in respiration rates as the transition from diapause to postdiapause. They also used a variation of the experimental protocol suggested by Sawyer et al. (1993) to make the first known estimates of age-specific developmental response to temperature and derived a model of age-dependent developmental rates in post-diapause. We report here on the first age-specific esti-mates of the effect of temperature on diapause develop-ment in the gypsy moth and propose a dual process
model of diapause development that explains the observed temporal changes in the effect.
2. Materials and methods
2.1. Gypsy moth eggs
One hundred gypsy moth egg masses of the New Jer-sey Standard Strain were obtained from a colony main-tained by the US Forest Service, Northeastern Forest Experiment Station (Hamden, CT). Egg masses were reared for approx. 5 days at 25°C and a 16:8 (L:D) pho-toperiod, packed in a styrofoam cooler with an ice pack and shipped by “overnight express”. Upon receipt, eggs were immediately placed in an environmental chamber at 25°C, and a 16:8 (L:D) photoperiod. In order to deter-mine when eggs had entered diapause, respiration rates from a random sample of 12 eggs from each of 10 egg masses were measured (Gray et al., 1995) every second day, beginning 15 days after oviposition. Diapause entry was confirmed by a respiration rate of less than 1.0 µl CO2/24 h (Gray et al., 1991 [where it should be noted
that respiration rates were incorrectly reported as 1 4 of
actual]). Diapause entry (day 0 of our experiment) was confirmed in 100% of sample eggs 27 days after ovi-position and egg masses were assigned to experimental treatments as described below.
2.2. Experimental treatments
Upon diapause initiation, two egg masses were ran-domly assigned to each of 36 rearing regimes. Each regime was composed of a short exposure to an
experi-mental temperature, and a majority of time at 5°C.
Exposure to the experimental temperature occurred at one of six times during the diapause phase and lasted from 2 to 15 days (Table 1). Exposure was shortest in those treatments where we expected developmental
Table 1
Duration of exposure (days) to experimental temperature (tT) in each combination of experimental temperature (T) and time of exposure (t15). Eggs were reared at constant 5°C before and after exposure to
the experimental temperature
Time of exposure (to experimental temperature)
D.R. Gray et al. / Journal of Insect Physiology 47 (2001) 173–184
response to be greatest. Four additional egg masses were randomly assigned to a constant 5°C treatment. All treat-ments were subjected to 12 h:12 h (L:D).
At approximately one-week intervals, six eggs were randomly selected from each of the two egg masses in each of the 36 treatments (Table 1). Twelve eggs were randomly selected from each of the four egg masses in the constant 5°C treatment. Eggs were gently dehaired, placed in individual 1 ml glass autosampler vials (Fisher Scientific, Pittsburgh, PA, 03-340-5A), and placed at 25°C. Vials were sealed with a rubber septum (Fisher 03-340-13A) for 24 h and respiration rates were determ-ined as per Gray et al. (1995). Diapause was considered terminated in the sampled eggs that exhibited respiration rates $1.5µl CO2/24 h (Gray et al., 1995). Thus, each
treatment consisted of (in temporal order) exposure to 5°C for 0–75 days, exposure to an experimental tempera-ture for 2–15 days, and sufficient exposure to 5°C to allow diapause completion with the 24 h exposure to 25°C that occurred during the process of respiration rate measurement.
A cumulative logistic function was fit to the pro-portion of sampled eggs that completed diapause in each
sample over time. The median time (days at 5°C)
required to complete diapause after exposure to the
experimental temperature was estimated from the para-meters of the logistic function.
2.3. Diapause impact
For simplicity we introduce the term diapause impact and define it as the composite effect on the diapause process of a unit time exposure to a given temperature. The diapause impact (DI) of each temperature (T) at each of the six exposure times (t) was estimated as
DIT,t5
S
12t15+t25
tmed5
DY
tT (1)
where t15andt25 are, respectively, the durations at 5°C
before and after exposure to the experimental tempera-ture, tT is the duration at the experimental temperature
T, andtmed5is the median developmental time of the eggs
that spent the entire time at 5°C. DIT,t is calculated in the identical manner as the “instantaneous developmen-tal rate (RT(t))” of Gray et al. (1995). However, unlike an instantaneous developmental rate, a diapause impact is not independent of the temperature conditions
sub-sequent to exposure to T. As will be seen below, the
impact of a low temperature (e.g. 25°C) early in the diapause phase is partly manifested through exposure to higher temperatures later in diapause. In the estimation of DIT,t, the variable tT was kept as short as possible because as tT becomes smaller, t15+t25 becomes larger,
and the total response resulting from an exposure to tem-peratureTthat occurred at timetis more accurately esti-mated by 12(t15+t25)/tmed5, regardless of the relationship
between DIT,t andt. In addition we calculated the aver-age daily diapause impact of our control temperature (5°C) as
DI551/tmed5 (2)
2.4. Model building
The pattern of diapause impact vs. time at the six tem-peratures and particularly the pattern of diapause impact vs. temperature at day 30 and 50 (see Results) suggested the interaction of two independent, temperature-depen-dent processes during the diapause phase. The interac-tion of these two processes described below produces the complicated, and unusual, pattern of diapause impacts estimated from our experiment.
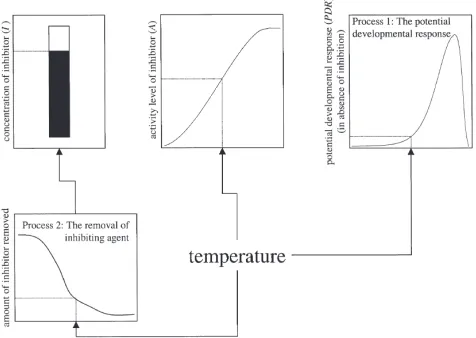
One process in our model governs a potential develop-mental response. In the typical developdevelop-mental rate mode-ling algorithm, the summation to unity of this response signals the completion of the phase. However, through-out the diapause phase the realization of a potential developmental response is inhibited in our model by the presence of an inhibiting agent. The inhibiting agent is temperature activated such that the activity level of the inhibitor is minimal at low temperatures and increases monotonically to a maximum (1) at high temperatures. The strength of inhibition at any given time at any given temperature is a product of the concentration of inhibitor and the activity level of the inhibitor. The second process of our model governs the depletion of this inhibitor. Both processes are entirely mediated by temperature (Fig. 1).
The rate of depletion of the inhibitor is governed by
two temperature-dependent functions RS(T) and RP(T)
which produce a monotonically increasing rate of depletion at a constant temperature:
d
dtI(T)5max{2I,[I2I02RS(T)]3lnRP(T)}, (3)
where I is the concentration of inhibitor and I0 ($1.0)
is the initial concentration of inhibitor. Setting the initial concentration at or above 1.0 in Eq. (3) simulates an obligatory minimum exposure to low temperatures to reduce a fully temperature-activated inhibitor below a
minimum threshold where actual developmental
response can be above zero. The max{ } operator limits the depletion rate to non-negative values. Complete depletion of this inhibitor is not necessary for the com-pletion of the diapause phase, but as the concentration of inhibitor is reduced, the potential developmental response to any given temperature is more fully realized. Finally, the actual developmental response (ADR) to a temperatureTat timetis a function of the concentration of inhibitor (I) present at t, the activity level of the inhibitor (A) at T, and the potential developmental response (PDR) atT:
ADR(T,t)5max{0,[12I(t)3A(T)]PDR(T)}. (4)
The max{ } operator ensures that ADR is non-negative
in the cases where I(t)×A(T).1. In our algorithm it is
the summation to unity of ADR that signals the
com-pletion of the diapause phase.
Thus, the diapause impact of an exposure to a given temperature may be large because of a high potential developmental response when the inhibitor has already been significantly reduced, or because the exposure sig-nificantly reduces the inhibitor concentration and thereby
facilitates a higher ADR when temperatures later
increase.
2.5. Parameter estimation
Parameter estimation was done on the basis of a mini-mum weighted sum of squared differences betweenDIT,t (Eq. (1)) estimated using our experimental observation (hereafter called observedDIT,t) andDIT,testimated from our model predictions of diapause completion (hereafter called predicted DIT,t), plus a weighted sum of squared
differences between observed and predicted DI5 (Eq.
(2)). Jennrich and Moore (1975) showed that a maximum likelihood solution can be obtained by weight-ing each squared difference between observed and pre-dicted DIT,t(or DI5) by the inverse of predictedDIT,t(or
DI5) and choosing the parameter set that minimizes the
sum of the weighted differences. We additionally weighted each squared difference between observed and predicted DIT,t by tT, and each squared difference
between observed and predicted DI5 by
tmed5+ S treatment
(t15+t25). This additional weighting was
necessary because each treatment included an exposure to 5°C. Without this weighting an underestimation of
DIT,tcould be compensated by an overestimation of DI5
There was no a priori knowledge of appropriate func-tional (mathematical) forms to describe the relationships between temperature and the activity level of inhibitor (A), the potential developmental response (PDR), orRS
andRPwhich describe the rate of depletion of inhibitor (dI/dt). In addition, there are obvious cross-correlations between the relationships. For these reasons it was not feasible to use standard non-linear least squares regression techniques to estimate parameter values for these developmental functions that would minimize our weighted sum of squared differences. Instead we con-ducted an intensive search of a partially restricted vari-able space to estimate temperature-specificvalues ofA,
PDR,RS andRP at each of our experimental
tempera-tures and the control temperature. We treatedAas a rela-tive factor (0#A#1) and assumed thatAwould increase monotonically with increasing temperatures. Therefore, the partial restriction to our variable space was that
A25#A0#· · ·A25. All other variables were unrestricted.
We evaluated approx. 2×10⁹ combinations of
tempera-ture-specific values on the basis of our sum of weighted squared differences. Following estimation of the tem-perature-specific parameter values, functional forms were selected to approximate the relationship between temperature and each variable.
The temperature-specific values of PDR displayed a
typical temperature-dependent response wherePDRwas
low and relatively unchanging at lower temperatures and increased rapidly at higher temperatures. Our maximum temperature was not sufficiently high to determine the
optimum temperature, nor to observe a decline in PDR
that would likely occur at higher temperatures. Therefore we used an exponential function of a polynomial to model the relationship:
PDR(T)5exp(c1pdrT3T1pdrT23T21pdrT43T4), (5) wherec,pdrT,pdrT2andpdrT4are estimated parameters.
Our temperature-specific values of A displayed a
mildly sigmoidal pattern with increasing temperatures. Because of its nature (0#A#1), the relationship between inhibitor activity (A) and temperature was well suited to the function of Stinner et al. (1974):
A(T)5b1(12b)3(12Z)A1×ZA2, (6)
where Z=(Tmax2T)/(Tmax2Tmin),Tmax=25°C, Tmin=
25°C. Parameter b, the minimum value of A (at
T=Tmin), was fixed (b=0.3). Estimated parametersA1and
A2 control the slope and symmetry of the relationship.
Temperature-specific values ofRPdeclined
D.R. Gray et al. / Journal of Insect Physiology 47 (2001) 173–184
RP(T)51.01rpc3exp(Z)6, (7) where Z is as described above and rpc is an estimated parameter.
Temperature-specific values of RS were found to be
highly correlated with those of RP. The relationship
between RS and RPwas described by:
RS(T)5c1rsrp3RP(T), (8) where rsrp is an estimated parameter.
Initial parameter estimates for Eq. (5) to Eq. (7) were obtained by non-linear regression analysis (PROC NLIN, SAS Institute, 1988). Parameter values for Eq. (8) were obtained by linear regression analysis. We then
searched a parameter space defined by ±10% of each
initial parameter value in eight equal increments (4.3×10⁷ combinations) to locate the combination of
parameter values that minimized our weighted sum of squared differences. When the search selected a value equal to the limit of the search space, the starting value for the parameter was adjusted and the search repeated.
The parameter space was ultimately reduced to±2% of
each starting parameter value and searched in 8 equal increments.
A temperature- and time-independent description of variability of the population in response to temperature was derived in the following manner. A relative time scale for each treatment was defined as elapsed time (days) from the completion of exposure to the experi-mental temperature divided by t25 from the treatment
(Eq. (1)). A cumulative probability distribution, F(x), of diapause completion as a function of the inverse of the relative time scale (x) was calculated and a Weibull function (Law and Kelton, 1982),
F(x)512exp[2(x2g)/b]a (9)
was fit to the distribution by non-linear regression
analy-sis (PROC NLIN, SAS Institute, 1988). Parameter g
defines the distribution’s midpoint,bdescribes its spread
and aits symmetry.
3. Results
The median time to complete diapause after exposure to the experimental temperature ranged from 29.6 to 126.2 d (Table 2). Eggs that were exposed to constant 5°C completed diapause in a median time of 127.7 d.
3.1. Diapause impact
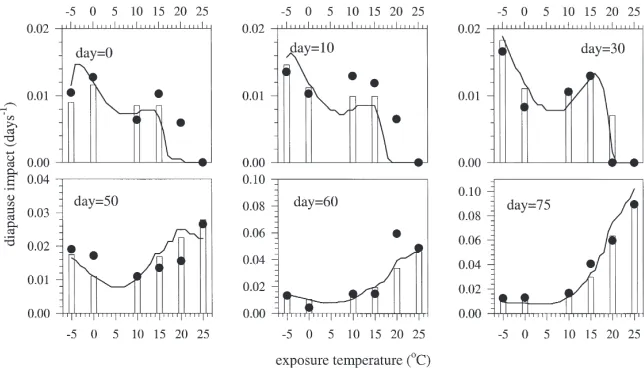
Observed diapause impacts varied with time of exposure in patterns that were unique to each tempera-ture (Fig. 2). The smallest diapause impact (DIT,t=0.0 d21) occurred with an exposure to 25°C immediately
upon diapause initiation; the largest (DIT,t=0.0904 d21)
occurred with an exposure to 25°C after 75 d at 5°C. The diapause impact of25°C displayed a unimodal pat-tern over time with an approx. 100% increase in magni-tude by day 50 of diapause and a return to near-initial levels by day 75. In contrast, the diapause impact of high temperatures (15 to 25°C) was initially very low and showed sharp increases later in the diapause phase. This increase in diapause impact was most pronounced at 25°C, but occurred earlier at 20 and 25 than at 15°C. Diapause impacts of 10°C showed a more uniform, mon-otonic increase over time, while the diapause impact of 0°C showed no clear pattern over time.
These differences in the temporal pattern of diapause impact result in the unusual condition where an increase in diapause impact can occur by either an increase or a decrease from a given temperature (Fig. 3). This can be seen in the relationship between diapause impact and temperature on day 30 (for example) where a local
mini-mum exists in diapause impact at 0°C and either an
increase or a decrease in temperature will result in a greater diapause impact. By day 50 the diapause impact was higher for all temperatures and either an increase or a decrease from 10°C will result in a greater diapause impact. By day 75 the effect of25°C had declined while the effect of high temperatures (20–25°C) had increased dramatically (Fig. 2), and the relationship between diapause impact and temperature had assumed a shape commonly seen in insect thermal responses through a majority of the temperature range (Logan, 1988). The differences among our experimental temperatures in the relationship between diapause impact and time (Fig. 2), and the temporal changes in the relationship between diapause impact and temperature (Fig. 3) prompt us to propose the diapause model described above.
3.2. Temperature-specific parameter values and model predictions
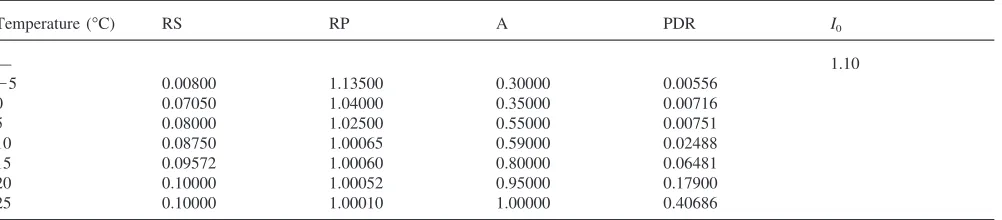
The best temperature-specific values of PDR (the
potential developmental response in diapause), A (the
relative activity of the inhibitor) and RS and RP (the parameters governing the depletion of the inhibitor) are
given in Table 3. Parameter RS can be thought of as a
relative measure of how quickly an exposure to tempera-ture T will begin to cause a depletion in the inhibitor.
RSis smaller (faster start of inhibitor depletion) at lower temperatures and approaches its maximum (slowest start of inhibitor depletion) above approx. 10°C. Parameter
RP can be thought of as a relative measure of the rate of depletion caused by temperature T.
Table 2
Estimated median time (days at 5°C) required to complete diapause (t25) with a 24 h exposure to 25°C after exposure to experimental temperatures
described in Table 1. Diapause impacts are calculated asDIT,t=[12(t15+t25)/tmed5]/tT, wheret15andtTare given in Table 1, andtmed5=127.7 d
Transfer day (into experimental temperature)
Temperature (°C) 0 10 30 50 60 75
25 109.5 98.0 77.7 53.2 50.6 37.2
0 103.0 102.6 89.1 55.6 62.0 36.1
10 115.0 100.0 84.0 63.5 53.2 36.0
15 107.7 102.3 81.8 63.8 54.5 31.6
20 115.9 111.9 100.7 65.6 37.1 37.3
25 126.2 125.7 106.8 57.2 42.6 29.6
Fig. 2. The relationship between diapause impact of temperatureTand the first day of exposure toTfor six temperatures. Diapause impact ( DIT,t=[12(t15+t25)/tmed5]/tT) is defined as the composite effect on the diapause process of a unit time exposure to a given temperature.DIT,tfrom experimental observations (I), temperature-specific parameters (h), and functional forms (——).
D.R. Gray et al. / Journal of Insect Physiology 47 (2001) 173–184
Table 3
Estimated temperature-specific parameter values
Temperature (°C) RS RP A PDR I0
— 1.10
25 0.00800 1.13500 0.30000 0.00556
0 0.07050 1.04000 0.35000 0.00716
5 0.08000 1.02500 0.55000 0.00751
10 0.08750 1.00065 0.59000 0.02488
15 0.09572 1.00060 0.80000 0.06481
20 0.10000 1.00052 0.95000 0.17900
25 0.10000 1.00010 1.00000 0.40686
showed dramatic increases after sufficient exposure to 5°C. At intermediate temperatures, increases in predicted
DIT,t were more gradual as diapause progressed. The
temperature-specific parameter values also predicted temperature-dependent trends that were very similar to observed trends (Fig. 3). For example, 30 days after the onset of diapause a minimum valueDIT,twas predicted between 0 and 10°C. An increase or a decrease in tem-perature is predicted to result in an increase inDIT,t. The same trend is seen 50 days after the onset of diapause (Fig. 3).
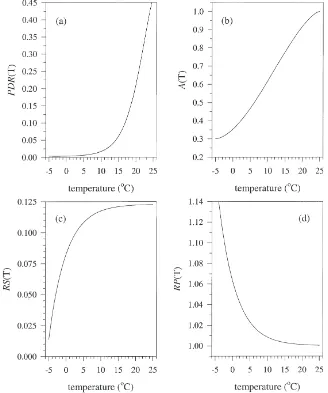
3.3. Temperature-dependent functional forms and model predictions
The final parameter estimates for the temperature-dependent functional forms ofPRD,A,RSandRP(Fig. 4) also predicted trends in DIT,t that were very similar to those observed (Fig. 2, Fig. 3). Thirty days after the
onset of diapause the minimum DIT,toccurs between 5
and 9°C. Fifty days after the onset of diapause the mini-mumDIT,toccurs between 5 and 8°C (Fig. 3). Increases or decreases in temperature produce higher values of
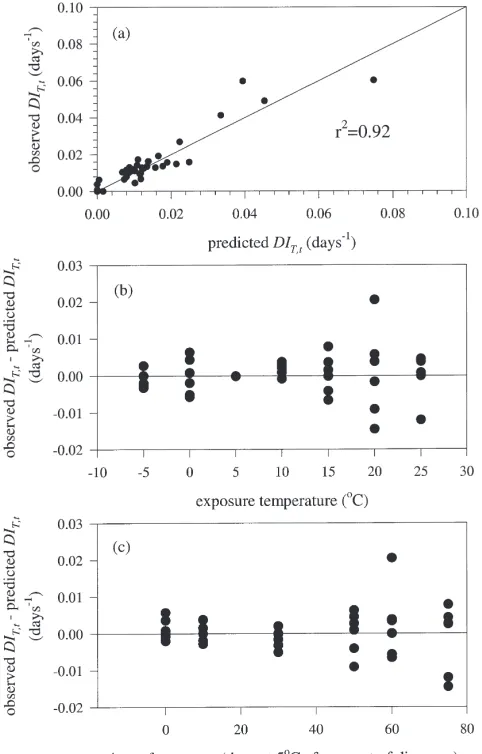
DIT,t. The functional forms explained 92% of the varia-bility in the observed DIT,t values (Fig. 5(a)) and there was no detectable bias in errors when examined by exposure temperature (Fig. 5(b)) or time of exposure (Fig. 5(c)). Eq. (3) produces an increasing rate of depletion at all constant temperatures (Fig. 6). The model predicts that the inhibitor is completely eliminated
by 30 days at 25 or 0°C, by 110 days at 5°C, and
slightly more than 200 days at 10°C. Final estimates of parameter values are shown in Table 4.
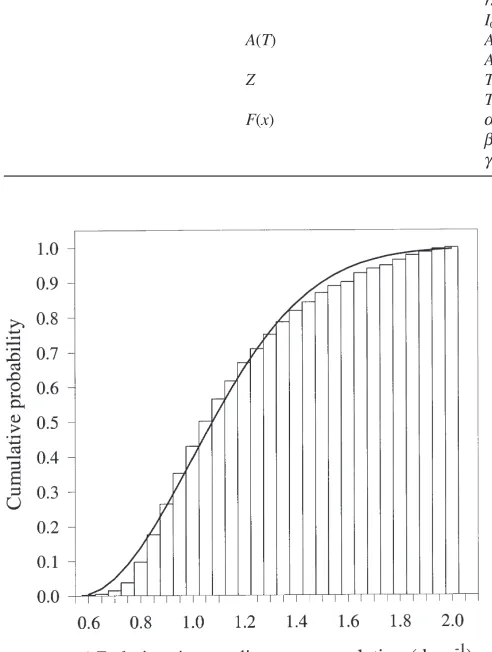
The temperature- and time-independent description of variability of the population in response to temperature was approximately twice as great as that shown by Gray et al. (1991) for prediapause gypsy moth eggs or by Gray et al. (1995) for postdiapause gypsy moth eggs (Fig. 7). Parameter values describing the variability are shown in Table 4.
4. Discussion
The model described here, with its dual processes of an inhibited developmental response (Fig. 4(a) and (b)) and the depletion of the inhibitor (Fig. 6), accurately pre-dicted the observed trends in diapause impact (Fig. 2, Fig. 3). The earliest exposure to 25°C has a minimal
diapause impact because potential developmental
response is low at 25°C (Fig. 4(a)), and because very little of the inhibitor is removed (Fig. 6). Therefore, actual developmental response remains low when eggs are returned to 5°C (Fig. 2 and Fig. 3). Later exposure to25°C has a greater diapause impact because a greater daily depletion of inhibitor occurs (Fig. 6). This allows a greater actual developmental response to occur when eggs are returned to 5°C. Still later in the diapause phase,
diapause impact of 25°C decreases in spite of the
greater daily depletion of inhibitor (Fig. 6) because a smaller proportion of the diapause phase remains to be completed during which the effect of the depletion can be manifested. Early exposure to 25°C has zero diapause impact because no depletion of inhibitor occurs, and because the inhibitor is fully active at that temperature,
preventing realization of potential developmental
response. Later in the diapause phase, inhibitor has been depleted (during the preceding time at 5°C), thereby allowing a greater realization of potential developmental response at 25°C.
Fig. 4. The relationship between the four parameters governing diapause development and temperature. (a)PDR(T) is the developmental response that would occur in the absence of inhibitor; (b)A(T) is a measure of the relative activity of the inhibitor; (c)RS(T) is a relative measure of how soon the inhibitor will begin to be depleted; (d)RP(T) is a measure of the rate of depletion of the inhibitor. Function parameters are given in Table 4.
development and general inactivity, but rather a state of development very similar to any other. Andrewartha (1952) accurately described this as diapause develop-ment. And Masaki (1956) concluded that a process occurs during diapause that “accelerates hatching”, and that the “temperature coefficient” of the process changes during the phase (although he was not able to distinguish diapause and postdiapause phases). Biochemical pro-cesses (albeit different ones than those in non-diapausing states) are active, and a controlling process must be com-pleted before passing to the subsequent stage of develop-ment. At any point in time during the diapause phase, the physiological age in diapause can be interpreted as the proportion of the process that has been completed. Diapause in the gypsy moth is still also regarded as a time when response to external variables is somewhat inhibited; and inhibition can only be broken by a finite
period of exposure to low temperatures (see Giese and Casagrande (1981) for a review).
The model presented here combines these elements of dynamicism and inhibition. Diapause is modeled as a dynamic developmental phase. Throughout the phase, biochemical processes are active and individuals respond to the external environment. Diapause is a phase of development that can still be modeled with the classic
developmental index paradigm. The sum of our ADR
function (actual developmental response) is analogous to
developmental index and the sum of the ADR function
is equivalent to physiological age in diapause. The model also captures the manner in which exposure to low temperature facilitates the termination of the
diapause phase (cold sensibilization sensu Zaslavski
D.R. Gray et al. / Journal of Insect Physiology 47 (2001) 173–184
Fig. 5. A comparison of diapause impacts (DIT,t=[12 (t15+t25)/tmed5]/tT), observed and predicted by the functional forms. (a) observed versus predicted diapause impacts; (b) model residuals versus exposure temperature; (c) model residuals versus time of exposure.
response to be realized when the egg is later exposed to
high temperatures. The parameters RS(T) and RP(T),
which govern the depletion of the inhibitor, can be inter-preted roughly as “the amount of exposure (at that temperature) required to initiate depletion of the inhibi-tor” [RS(T)], and “the rate of depletion of the inhibitor with exposure to that temperature” [RP(T)].
However, in our model the term “diapause develop-ment” can no longer be used unambiguously. Progress (or development) can occur in either the depletion of inhibitor (dI/dt) or the actual developmental response function (ADR). But it is only the sum of theADR func-tion that represents physiological age in the diapause phase. Also, absolute estimates of diapause impact resulting from exposure to a given temperature is of little descriptive use because diapause impact is partially dependent on temperatures that follow the exposure. Zaslavski (1988) termed this type of response a
“step-Fig. 6. The relationship between concentration of inhibitor and time exposed to constant temperatureT. Function parameters are given in Table 4.
wise reaction” because the response is relative and
depends on either the preceding or subsequent
exposures. Therefore, it can no longer be clear what is meant by diapause development. A distinction must be made between the two types of development in diapause: actual development (aging) and depletion of the inhibi-tor.
The combined effect of the two processes is that gypsy moth eggs require an exposure to winter conditions before hatching can occur. Gray et al. (1991) showed that gypsy moth eggs are likely to enter diapause within 30 days of oviposition under most conditions in the mid-to north-eastern US. When gypsy moth eggs are in diapause the inhibitory agent prevents rapid aging in response to the high temperatures still prevalent in the late summer and early autumn. Exposure to low tem-peratures, such as would be experienced during winter, are required before significant actual developmental response can occur under high temperature conditions. Similarly, the exceedingly low potential developmental response that occurs at low temperatures (Fig. 4(a)) ensures that diapause will not be readily completed with-out the return of the high temperatures that accompany spring.
tem-Table 4
Estimated parameter values for the two processes of diapause (PDR(T) andd
dtI(T)), the activity level of inhibitor (A) and population variability in response to temperature. d
dtI(T)=max{2I,[I2I02RS(T)]×lnRP(T)}, where RS(T)=c+rsrp×RP(T) and RP(T)=1.0+rpc×exp(Z)6 and Z=(Tmax2T)/(Tmax2Tmin).PDR(T)=exp(c+pdrT×T+pdrT2×T2+pdrT4×T4).A(T)=0.3+0.7×(12Z)A1×Z
A2
whereZis as above.F(x)=12exp[2(x2g)/b]a
Process Function Parameter Parameter value
PDR(T) c 25.627108200
pdrT 0.059969414
pdrT2 0.010390411
pdrT4 20.000007987
RP(T) rpc 0.00042178
d dtI(T)
RS(T) c 0.7633152
rsrp 20.6404470
I0 1.1880
A(T) A1 1.56441438
A2 0.46354992
Z Tmin 25°C
Tmax 25°C
F(x) a 2.00000
b 0.62062
g 0.56000
Fig. 7. The cumulative probability of diapause completion versus the inverse of the relative time (observed:h; estimated from Eq. (9): —— ). Relative time is defined as the elapsed time (days) from the com-pletion of exposure to the experimental temperature divided by t25, (Eq. (1)) from the treatment.
peratures, which might more appropriately be called diapause depth. In our model the depth of diapause can be equated toI, the level of inhibitor remaining. An indi-vidual with a greater I is deeper in diapause and there-fore less able than another individual to respond to high temperatures. Diapause depth is thus distinct from
physiological age, which is the summation of the ADR
function, although the two are intertwined.
The models of Johnson et al. (1983), Waggoner (1984), Lyons and Lysyk (1989) and Hunter (1993) assume that diapause is completed by an arbitrary calen-dar date. The model of Sawyer et al. (1993) assumes that diapause begins on an arbitrary calendar date. All of the models are sensitive to the selected date. This poses seri-ous problems since there is no reliable way of determin-ing appropriate startdetermin-ing dates, and because such dates probably vary geographically or annually. Our model is insensitive to the date of diapause initiation for the fol-lowing reason. Across the gypsy moth range, high tem-peratures will prevail at the time of diapause initiation. The high concentration of inhibitor (I) at the onset of diapause and the high inhibiting effect of the inhibitor (A) that will be in effect under conditions of high
tem-peratures causes negligible accumulation in the ADR
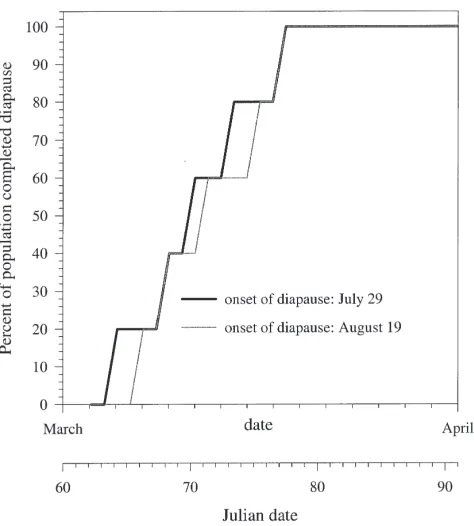
function. The high temperatures that will be common at this time will also result in negligible depletion of inhibi-tor (dI/dt). Therefore it is not critical that the exact time of diapause initiation be known. In fact, predicted diapause termination (fiftieth percentile) differed by 1 day (Fig. 8) when diapause initiation was altered by 21 days (July 29 to August 19) in our model under tempera-ture conditions recorded in Pennsylvania.
An inhibitory factor has long been hypothesized in the diapause process (see Andrewartha, 1952 (p. 85)). However, the complete elimination of the inhibiting fac-tor was assumed to be a prerequisite to the termination of diapause. More recently Suzuki et al. (1990) proposed a diapause control mechanism in the pharate first instar
of the silkmoth (Antheraea yamamai) comprised of a
D.R. Gray et al. / Journal of Insect Physiology 47 (2001) 173–184
Fig. 8. The distribution of diapause termination for two populations with different dates of diapause initiation.
would prematurely terminate diapause in gypsy moth eggs that had been chilled for at least 20 days but that the effect of KK-42 was not as an anti-JH or anti-ecdys-teroid. Lee and Denlinger (1997) and Lee et al. (1997) showed that high ecdysteroid titre is critical in the main-tenance of diapause in the gypsy moth. However, it is not clear from their work if a reduction in ecdysteroid titre is all that is required for diapause termination, nor is it clear if diapause can be terminated without complete elimination of ecdysteroid. Noguchi and Hayakawa (1997) suggested that dopamine in the cabbage army-worm inhibits brain neurosecretion, such as protho-racicotropic hormone, which is requisite for postdiapause development. Thus, it seems likely that diapause mainte-nance and termination are under endocrine control, but the exact mechanism remains unknown. The results and model presented here suggest that progression toward diapause completion is enhanced as a proposed inhibi-tory agent is eliminated. It is important to note that com-plete elimination of the agent is not a prerequisite to diapause development. We have estimated the effect of temperature on reducing the titre of such an agent, and on the temperature-dependent inhibitory effect of such an agent, and on an uninhibited developmental response to temperature in diapause. It is our suggestion that future investigations into the biochemical processes con-trolling diapause development attempt to examine the fate of prospective compounds at various times during the diapause process in relation to age-specific diapause development, rather than in relation to diapause termin-ation only.
Acknowledgements
This research was supported by Gypsy Moth Extra-mural Grants Program, Cooperative Agreement 23-730, USDA, Forest Service, Northeastern Forest Experiment Station. The authors thank Dr J. Re´gnie`re of the Lauren-tian Forestry Centre for his assistance in deriving Eqs. (6) and (7) and Drs T. Lysyk of Agriculture and Agri-Food Canada and M. Montgomery of the USDA Forest Service for reviewing the manuscript.
References
Andrewartha, H.G., 1952. Diapause in relation to the ecology of insects. Biological Review 27, 50–107.
Giese, R.L., Casagrande, R.A., 1981. Egg development and diapause. In: Doane, C.C., McManus, M.L. (Eds), The Gypsy Moth: Research Toward Integrated Pest Management. USDA Tech. Bull. 1584, pp. 145-152.
Giese, R.L., Cittadino, M.L., 1977. Relationship of the gypsy moth to the physical environment. II. Diapause. University of Wisconsin, Dept. of Forestry, Staff Paper #6, 13 pp.
Gray, D.R., Logan, J.A., Ravlin, F.W., Carlson, J.A., 1991. Toward a model of gypsy moth egg phenology: using respiration rates of individual eggs to determine temperature–time requirements of pre-diapause development. Environmental Entomology 20, 1645–1652. Gray, D.R., Ravlin, F.W., Re´gnie`re, J., Logan, J.A., 1995. Further advances toward a model of gypsy moth (Lymantria dispar(L.)) egg phenology: respiration rates and thermal responsiveness during diapause, and age-dependent developmental rates in postdiapause. Journal of Insect Physiology 41, 247–256.
Grijpma, P., 1989. Overview of research on Lymantrids in eastern and western Europe. In: Lymantriidae: A Comparison of Features of New and Old World Tussock Moths, USDA Gen. Tech. Report NE-123, pp. 21-49.
Hunter, A.F., 1993. Gypsy moth population sizes and the window of opportunity in spring. Oikos 68, 531–538.
Jennrich, R.I., Moore, R.H., 1975. Maximum likelihood estimation by means of nonlinear least squares. In: Proceedings of the Statistical Computing Section. American Statistical Association, pp. 57–65. Johnson, P.C., Mason, D.P., Radke, S.L., Tracewski, K.T., 1983.
Gypsy moth, Lymantria dispar(L.) (Lepidoptera: Lymantriidae), egg eclosion: degree–day accumulation. Environmental Ento-mology 12, 929–932.
Law, M.A., Kelton, W.D., 1982. Simulation modeling and analysis. McGraw-Hill, New York.
Lee, K.-Y., Denlinger, D.L., 1997. A role for ecdysteroids in the induc-tion and maintenance of the pharate first instar diapause of the gypsy moth, Lymantria dispar. Journal of Insect Physiology 43, 289–296.
Lee, K.-Y., Valaitis, A., Denlinger, D.L., 1997. Further evidence that diapause in the gypsy moth, Lymantria dispar, is regulated by ecdysteroids: a comparison of diapause and nondiapause strains. Journal of Insect Physiology 43, 897–903.
Leonard, D.E., 1968. Diapause in the gypsy moth. Journal of Economic Entomology 61, 596–598.
Leonard, D.E., 1981. Bioecology of the gypsy moth. USDA Forest Service Technical Bulletin 1584, 9–29.
Logan, J.A., 1988. Toward an expert system for development of pest simulation models. Environmental Entomology 17, 359–376. Lyons, D.B., Lysyk, T.J., 1989. Development and phenology of eggs
Old World Tussock Moths, USDA Gen. Tech. Rep. NE-123, pp. 351-365.
Masaki, S., 1956. The effect of temperature on the termination of diapause in the egg of Lymantria dispar Linne´ (Lepidoptera: Lymantriidae). Jap. J. Appl. Zool. 21 (4), 148–157.
Noguchi, H., Hayakawa, Y., 1997. Role of dopamine at the onset of pupal diapause in the cabbage armyworm Mametra brassicae. FEBS Letters 413, 157–161.
Pantyukhov, G.A., 1964. The effect of low temperatures on different populations of the brown-tail mothEuproctis chrysorrhoea(L.) and the gypsy moth Lymantria dispar (L.) (Lepidoptera: Orgyidae). Entomological Review 43, 47–55.
SAS Institute, 1988. SAS/STAT User’s Guide, v.6.03. SAS Institute, Cary, NC.
Sawyer, A.J., Tauber, M.J., Tauber, C.A., Ruberson, J.R., 1993. Gypsy moth (Lepidoptera: Lymantriidae) egg development: a simulation analysis of laboratory and field data. Ecological Modelling 66, 121–155.
Stinner, R.E., Butler, G.D. Jr., Bacheler, J.S., Tuttle, C., 1974. Simul-ation of temperature-dependent development in populSimul-ation dynam-ics models. Canadian Entomologist 107, 1167–1174.
Suzuki, K., Minagawa, T., Kumagai, T., Naya, S.-I., Endo, Y., Osanai, M., Kuwano, E., 1990. Control mechanism of diapause of the phar-ate first-instar larvae of the silkmothAntheraea yamamai. Journal of Insect Physiology 36, 855–860.
Suzuki, K., Nakamura, T., Yanbe, T., Kurihara, M., Kuwano, E., 1993. Termination of diapause in pharate first-instar larvae of the gypsy mothLymantria dispar japonicaby an imidazole derivative KK-42. Journal of Insect Physiology 39, 107–110.
Tauber, M.J., Tauber, C.A., Masaki, S., 1986. Seasonal Adaptations of Insects. Oxford University Press, Oxford.
Waggoner, P.E., 1984. The hatching of gypsy moth eggs, a phenolog-ical model. Agricultural and Forest Meteorology 33, 53–65. Zaslavski, V.A., 1988. Insect development. Photoperiodic and