e-Journal of English Language Teaching Society (ELTS) Vol. 4 No. 1 2016 – ISSN 2331-1841 Page 1
IMPROVING PRONUNCIATION
OF ASPIRATED SOUNDS
THROUGH AUDIO VISUAL METHOD OF
GRADE EIGHTH STUDENTS
Muh. Zahrizan Fajri Haruna1, Hasan Basri2, Abd Kamaruddin3
Abstract
The objective of this research was to prove that the application of Audio Visual Method can improve the ability of the eighth grade students of MTs Cik Ditiro in pronunciation. This research employed intact research design. The study applied purposive sampling which involved experimental and control groups. He applied two instruments test and observation in collecting data. The result of the data analysis showed that the mean score of experimental group (74.66) was greater than the mean score of control group (54.08) and the result of t-counted (5.73) which was greater than t-table (2.01). There was a significant difference of the achievement. It means that, the study hypothesis was accepted that the use of Audio Visual Method was effective to improve pronunciation of aspirated sounds of the eight grade students at MTs Cik Ditiro Palu.
Keywords: Pronunciation; aspirated sounds; audio visual method.
INTRODUCTION
Studying English is not easy for many students of Indonesia since it is a foreign language. Although it is a foreign language, it is very important to be mastered because it is a global language. For Indonesian education, it is one of important subjects to teach. It is introduced in playgroup and kindergarten and it will be continued from elementary school
up to University. There are four English language skills which are needed to be mastered. With their excellent mastery of English, the students will be able to expect more because English is used as means of communication in international contact.
There are four language skills, they are listening, reading, writing and speaking. Listening to and reading content in the language the students learning is a great way to develop their vocabulary and comprehension. It is important to make their listening and reading active rather than passively absorbing the content. Writing in another language can
1
e-Journal of English Language Teaching Society (ELTS) Vol. 4 No. 1 2016 – ISSN 2331-1841 Page 2 seem a daunting task, but is a critical skill, especially if they plan to use it in the workplace. Speaking skill will involve gaining fluency in spoken interactions with others, as well as practicing their pronunciation.
Pronunciation is the important parts of speaking. It is the way in which a language or particular word or sound is spoken. It is used to make the speaker speaks more fluency and easy to understand. Fluency can be thought of as the ability to keep going when speaking spontaneously. There are some rules to pronounce the word in pronunciation. And it also consists of the way to produced the word or the letter using our speaking organs. We can learn about it to make our speaking well. It is the aspect that most affects how the speaker is judged by others, and how they are formally assesed in other skills. Sometimes
how to measure the people’s English speaking skill is looked from their pronunciation and
their fluency. We have to learn pronunciation so that we can express our English to good pronunciation.
There are several sounds in English which are not found in Bahasa Indonesia. it made it difficult for Indonesian students to learn pronunciation, for instance, aspirated sounds (/p/, /t/, /k/). In Indonesian, sound /p/ as in patah [patah], sound /t/ as in tukar [tukar], and sound /k/as in kuat [kuat] are not aspirated, while in English, sounds such /p/ /t/ and /k/ as in put [phut], top [thop], and keep [khep] are aspirated when the sounds occur at the beginning of syllable with a strong stress.
Some books actually have been improved by adding pronunciation materials hoping that the students would practice more to improve their pronunciation. However, the fact is still far from what is expected. As a result, it is still difficult for them to pronounce the English well.
Factors that make the students have difficulty to pronounce words appropriately are stated by Kelly (2000:08) as follows :
1. The learners first language ( referred to as L1 ) may have one-to-one relationship between sounds and spellings. The concept not being such as relationship may be new.
2. Even if such a concept is not new for the learners, they will have to become familiar with a new sound-spelling relationship.
3. There may be sounds and combinations of sounds in L1 which do not occur in English.
4. There may be sounds and combinations of sounds, used in English, which do not occur in L1
e-Journal of English Language Teaching Society (ELTS) Vol. 4 No. 1 2016 – ISSN 2331-1841 Page 3 There are some way to practice pronunciation, reading aloud or repeating after a recorded text or wacth video, trying to reproduce the pronunciation and intonation of the original. Recording voices or wacthing video to identify own strengths and weaknesses as a speaker.
Video media is one of the tools that can help the teacher sends the materials to the students. The students catch the material by listening and watching. The media shows the animated pictures and the sounds that contains the material. The students are likely to get material by watching or listening than orally by the teacher. By this media, the students will be more interested to give attention to the lesson.
Based on the statement above, the researcher formulated a research question as
follows: Can the use of audio-visual method improve the pronunciation ability of grade VIII students of MTs Cikditiro Palu?The objective of this research was to find out whether
the use of audio visual method can improvethe pronunciation ability of Grade VIII students of MTS Cik Ditiro or not.
METHODOLOGY
In conducting this research, the researcher used intact group research design with one class as an experimental group and one class as a control group. In this case, those two classes were given to the same test for post-test. In intact group design, there was no pre-test and the treatment was only given to the experimental group while the control group was not.
The design of the research was recommended by Hatch & Farhady’s model (1982:21) as
follows :
G1 X T1
G2 T1
Where :
G1 = experimental group G2 = control group X = treatment T1= post-test
Population was an object of the research. The object can be people or things.
Population was needed “by every researcher when conducting a research. Best (1981:8) defines, “Population is any group of individuals that have one or more characteristics in
e-Journal of English Language Teaching Society (ELTS) Vol. 4 No. 1 2016 – ISSN 2331-1841 Page 4 took the grade eight students of MTS Cik Ditiro Palu as population of this research. There were eight clasess, from VIII A up to VIII H as the total number of the population.
Ary, Jacobs, and Razavieh (2002:163) define “A sample is the small group that is observed.” In taking sample of this research, the researcher used a purposive sampling
technique. The researcher applied that sampling technique because it was appropriate to the design of the research. In this research, the researcher chose VIII H as the experimental class and VIII G as the control class. Furthermore, the teacher of MTS Cik Ditiro Palu recommended him to conduct the research in those two classes because they still have problems in learning English especially in pronunciation.
Variable is a variation object of the study. There are two types of variables:
dependent variable and independent variable. Dependent variable is the response or the criterion variable that is presumed to be caused by or influence the independent treatment or independent variable. The independent variable is selected by researcher to determine the relationship with the dependent variable.
1. Dependent variable in this research was the students’ pronunciation ability of eighth grade students’ at MTs Cikditiro.
2. Independent variable of this research was Audio-visual Method as an independent treatment.
Instruments which were used in collecting data in this research were test (post test) and non test. The test used in order to measure the students’ ability after the researcher conducted the treatment to the students. It was to prove weather the treatment
can improve the students’ ability in pronunciation or not. While non test, observation. The rersercher did it when he conducted it aimed to know whether the students were interested to the method or not.
In treatment the researcher used audio-visual method. He conducted treatment six times excluding test and post-test. For the teaching material, the researcher took the conversation and reading passage from the English book that they used.
Post test was given to measure the students’ ability in pronouncing aspirated
sounds after receiving the treatment. After giving the treatment, the researcher gave the post-test to both groups.
To find out the individual score of each student, the researcher used formula
e-Journal of English Language Teaching Society (ELTS) Vol. 4 No. 1 2016 – ISSN 2331-1841 Page 5
� =
�
100Where:
NP = students’ score R = obtained score
SM = maximum score of the test 100= constant number
After getting the individual score of each student, then the researcher computed the mean score for both experimental and control groups. He used formula which is proposed by Hatch and Farhady (1982:59) as follows:
�= X
N
Where:
� = mean score
X = total of the individual scores
N = total of students
After that, the researcher analyzed the data in order to find out individual deviation
of students’ score for both experimental and control group that is proposed by Hatch and
Farhady (1982:59) as follows:
�= X−�
Where:
� = individual deviation X = student’s score
� = mean score
After getting the individual deviation of students’ score, the researcher squared the
standard deviation of students score for both experimental class and control class. The researcher used the formula which is recommended by Hatch and Farhady (1982:59):
s
= x2e-Journal of English Language Teaching Society (ELTS) Vol. 4 No. 1 2016 – ISSN 2331-1841 Page 6 Where:
s = standard deviation
x2= sum of individual squared deviation
N = total of students
After getting the standard deviation, the researcher calculated the standard error
first by using the formula which is proposed by Hatch and Farhady (1982:112) in order to find out the value of t-value:
��−�
=
�1 2
+
�2 2
Where :
��−� = standard error of differences between means
� = standard deviation of experimental class � = standard deviation of control class
1 = total students of experimental class 2 = total students of control class.
Finally, the writer calculated the tvalue by using the formula stated by Hatch and
Farhady (1982: 111):
=
��−���−�
Where :
= significant result experimental and control class
�� = mean score of experimental group � = mean score of control group
�� − � = standard error of differences between means
FINDINGS
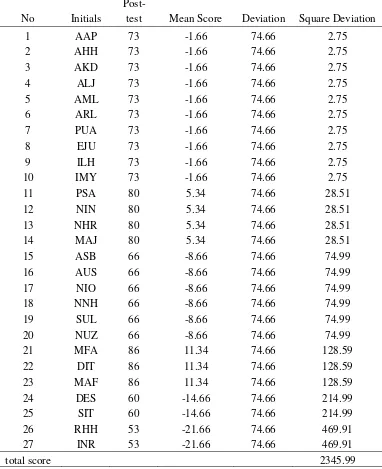
e-Journal of English Language Teaching Society (ELTS) Vol. 4 No. 1 2016 – ISSN 2331-1841 Page 7 The mean of experimental group
�= Σ�
X = 2016
27 = 74.66
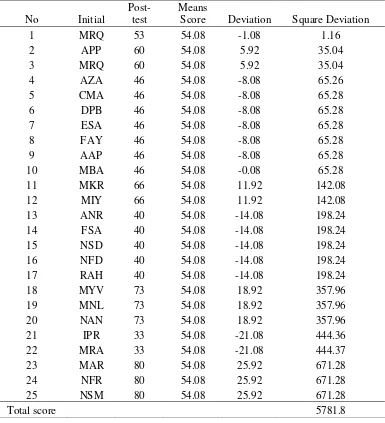
The mean of control group
�=Σ�
X = 1352
25 = 54.08
Based on the result of mean score of post-test in experimental and control groups,
the researcher continued counting deviation and square deviation of students’ score in
e-Journal of English Language Teaching Society (ELTS) Vol. 4 No. 1 2016 – ISSN 2331-1841 Page 8 Table 1
Deviation of the Post- test in experimental group
No Initials
Post-test Mean Score Deviation Square Deviation
1 AAP 73 -1.66 74.66 2.75
2 AHH 73 -1.66 74.66 2.75
3 AKD 73 -1.66 74.66 2.75
4 ALJ 73 -1.66 74.66 2.75
5 AML 73 -1.66 74.66 2.75
6 ARL 73 -1.66 74.66 2.75
7 PUA 73 -1.66 74.66 2.75
8 EJU 73 -1.66 74.66 2.75
9 ILH 73 -1.66 74.66 2.75
10 IMY 73 -1.66 74.66 2.75
11 PSA 80 5.34 74.66 28.51
12 NIN 80 5.34 74.66 28.51
13 NHR 80 5.34 74.66 28.51
14 MAJ 80 5.34 74.66 28.51
15 ASB 66 -8.66 74.66 74.99
16 AUS 66 -8.66 74.66 74.99
17 NIO 66 -8.66 74.66 74.99
18 NNH 66 -8.66 74.66 74.99
19 SUL 66 -8.66 74.66 74.99
20 NUZ 66 -8.66 74.66 74.99
21 MFA 86 11.34 74.66 128.59
22 DIT 86 11.34 74.66 128.59
23 MAF 86 11.34 74.66 128.59
24 DES 60 -14.66 74.66 214.99
25 SIT 60 -14.66 74.66 214.99
26 RHH 53 -21.66 74.66 469.91
27 INR 53 -21.66 74.66 469.91
e-Journal of English Language Teaching Society (ELTS) Vol. 4 No. 1 2016 – ISSN 2331-1841 Page 9 Table 2
Deviation of the Post- test in Control group
From the calculation mean deviation in post- test in experimental group and control group, the researcher continued the count deviation score of post- test in both of group. The results of the deviation score is presented below:
=
�
Score Deviation Square Deviation
e-Journal of English Language Teaching Society (ELTS) Vol. 4 No. 1 2016 – ISSN 2331-1841 Page 10 The deviation score of experimental group in post- test was = 9.49
=
�
The deviation score of control group in post- test was = 15.52
e-Journal of English Language Teaching Society (ELTS) Vol. 4 No. 1 2016 – ISSN 2331-1841 Page 11
=
�
�− �
�
�− �
=
74.66− 54.083.59
= 5.73
DISCUSSION
In this research, the researcher discusses about the finding of the research. The
researcher took a sample of his research in MTs Cikditiro Palu. The researcher used two classes that recommended from the English teacher at MTs Cikditiro Palu because they still have problems in learning English especially in pronunciation. In the experimental class, the researcher applied audio visual method to make students enjoyed and interested in teaching pronunciation. But in control class, the researcher just gave a post test. Actually control class applied audio visual method but in another types. Thus, both of the results have a few differences only.
Firstly, based on the result of post-test of control group showed that there were only 17 students whose score improved and there were 10 students who get score less. In addition, the ten students of experimental group whose score was equal or greater than 80. The greatest score was 86. There were three students of control group who got score equal or greater than 80 because the greatest score also 86. It happened because the researcher applied well audio visual method for six meetings to the experimental group by following all aspects in lesson plan.
Secondly, the researcher found that some factors also had contributed well to the success of the post-test of experimental group. They were the researcher explained well the technique to the students including the steps or procedures of audio visual method, how to know the sound of aspirated sound and how to pronounced the words correctlly. The researcher implemented audio visual method systematically. Before playing the video to
e-Journal of English Language Teaching Society (ELTS) Vol. 4 No. 1 2016 – ISSN 2331-1841 Page 12 evaluation. It was important to accustom the students to work punctually. The researcher asked the students to try to pronounce the words containing aspirated sounds. They were assigned to understand the text containing the sound in sentences rather than word by words.
Finally, based on the research findings, the researcher proved that the implementation of aspirated sounds through audio visual method had given big
contribution to the improvement of students’ pronunciation on aspirated sounds.
CONCLUSIONS AND SUGGESTIONS
Based on the data of this research, the conclusions were that firstly, the use of
audio visual method in English teaching to improve students pronunciation was effective. It could be seen from the mean score between experimental group post test and control grouppost test. Secondly, the mean score of the experimental group post test was higher than the mean score of control group post test. It was also proved by the t-counted value that was highher than t-table. It showed that applying audio visual method as a medium can improvestudents’pronunciation.
The researcher would like to share some suggestions to develop teaching and
learning pronunciation specially aspirated sound. First of all, the teachers of English should apply audio visual method in teaching pronunciation. they could give some examples and activities before asking students to watch the video. It is useful to make them interested in learning pronunciation. It is suggested that the students should try to use this method to help them in improving their pronunciation.
REFERENCES
Ary, D., Jacobs, L.C., & Razavieh, A. (2002). Introduction to Research in Education. Bellmont, CA: Wadsworth/Thomson Learning.
Hatch & Farhady. (1982). Research Design and Statistics for Applied Lingusitics. Rowley, Massachusetts : Newbury House Published. Inc.