Logistic regression analysis of factors influencing core
breakdown in ‘Conference’ pears
Jeroen Lammertyn
a,*, Marc Aerts
b, Bert E. Verlinden
a,
Wendy Schotsmans
a, Bart M. Nicolaı¨
aaKatholieke Uni6ersiteit Leu6en,Flanders Centre for Posthar6est Technology,W. de Croylaan42,3001 He6erlee, Belgium bLimburgs Uni6ersitair Centrum,Center for Statistics,Uni6ersitaire Campus,3590 Diepenbeek, Belgium
Received 10 January 2000; accepted 2 May 2000
Abstract
Core breakdown of ‘Conference’ pears (Pyrus communisL.) is characterised by softening and browning of tissue near the core and is associated with the development of cavities. The disorder causes large economic losses of ‘Conference’ pears in Belgium, stored under controlled atmospheres. Factors that influence development of the disorder, CO2and O2concentration, the size and weight of the pear, the picking date and the storage temperature,
were investigated. Multiple logistic regression was used to establish prediction and classification models for both internal browning and cavity development. Over-mature fruit was more susceptible to core breakdown during storage. It was also found that pears with a large weight had a higher probability of developing brownheart.R2values from
0.7 to 0.92 were obtained between the predicted and measured percentages of brownheart and cavities. The models classified up to 86% of the pears correctly. In a final analysis, the time sequence of the symptoms occurring during core breakdown disorder development was modelled with a generalized logits model. © 2000 Elsevier Science B.V. All rights reserved.
Keywords:Carbon dioxide; Core breakdown; Logistic regression; Oxygen; Pear; Picking date
www.elsevier.com/locate/postharvbio
1. Introduction
With a yearly production of over 500 000 tons,
Pyrus communis L. cv. Conference is one of the most important pear cultivars in Europe. In Bel-gium, ‘Conference’ pears usually are picked
dur-ing the first weeks of September and good postharvest storage conditions need to be applied to maintain good fruit quality over a period of a year. Much research has been directed towards the determination of the optimum controlled at-mosphere (CA) conditions to prevent postharvest deterioration of ‘Bartlett’ pears (Boersig et al., 1988; Kader, 1989; Wills et al., 1998) and ‘Confer-ence’ pears (Roelofs and de Jager, 1997). A
re-duced O2 concentration (1.5 – 2.5%) and a slightly
elevated CO2concentration (0.7 – 1%) in
combina-* Corresponding author. Tel.: +32-16-322376; fax: + 32-16-322955.
E-mail address: [email protected] (J. Lammertyn).
tion with a low temperature (−0.5 – 1°C) reduces the biochemical changes associated with respira-tory metabolism, physical injuries, and physiolog-ical and pathologphysiolog-ical breakdown (Brady and Romani, 1988; Kerbel et al., 1988; Chavez-Franco and Kader, 1993; Mathooko, 1996). However, an
elevated CO2 concentration during postharvest
storage can cause CO2-related injuries such as core breakdown, also called brownheart or browning (Kadam, 1995). This is a physiological disorder characterised by browning and softening of tissue near the core. It is often coupled with the development of cavities. The time course of inter-nal browning and appearance of cavities suggests that cavities arise from the brown areas (Roelofs and de Jager, 1997). These authors also found that over-mature ‘Conference’ pears are more sus-ceptible to core breakdown during storage. A serious breakdown is often observed when the pears are removed from CA conditions for selling. Late harvested ‘Bartlett’ pears also show an
in-crease in CO2 in the tissue around the core, until
the onset of core breakdown (Kadam, 1995). Velt-man et al. (1999) associated browning in ‘Confer-ence’ pears with the disappearance of ascorbic acid. Larrigaudiere et al. (1998) and Lentheric et al. (1999) discussed the relation between harvest date, ascorbic acid concentration and internal browning. The physiological and quality re-sponses of ‘Bartlett’ pears to modified gas atmo-spheres were studied by Ke et al. (1990). Exposure of the fruits to O2-reduced and CO2-enriched at-mospheres resulted in reduced respiration and increased ethanol and acetaldehyde
concentra-tions. Pears stored for a long time under high CO2
levels showed CO2injury. However, the literature
concerning the development of this disorder in other European pear cultivars is scarce. In addi-tion to this, no literature on a statistical modelling approach to predict core breakdown was found. However, such a predictive model can be valuable in predicting the susceptibility of pears to core breakdown as affected by their intrinsic quality attributes (soluble solids content (SSC), firmness, weight) and storage conditions. Storage condi-tions could then be fine-tuned for a particular fruit lot. A predictive model can also give insight into the role of interaction between two or more storage parameters.
The specific objectives of this study were (1) to determine the effect of the storage gas composi-tion, the storage temperature, the storage time, the picking date and quality parameters of ‘Con-ference’ pears on the incidence of core breakdown as well as to determine the interaction effects between the storage parameters; and (2) to de-velop a statistical model that can predict
brown-ing incidence of pears given the quality
parameters and the storage conditions. In this way, postharvest storage simulations can be per-formed. A storage scenario to obtain pears with brownheart, for further research, can be derived from this statistical model.
2. Materials and methods
2.1. Experimental design
Pears used for this experiment were picked from 40 randomly chosen trees at the Centre for Fruit Culture in Rillaar (Belgium). A complete factorial design was performed, consisting of three
picking dates (early 9/9/1997, optimal 15/9/1997
and late 23/9/1997) and ten CA storage conditions
(0.7% CO2+2% O2at −0.5 and 1°C; 5% CO2+
2% O2at −0.5 and 1°C; 0.7% CO2+0.5% O2 at
−0.5 and 1°C; 5% CO2+0.5% O2 at −0.5 and
1°C; 0.03% CO2+21% O2, −0.5 and 1°C). The
optimal picking dates for Belgium were deter-mined by the Flanders Centre for Postharvest Technology, based on a comparison of refrac-tometer values, starch index, acidity and Mag-ness-Taylor firmness with historical data. On each picking date 672 pears were harvested: 32 were analysed for disorders and several quality at-tributes before CA storage, 640 were stored under the specified CA conditions. After 2, 4, 6 and 8
months of storage, 480 (16 pears×ten
condi-tions×three picking dates) pears were evaluated.
All the pears were conditioned on the 2nd of October 1997. The earliest picked pears were
cooled to −0.5°C for 3 weeks in air. The pears of
date. Roelofs and de Jager (1997) found that a cooling period of up to 30 days preceding estab-lishment of CA conditions decreased the incidence of core breakdown without affecting the fruit quality significantly.
Pears for model validation were picked in the orchards of Velm (Nationale Proeftuin voor Grootfruit), Zellik (commercial orchard) and Ril-laar (Fruitteeltcentrum) in Belgium at three
pick-ing dates (early 9/9/1997, optimal 15/9/1997 and
late 23/9/1997). All pears were held at −0.5°C
for 1 week before CA establishment. CA
condi-tions were 2% O2+0.7% CO2at −0.5°C and 2%
O2+5% CO2 at −0.5°C. After 2, 4, 6 and 8
months of storage, 240 pears from each orchard
(40 pears×two conditions×three picking dates)
were analysed for physiological disorders as de-scribed above. No quality measurements were performed on these pears. To test the model validity over a year, pears were picked in 1998 in
Velm and Zellik at 24/8/1998 (early), 31/8/1998
(optimal) and 1/9/1998 (late). After 1 week of
cooling (−0.5°C) the pears were stored at the
same conditions as in 1997 and after 2, 4, 6 and 8 months of storage, for each orchard 480 (80
pears×two conditions×three picking dates)
pears were analysed for core breakdown and quality attributes.
2.2. Quality measurements
Each pear was weighed (g) and the largest diameter (mm) was measured with a caliper. The soluble solids content (SSC) was measured (°Brix) with a refractometer (PR-101, ATAGO, Japan). A standard colour card (Golden Eurofru, CTIFL, Paris) was used to assign a colour score between 1 (dark green) and 8 (yellow). A Magness-Taylor (Gullimex, Germany) penetrometer with a 8 mm diameter probe was used to measure the firmness of the fruit (N). Finally, each pear was cut in two and the absence or presence of the disorder was coded with 0 and 1, respectively. The proportion of disordered pear events in a set of pears that were picked at the same date and had been stored in the same conditions, was calculated.
2.3. Statistical analysis
2.3.1. Logistic regression
Logistic regression is a statistical method used to analyse binary and binomial response data. It is based on the construction of a statistical model describing the relationship between the observed response and explanatory variables, also called independent variables (Hosmer and Lemeshow, 1989; Collett, 1991). The dependence of the prob-ability of disorder on explanatory variables is modelled as follows
for the set ofmexplanatory variables (e.g. 2% O2,
0.7% CO2, −0.5°C, early picking date, etc.);iand
jindicate the number of the batch and the number
of the explanatory variable (see Table 1),
respec-tively;piis the probability defined by the
propor-tion of disordered pear events in batch i, andais
an intercept parameter. The bj parameter relates
to the jth explanatory variable; it describes the
importance of the jth explanatory variable. Since
a logit transformation of a proportion is
dimen-sionless, the units of bjare the reciprocal units of
the corresponding explanatory variable xij.
The logit function transforms the probability
scale from the range (0, 1) to (−, +). Other
transformations are possible, but the logit
trans-formation leads to coefficients b interpretable in
terms of odds ratios which is a measure of associ-ation that is widely used, especially in
epidemiol-ogy (Greenland and Rothman, 1998). All
statistical analyses in this report were performed
using the SAS/STAT software, version 6.11 (SAS
Institute Inc., Cary, NC, USA).
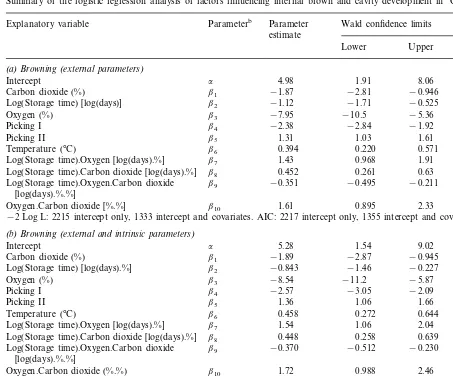
Table 1
Summary of the logistic regression analysis of factors influencing internal brown and cavity development in ‘Conference’ pearsa
Wald confidence limits
Parameter Odds ratio
Explanatory variable Parameterb
estimate
Lower Upper
(a)Browning(external parameters)
a 4.98 1.91 8.06 –
Intercept
Carbon dioxide (%) b1 −1.87 −2.81 −0.946 0.156*
−1.71 −0.525
−1.12 0.321*
Log(Storage time) [log(days)] b2
−7.95
Log(Storage time).Carbon dioxide [log(days).%]
b9
Log(Storage time).Oxygen.Carbon dioxide −0.351 −0.495 −0.211 0.702* [log(days).%.%]
0.895
Oxygen.Carbon dioxide [%.%] b10 1.61 2.33 5.02*
−2 Log L: 2215 intercept only, 1333 intercept and covariates. AIC: 2217 intercept only, 1355 intercept and covariates. (b)Browning(external and intrinsic parameters)
Intercept a 5.28 1.54 9.02 –
−2.87 −0.945 0.155*
Carbon dioxide (%) b1 −1.89
−1.46 −0.227
−0.843 0.432*
Log(Storage time) [log(days).%] b2
−8.54
Log(Storage time).Carbon dioxide [log(days).%] b8
−0.370 −0.512 −0.230
Log(Storage time).Oxygen.Carbon dioxide b9 0.699*
[log(days).%.%]
0.988 2.46
b10 1.72 5.60*
Oxygen.Carbon dioxide (%.%)
Firmness (N) b11 0.0197 0.00448 0.0349 1.021
−0.401 −0.111
−0.257 0.772
b12
Sugar (°Brix)
0.00876
b13 0.00505 0.0122 1.01
Weight (g)
−2 Log L: 2215 intercept only, 1289 intercept and covariates. AIC: 2217 intercept only, 1317 intercept and covariates. (c)Ca6ities(external parameters)
−7.58
Intercept a −6.19 −4.81 –
b1 0.166 0.0743 0.257 1.18*
Carbon dioxide (%)
0.717
Log(Storage time) [log(days)] b2 0.987 1.256 2.68
−0.339 −0.152
−2 Log L: 1939 intercept only, 1307 intercept and covariates. AIC: 1942 intercept only, 1321 intercept and covariates. (d)Ca6ities(external and intrinsic parameters)
−9.70 −6.11 –
Intercept a −7.90
0.0696 0.253
Oxygen.Carbon dioxide (%.%) b6 −0.0679 −0.0134 0.934
0.00216 0.0318
0.0170 1.018
Table 1 (Continued)
Explanatory variable Parameterb Parameter estimate Wald confidence limits Odds ratio
Lower Upper
Weight (g) b8 0.00367 0.000104 0.00723 1.01
−2 Log L: 1939 intercept only, 1298 intercept and covariates. AIC: 1941 intercept only, 1316 intercept and covariates.
aAll variables entered in the models met the 0.05 level of significance. *Not directly interpretable odds ratio. bThe units of the parameter are the reciprocal of the corresponding explanatory variable.
four levels was modelled by performing a logistic regression on the generalized logits. The general-ized logit is defined as:
logitk=log
wherekis 2, 3, 4 (three logits correspond to four
response levels), pik is the proportion of pears in
batch i which developed the kth-stage of the
disorder given a set ofmexplanatory variables,ak
is the intercept parameter of the kth logit, bkj is
the parameter of thekth logit for thejth
explana-tory variable, xij is the value for the jth
explana-tory variable in batchi.
This models implies that there are separate
intercept parameters (ak) and different sets of
regression parameters (bk) for each logit. Instead
of estimating one set of parameters for one logit function, as in logistic regression for a dichoto-mous response variable, sets of parameters for multiple logit functions are estimated. By fitting
Eq. (2) three times (for each value of k) and by
using the fact that the sum of all probabilities is one, it is possible to calculate the probability that a pear belongs to a certain disorder stage.
2.3.2. Dependent and independent 6ariables The absence and presence of the storage disor-der was coded, respectively, with 0 and 1. In the predictive models, the occurrence of internal browning and occurrence of cavities were consid-ered as two separate disorders. However, in real-ity both phenomena are expected to be associated, and therefore a joint model for browning and cavities was constructed. The factor picking date was considered a discrete explanatory variable, which could only take on three values: early, optimal and late. The cell reference coding system
(Agresti, 1996) was used to enter this discrete variable in a regression model. The effect of pick-ing date on the incidence of the disorder was modelled by means of two dummy explanatory
variables, picking I (j=4) and picking II (j=5)
(see Table 1). Both variables can only take value 0 or 1. Eq. (1) becomes
logit(pi)
=a+b1xi1+···+b4xi4+b5xi5+···+bjxij (3)
Assume, for instance, that batch i was picked
early, xi4 and xi5 were coded as 1 and 0,
respec-tively. The contribution of picking date to the
logit(pi) is equal tob4. In the case of the optimal
picking date xi4 and xi5 were coded as 0 and 0,
resulting in no contribution to logit(pi) ofb4+b5.
For the late picking date xi4=0 and xi5=1,
giv-ing a contribution of b5.
The explanatory variables were divided into two groups. The first group contained all the
external variables like storage time, O2 and CO2
concentration, temperature and picking date. The second group contained the intrinsic variables: soluble solids content, firmness, size, weight and colour. For both response variables, brown and cavity, models were built with the external vari-ables and with the varivari-ables of both groups, to investigate whether the addition of intrinsic parameters improved the model.
2.3.3. Model selection criteria
ten data sets and on the complete calibration set a stepwise, a backward and a forward multiple lo-gistic regression procedure was performed. The most important variables were selected automati-cally. Biologically important variables (e.g. tem-perature) were entered manually in the model.
The −2 Log Likelihood statistic (−2 Log L)
and the Akaike Information Criterion (AIC) (Akaike, 1973) were used to compare the models. For both measures, lower values indicate a more
desirable model. Since −2 Log L can only
de-crease when including more explanatory variables, it tends to select models overfitting the available data. The AIC criterion however includes a penalty term for model complexity and therefore is more reliable to select good models (McCullagh and Nelder, 1989).
The odds ratio was used for the interpretation of the influence of the different variables on the storage disorder. The odds ratio, associated with an explanatory variable, expresses by which factor the odds of the event increases or decreases for a
unit increase (e.g. O2concentration increases from
2 to 3%) of a particular explanatory variable, keeping other variables constant. The odds of an event is defined as the ratio of the probabilities of event to non-event and is calculated by exponenti-ating the parameter estimate for the explanatory variable (Agresti, 1996). An odds ratio can range between zero and infinity. A value of 1 indicates that the variable has no influence on the incidence of the disorder. For instance, an odds ratio of 1.5
for the variable O2 indicates that when the O2
concentration is increased with one unit (e.g. from 2 to 3%) the odds corresponding with 2% O2 needs to be multipled by 1.5 to obtain the odds for 3% O2.
3. Results and discussion
3.1. Models for internal browning
3.1.1. External explanatory 6ariables
In general, the picking date, O2 concentration,
CO2 concentration, storage time and temperature
are strongly correlated with the incidence of inter-nal browning. The model parameter estimates, the
95% lower and upper Wald confidence limits for the parameter estimates, and the odds ratios were calculated (Table 1). The picking date is an im-portant variable in the model. Picking I is the first dummy variable. It can discriminate between the early and the other picking dates. A change from optimal to early picking time corresponds to an odds ratio of 0.092, indicating that internal browning occurs about ten times as often (in terms of odds) for optimal picking time than for early picking time. Picking II is the dummy vari-able used to discriminate between the late and the other picking dates. The odds for internal brown-ing increase by a factor 3.7 for the over-mature picked pears compared to the optimally picked ones. Since the picking time is confounded with cooling period preceding the controlled atmo-sphere conditions, further research needs to be carried out to separate both variables. However, the validation results prove that the error made by taking this parameter into the model is moder-ate (see further). An increase in storage tempera-ture by 1°C will increase the likelihood of browning by 50%. Since all the other variables left in the model occur in interaction terms, the inter-pretation of their odds ratios and their coefficients is not straightforward. Not directly interpretable odds ratios are indicated by an asterisk in Table
1. Oxygen, CO2 and storage time, here
trans-formed to log(storage time), interact. The relation
between the O2 concentration and the occurence
of internal browning is always negative in the range of the model, indicating that the odds for
browning increase with decreasing O2
concentra-tion. However, the strength of this relation
depends on the CO2 concentration and the
stor-age time. The parameter estimate for the variable
O2 is a function of the CO2 concentration and
the storage time: −7.95+1.61×CO2 — 0.351×
log(storage time)×CO2+1.43×log(storage time).
Low CO2 concentrations (0 – 1%) and short
stor-age times (a few months), result in a large
nega-tive effect of the applied O2 concentration on
brown development, indicating a high O2
sensitiv-ity of the pears for browning during the first 3 months of storage. The parameter estimates for
CO2 and storage time can be interpreted in an
corre-sponds to more browning. However, this effect is
more pronounced for low O2 concentrations and
long storage times.
Overdispersion was noticed during the analysis. This phenomenon causes underestimation of the variance of parameter estimates. It can be as a result of variation between the response probabili-ties (variation for experimental units observed under the same conditions not explained by the explanatory variables) or correlation between the binary responses (Collett, 1991). In our situation, both causes might explain the observed overdis-persion. To correct for this effect, a heterogeneity factor was estimated (1.409) and introduced into the analysis. This correction resulted in broader confidence intervals.
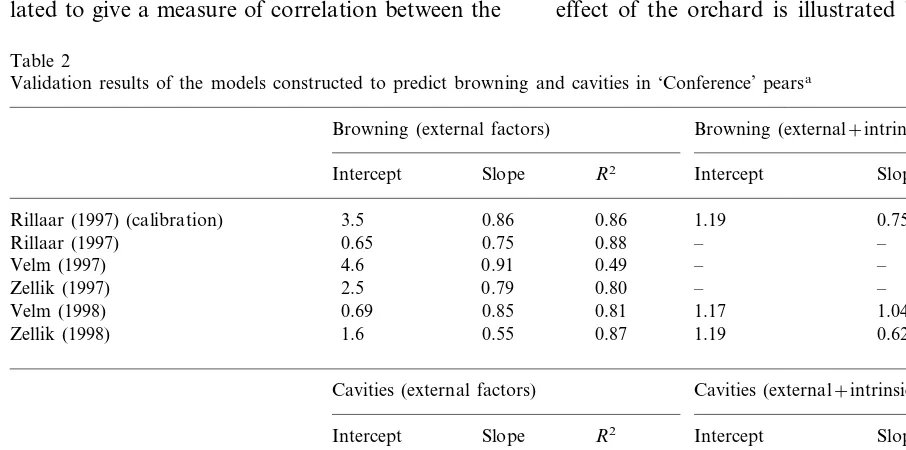
The model was tested for its predictive quality on five validation sets of different orchards and different harvest years. Table 2 shows the inter-cepts and the slopes of the linear regression of the predicted probabilities on the measured probabili-ties of browning for the different validation sets.
The coefficient of determination (R2
) was calcu-lated to give a measure of correlation between the
measured and the predicted values. Theoretically, the slope parameter of the regression line should be equal to one, whereas the intercept should be zero. All validation sets (except for the Velm
orchard in 1997) have a high R2 value, the
inter-cepts of the linear regression curves are small (except for the Velm orchard in 1997) and the slopes of the regression curves are sufficiently close to one (except for Zellik, 1998). The
differ-ences in R2 and slope parameters between the
validation sets are probably a result of factors not included in the model such as orchard, year of harvest, soil type, temperature, rainfall, hours sunshine and quality properties of the fruit. The difference in slope parameter between the Zellik orchard in 1997 and the Zellik orchard in 1998 suggests a bias caused by the harvest year; the pears of this orchard were more susceptible to core breakdown in 1998 than in 1997. The model considerably underestimates the number of brown
pears in 1998 (slope=0.55), but this happens for
each storage condition. The same tendency can be noticed for the Velm orchard over the 2 years: the slope parameter decreases from 0.91 to 0.85. The effect of the orchard is illustrated by a
compari-Table 2
Validation results of the models constructed to predict browning and cavities in ‘Conference’ pearsa
Browning (external+intrinsic factors) Browning (external factors)
Intercept Slope R2 Intercept Slope R2
3.5 0.86 0.86
Rillaar (1997) (calibration) 1.19 0.75 0.92
0.88 0.75
0.65
Rillaar (1997) – – –
– – –
Velm (1997) 4.6 0.91 0.49
– – –
Zellik (1997) 2.5 0.79 0.80
0.81 1.04
1.17 0.81
Velm (1998) 0.69 0.85
Zellik (1998) 1.6 0.55 0.87 1.19 0.62 0.91
Cavities (external factors) Cavities (external+intrinsic factors) Slope R2
Intercept Intercept Slope R2
Rillaar (1997) (calibration) 2.6 0.82 0.90 0.57 0.72 0.87
1.7 0.76 0.90
Zellik (1998) 0.75 4.2 0.94 0.69
Table 3
Classification table for the calibration model for internal browning based on external parameters: sensitivity, specificity and the corresponding number of correctly and incorrectly classified pears are given as a function of the cut-off value
Correct Incorrect
Cut off value Correct (%) Sensitivity (%) Specificity (%)
(%)
No browning Browning No browning Browning
son of Rillaar (1997) and Zellik (1997). The slope parameters are almost the same, but the variabil-ity on the predictions is higher for Zellik (1997) than for Rillaar (1997). Velm (1997) has a good slope but the variability is too high to make good predictions.
The construction of a model based on the or-chards of Velm (1997) and Zellik (1997), makes it possible to study the orchard effect in 1997. An odds ratio of 1.7 was obtained for the orchard factor, indicating that the odds for Zellik is 1.7 times higher than the odds for Velm. A model based on Velm (1998) and Zellik (1998) shows that the orchard factor has an odds ratio of 1.6. This implies a similar orchard effect over both harvest years: pears from Zellik are more suscepti-ble to core breakdown than pears from Velm. The effect of harvest year was studied in an analogue way. A model based on the data sets Velm (1997, 1998) and a model based on the data sets Zellik (1997, 1998) resulted in odds ratios for harvest year of 1.6 and 1.45, respectively. Within one harvest year the orchard effect is more or less constant and the harvest year effect is more or less constant over the different orchards.
Logistic regression models the probability of an event. By using a cut-off value, this probability can be transformed again in presence and absence of the disorder. This is necessary to make classifi-cation tables. However, the choice of the cut-off
value is not easy. A receiver operating curve (ROC-curve) can help in deciding the optimal value. This curve displays the sensitivity in rela-tion to the specificity (Collett, 1991). Sensitivity is a measure of accuracy for predicting events. It is the proportion of event observations that the model predicts to be events for a given probability cut-off value. Specificity is a measure of accuracy for predicting non-events. It is the proportion of non-event observations that the model predicts to be non-events for a given probability cut-off value. The cut-off value selection depends on the purpose of the model. Trying to eliminate almost all pears with browning (e.g. cut-off value 80%) will result in wasting many undamaged pears. Table 3 displays the specificity, the sensitivity and the number of correctly and incorrectly classified observations as a function of the cut-off value. A total of 84% of the pears of the calibration set were classified correctly for a cut-off value of 50%, whereas 82% were classified correctly at a cut-off value of 0.3. For the validation sets, the percentage of correctly classified pears at a cut-off value of 30% ranged between 82% (Rillaar, 1997) and 86% (Zellik, 1997).
esti-mate 1.242 was used to correct for overdispersion. Table 1 summarises the model. This model con-tains all the explanatory variables used in the previous model and is extended with three fruit quality parameters: weight, Magness-Taylor firm-ness and soluble solids content. Pear colour and size, because of its high correlation with weight, did not meet the 5% level of significance to enter the model. Large and heavy pears have a higher
probability for browning (odds ratio=1.009).
Harder pears are more sensitive to internal browning than softer ones: an increase of firmness by 1 N increases the odds of browning with 2.1%. Pears with a higher SSC tend to develop less core breakdown than pears with a lower SSC. Since SSC is positively and firmness negatively corre-lated with time, the coefficient of log(storage time) changes somewhat with the introduction of the intrinsic parameters. The parameter estimates of the other external parameters changed only slightly with the addition of the intrinsic parame-ters, therefore the interpretation of the model is similar to that of the previous model.
In the previous model, the 16 pears per storage condition made it possible to validate the model for the predicted percentages of browning. How-ever, this is not possible in the present model because each pear has a different weight, firmness and SSC. The measured probabilities were calcu-lated by taking all the pears of one storage condi-tion and averaging out the values for weight, SSC and firmness. These probabilities were then used for comparison with the predicted probabilities on internal browning. Validation was only possible on the orchards of Velm in 1998 and Zellik in 1998 since only here intrinsic parameters were measured. The model for core breakdown
(exter-nal parameters) lowers the value of −2 Log L
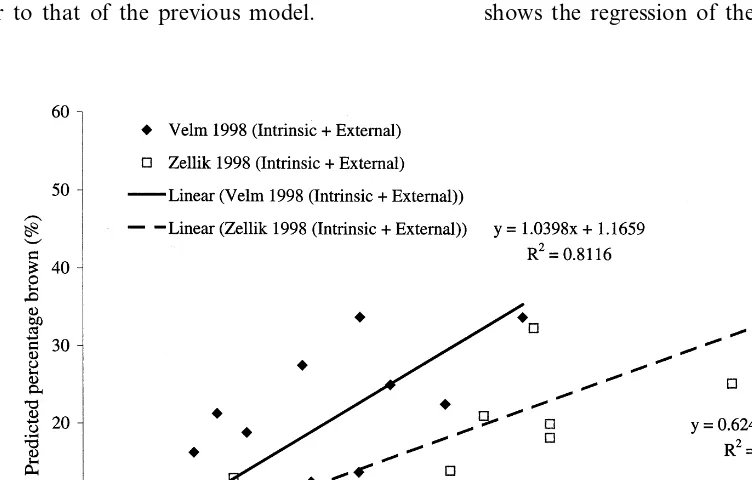
from 2215 to 1333. Inclusion of the intrinsic parameters decreases its value further to 1289, although in the validation this improvement of goodness of fit was not pronounced. Table 2 shows slightly increased slope parameters for the models for browning (orchards Zellik in 1998 and Velm in 1998) with the intrinsic parameters. Fig. 1 shows the regression of the predicted percentages
on the measured percentages of internal brown discolouration. For Velm (1998) the slope is close to one but the variation on the predicted values is larger. Zellik (1998) has a good correlation
be-tween predicted and measured values (R2=0.91),
but the calibration model underestimated the
number of brown pears considerably (slope=
0.62). This bias can only be solved by using a calibration set that contains different orchards and different harvest years.
This model classified up to 85% of the
calibra-tion pears (cut off-value=50%) in the right class.
Depending on the specificity and the sensitivity requirements, 80 – 84% of the validation pears were classified correctly. Again a compromise has to be found between sensitivity and specificity depend-ing on the purpose for which the model is used. The practical usefulness of including variables such as SSC and firmness is doubtful, because both variables were measured destructively. Their importance would increase if non-destructive tests could be used to predict firmness and SSC. Inclu-sion of preharvest factors such as hours of sun-shine, rainfall, age of the trees, soil composition,
etc., and of intrinsic factors such as vitamin C (Veltman et al., 1999) concentration before storage should improve the prediction performances of the model.
3.2. Models for ca6ities
3.2.1. External explanatory6ariables
Parameters for the cavity model (heterogeneity
factor=1.271) were identified (Table 1).
Over-ma-ture picked pears are four times more susceptible to cavity development, whereas early picked pears have ten times less probability of the disorder, compared to optimally picked pears. Only one
interaction term, between O2and CO2entered the
model. Fig. 2 shows the validations of this model on Zellik (1997, 1998). Both regression curves
have a slope parameter close to one and a goodR2
value (Table 2). However, the variability is higher for Zellik (1998) than for Zellik (1997). The vali-dation results of the other orchards are listed in Table 2. The model classifies from 80 to 87% of the pears correctly, depending on the choice of the cut-off value, the orchard and the year of harvest.
Fig. 3. Occurrence of the different stages of core breakdown disorder (%) as a function of the storage time (all storage conditions are summed to construct this plot).
3.2.2. External and intrinsic explanatory 6ariables The intrinsic fruit parameters weight and firm-ness are entered in the model (Table 1). An increase in firmness of 1 N results in an increase in odds ratio of 1.8%. The odds ratio for weight equals 1.004. The other parameter estimates did not change much by the addition of the intrinsic parameters:
storage time and CO2concentration have a positive
and the O2 concentration a negative relation to
cavities. Since the −2 Log L value only decreases
with 9 units, the addition of the intrinsic parameters did not improve the model considerably. This can also be seen from the validation results (Table 2), which are comparable to those of the model pre-sented in part 2.1. For this model a heterogeneity factor of 1.114 was applied. The prediction perfor-mance of the model lies between 80 and 86% of correct classification, dependent on validation set and cut-off value.
3.3.Joint models for internal browning and ca6ities
To study the hypothesis that internal browning is followed in time by the development of cavities, and thus both are symptoms of core breakdown
4. Conclusion
Logistic regression models were built to detect the factors influencing core breakdown disorder. The statistical analyses show that the probability of pear disorders depends on several intrinsic and external variables in a more complicated way than assumed before. In general, a higher CO2, a
longer storage time and a low O2 concentration
will result in more browning and cavities. Over-mature picked pears are far more susceptible to
core breakdown. Inclusion of the intrinsic
parameters improved the models slightly, but in reality the prediction performance did not change much. Heavy pears will develop more cavities and internal browning than lighter pears and hard pear tissue favours the development of the disorder.
The models were also used to do predictive modelling. Depending on the cut-off value, the harvest year and the orchard, the classification performances varied between 80 and 88%. In the future more research will be needed to include preharvest factors such as hours of sunshine, age of the trees, soil composition, etc., and intrinsic factors like vitamin C concentration at storage, into the model. This information will probably improve the predictive performance of the mod-els. A logistic regression on the generalized logits was performed, which supported the hypothesis that browning disappears in favour of cavities: a pear will first develop brown spots, which become larger in time and later on disappear while cavities are formed.
Acknowledgements
This research was financially supported by the Flemish Government and the Ministry of SME and Agriculture (MVLM-D12-5771A) and the European Communities (FAIR-project CT96-1803). Jeroen Lammertyn is Aspirant with the Flanders Fund for Scientific Research (FWO Vlaanderen). The authors would like to thank Lies Baten, Jurgen Schoevaerts and Jeroen Tirry for their assistance during the experiments.
References
Agresti, A., 1996. An Introduction to Categorical Data Anal-ysis, second ed. John Wiley & Sons, New York. Akaike, H., 1973. Information theory an extension of the
maximum likelihood principle. In: Petrov, B.N., Csa`ki, F. (Eds.), Second International Symposium on Inference The-ory. Akade´miai Kiado, Budapest, pp. 267 – 281.
Boersig, M.R., Kader, A.A., Romani, R.J., 1988. Aero-bic-anaerobic respiratory transition in pear fruit and cul-tured pear fruit cells. J. Am. Soc. Hortic. Sci. 113, 869 – 873.
Brady, C.J., Romani, R.J., 1988. Respiration and protein synthesis in nongrowing cultured pear fruit cells in re-sponse to ethylene and modified atmosphere. Plant Phys-iol. 87, 571 – 576.
Chavez-Franco, S.H., Kader, A.A., 1993. Effects of carbon dioxide on ethylene biosynthesis in ‘Bartlett’ pears. Postharvest Biol. Technol. 3, 183 – 190.
Collett, D.R., 1991. Modelling Binary Data. Chapman and Hall, London.
Greenland, S., Rothman, K.J., 1998. Modern Epidemiology. Lippincott Williams & Wilkins Publishers, Philadelphia. Hosmer, D.W., Lemeshow, S., 1989. Applied Logistic
Regres-sion. Wiley, New York.
Kadam, S.S., 1995. Pear. In: Salunkhe, D.K., Kadam, S.S. (Eds.), Handbook of Fruit Science and Technology. Marcel Dekker Inc., New York, pp. 183 – 202.
Kader, A.A., 1989. Mode of action of oxygen and carbon dioxide on postharvest physiology of ‘Bartlett’ pears. Acta Hortic. 258, 161 – 167.
Ke, D., van Gorsel, H., Kader, A.A., 1990. Physiological and quality responses of ‘Bartlett’ pears to reduce O2 and
enhanced CO2levels and storage temperature. J. Am. Soc.
Hortic. Sci. 115, 435 – 439.
Kerbel, E.L., Kader, A.A., Romani, R.J., 1988. Effects of elevated carbon dioxide concentrations on glycolysis in intact ‘Bartlett’ pear fruit. Plant Physiol. 86, 1205 – 1209.
Larrigaudiere, C., Lentheric, I., Vendrell, M., 1998. Relation-ship between enzymatic browning and internal disorders in controlled atmosphere stored pears. J. Sci. Food Agric. 78, 232 – 236.
Lentheric, I., Pinto, E., Vendrell, M., Larrigaudiere, C., 1999. Harvest date affects the antioxidative systems in pear fruits. J. Hortic. Sci. Biotech. 74, 791 – 795.
Mathooko, F.M., 1996. Regulation of respiratory metabolism in fruits and vegetables by carbon dioxide. Postharvest Biol. Technol. 9, 247 – 264.
McCullagh, P., Nelder, J.A., 1989. Generalized Linear Mod-els, second ed. Chapman and Hall, London.
Roelofs, F.P., de Jager, A., 1997. Reduction of brownheart in ‘Conference’ pears. In: Mitcham, E. (Ed.), Proceedings Volume 2: Apples and Pears, 138 – 144. Controlled Atmo-sphere Research Conference, July 13 – 18, 1997. University of California, Davis, USA.
Veltman, R.H., Sanders, M.G., Persijn, S.T., Peppelenbos, H.W., Oosterhaven, J., 1999. Decreased ascorbic acid lev-els and brown core development in pears (Pyrus communis L. cv. Conference). Physiol. Plant. 107, 39 – 45.
Wills, R., McGlason, B., Graham, D., Joyce, D., 1998. Postharvest: an Introduction to the Physiology and Han-dling of Fruit, Vegetables and Ornamentals. Hyde Park Press, Adelaide.