Design and Implementation of Support Vector Data Description
for the Detection of Diabetic Type II
Yugowati Praharsi and Shaou-Gang Miaou
Department of Electronic Engineering, Chung Yuan Christian University
Abstract
Support Vector Data Description (SVDD) is a classification method that can be used for novelty or outlier detection. In this paper we design and implement a SVDD technique for detecting diabetic data type II as outliers. By changing the ball-shaped boundary for the outlier sensitivity, we find an efficient/compact description with the target accepted rate being 94%, outlier rejected rate being 92%, and 2-fold cross validation error being 6.86%. It can be expected that SVDD can be used in the real application of detecting diabetic.
Keywords: support vector data description, 2-fold cross validation error, diabetic type II.
I. INTRODUCTION
Data description and classification is an interesting and important task which is applied widely. There are various methods commonly used in grouping data such as K-means and Principal Component Analysis. These common methods have several drawbacks such as the problem of low recognition accuracy and the problem caused by introducing a new class, which will affect the whole clustering [1]. Support Vector Data Description (SVDD) is a new mode of Support Vector Machine (SVM) that can be used for novelty or outlier detection [2]. SVDD considers the clustering as the reorganization of samples. It can minimize the problem in introducing a new class. Moreover, introducing a new class in SVDD does not require new retraining.
A major benefit of data description is that it can be used for a classification problem where one of the classes is sampled very well, while the other class is severely under sampled. An example of this is detecting a glucose level in the blood. An alarm is raised when the glucose level is higher than 120 mg/dl for fasting time and 140 mg/dl
after meal. Measuring blood glucose level on the normal condition is cheap and easy to obtain. On the other hand, measuring outliers would require the oral glucose tolerance test and this can be very expensive. The problem can be solved by using a method that mainly use target data, and does not require representative outlier data, such as SVDD.
In this paper, we proposed a method to obtain a spherically shaped boundary around the complete target set with the same flexibility. To minimize the chance of accepting outliers, the volume of this description is minimized.
This remaining paper is organized as follows. The basic method that is used in the experiment is introduced in Section 2, the design and implementation is described in Section 3, experimental result is presented in Section 4 and conclusions are given in Section 5.
II. SVDD
The main idea of SVDD is to find minimum hyper-sphere consisting all the objective samples and placing the non objective samples outside the sphere [1]. The purpose of data description is to give a compact description of the target data that represents most of its characteristics [3]. SVDD will produce a closed boundary, hyper-sphere, around the data [2][4]. The sphere is characterized by a center a and a radius R > 0. Minimizing the volume of the sphere is done by minimizing R2.
The error function to minimize the sphere is defined by:
∑
= += N
i i
C R a R F
1 2
) ,
(
ξ
(1)with the constraints:
i R
a
xi − ≤ + i, ∀
2 2
ξ
(2)i
i
≥
0
,
∀
ξ
where ξi is a slack variable, is training objects, and N is total number of training objects. The variable is set to ξ
i
x
i ≥ 0 in order to allow the possibility of outliers in the training set. The
parameter C (punish factor) is used to controls the trade-off between the volume and the errors. The variables R,
ξ
i, a, are obtained using theand then substituting to the Lagrangian Q, we obtain the dual problem of SVDD :
Maximize L = ( )
In the case of Nonlinear SVDD, e.g. applying in banana shape data to produce tight boundary, the problem can be formulated by:
Maximize L = ( , )
For the Radial Basis Function (RBF) Kernel function:
The problem becomes:
Maximize ( , ) (6)
This kernel is independent of the position of the data set with respect to the origin; it only utilizes the distances between objects.
For a testing data z, it is accepted if:
III. DESIGN AND IMPLEMENTATION
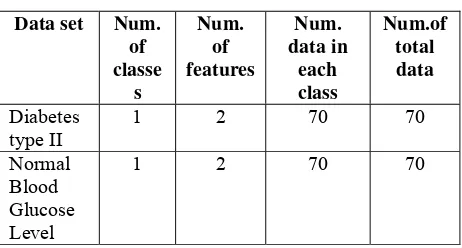
The data used in the research is diabetes type II which comes from the UCI Machine Learning Database [5]. The data representing the level of blood glucose in fasting time and bed time for 7 days. In those two features, fasting time is condition of person that does not eat anything for 12 hours. Bed time is condition of person that eats something during a period of 12 hours/a half day. It is based on Szu conjecture [6] that the wellness period is daily of which Nyquist minimum sampling rate must be 12 hours, in order to avoid the aliasing effect to capture the transition from wellness to illness.
The normal blood glucose level is sourced from [7]. Fasting level for normal blood glucose level is in the range of 80-120 while bed time is in the range of 100-140. Each feature consists of two features, and every data set is consisting of 70 instances.
The feature of the data used in the experiment is described in Table 1.
Table 1: Data for the Evaluation of the Data Description Method
Data set Num.
The performance of classifier is evaluated using the confusion matrix.
Predicted class
The True Positive (TP) is target accepted as target data. The False Positive (FP) is target accepted as outlier. The True Negative (TN) is outlier accepted as outlier. The False Negative (FN) is outlier accepted as target data.
3
The evaluation methods that are used:TPrate =
FN TP
TP
+
TNrate =
FP TN
TN
+
Precision =
FP TP
TP
+
Recall =
FN TP
TP
+
Accuracy =
FN FP TN TP
TN TP
+ + +
+
TPrate or recall is the proportion of the target data that were correctly identified. TNrate is the proportion of outliers that were correctly rejected. Accuracy is the degree of closeness of actual data to the training data.
In this research, evaluation is done using 2-fold cross-validation. In 2-2-fold cross validation, the training set is divided into 2 subsets of equal size that it can be seen in Table 2. Sequentially one subset is tested using the classifier trained on the remaining subset. Thus, each instance of the whole training set is predicted once so the cross validation accuracy is the percentage of data that are correctly classified. A grid-search on C and s is set using cross-validation. Basically pairs of (C, s) are tried and the one with the best cross validation accuracy is picked.
Table 2: The Training and Testing Sample
Testing Set Training Set
Target Objective Target Objective
Outlier Objective Normal Blood
Glucose Level
Normal Blood Glucose Level
Diabetes type II
The flowchart for the testing data is presented in figure 2.
The value of target accepted (TP), outlier rejected (TN), 2-fold cross validation error, standard deviation (stdv), and number of support vector (nsv) are obtained by changing the input of
s (parameter of kernel function) and C (parameter of weight factor) and by testing some functions in the process diagram.
Figure 2: Flow Chart of Main Program
IV. EXPERIMENT AND RESULTS
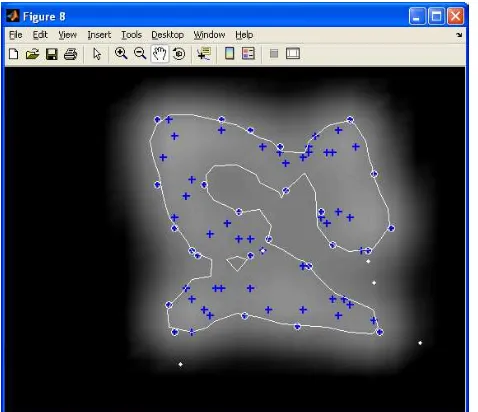
The experiment result is presented in Figure 3. From Figure 3, it can be seen that large error occurs in the smallest and the largest value of s. The lowest error of 2-fold cross validation is 6.86% and the target accepted rate is 94% and outlier rejected rate is 92%. More details about evaluation results are in Table 3. This is achieved when s is set to 10 and C is set 0.6. The boundary produced from the setting is described in Figure 4.
By the grid-search on C and s using 2-fold cross-validation error, the method proposed in this research performs well. It can divide the objective sample and the outlier with high accuracy (93%). It is very likely that SVDD can be used in the application of detecting diabetic.
Table 3: Evaluation Results of SVDD Classifier when s = 10 and C = 0.6
TPrate 94%
TNrate 92%
Recall 94% Accuracy 93%
4
gure 3: 2-Fold Cross Validation Error in SeveraFi l
Combination s and C
Figure 4: Data Descripti n Trained on a Banana
V. CONCLUSIONS
this paper we proposed a design of suppo
ACKNOWLEDGEMENT
I would like to thank to Prof. Harold Szu and
REFERENCES
] R. Ji, D. Liu, M. Wu, and J. Liu, "The
[2] pport
[3] and D.
1
[4] pport
[5] Glucose Level of Diabetic Types II,
[6] ng, Y. S. Tsai, S. G. Miaou, W.
[7] abetes: Blood Test to Help You o
Shaped Data Set with Outliers. Support Vectors are Indicated by the Solid Circles, the White Line is the Description Boundary.
In
rt vector data description to detect diabetic data type II as outlier. The design is intended to distinguish objective samples and the outlier from the diabetic type II. The 2-fold cross-validation showed that the lowest error is 6.86%, the target accepted rate is 94 % and the outlier rejected rate
is 92%. It can be expected that SVDD can be used in the real application of detecting diabetic.
Prof. Yi-Hung Liu for their support, encouragement, and guidance in this research.
[1
Application of SVDD in Gene Expression Data Clustering," In Proc. of the 2nd Int. Conf. on Bioinformatics and Biomedical Engineering, pp. 371-374, May, 2008. D. M. J. Tax and R. P. W. Duin, "Su Vector Data Description," Machine Learning, vol. 54, pp. 45-66, 2004.
K. Y. Lee, D. W. Kim, K. H. Lee,
Lee," Density-Induced Support Vector Data Description," IEEE Trans. on Neural Networks, vol. 8, pp. 284-289, 2007.
D. M. J. Tax and R. P. W. Duin, "Su Vector Domain Description," Pattern Recognition Letter, vol. 20, pp. 1191-1199, 1999.
"Blood
UCI Repository of Machine Learning Databases."
D. W. Y. Chu
H. Chang, Y. J. Chang, S. C. Chen, Y. Y. Hong, C. S. Chyang, Q. S. Chang, H. Y. Hsu, J. Hsu, W. C. Yao, M. S. Hsu, M. C. Chen, S. C. Lee, C. Hsu, L. Miao, K. Byrd, M. F. Chouikha, X. B. Gu, P. C. Wang, and H. Szu, "Noninvasive Methodology for Wellness Baseline Profiling," In Proc. of SPIE, vol. 6576, pp. 65760R1-65760R17, 2007.
-, "Di


