Cameroon Bilingualism Test Comparison Study Report
Compiled by Marie C. South
Contents
Abstract
1 Outline of the Report
1.1 Goals and Objectives of this Report 1.2 Summary of Results and Conclusions
1.2.1 Relationship Between SRT and SLOPE 1.2.2 Relationship Between RPE and SLOPE 1.2.3 Relationship Between RPE and SRT 1.2.4 Overall Conclusion
2 Outline of the Trial
2.1 Background
2.2 Goals and Objectives of the Trial 2.3 Instruments Being Tested
3.1 Structure of the Dataset Produced 3.2 Data Entry and Cleanup
4 Primary Data Exploration and Analysis 4.1 Relationship Between SRT and SLOPE
4.1.1 Preliminary SRT and SLOPE 4.1.2 Final Form SRTs and SLOPE 4.2 Relationship Between RPE and SLOPE 4.3 Relationship Between SRT and RPE
4.3.1 Preliminary SRT and RPE 4.3.2 Final Form SRTs and RPE
4.4 Relationship Between Preliminary and Final Form SRTs 4.5 Further Analyses
5 Conclusions and Recommendations 5.1 Conclusions From This Study
5.1.1 Relationship Between the Three Test Instruments 5.1.2 Relationship Between Preliminary and Final Form SRTs 5.1.3 Choice of Sentences for Final Form
5.2 Recommendations to Users of the SRTs Developed During this Study 5.3 Recommendations for Further Research
5.4 Some Practical Recommendations for Those Conducting Further Research Appendix 1 – Variables in Data Set
Appendix 2 – Raw Data: Test Results
Appendix 3 – Discrimination Index and Difficulty Levels Appendix 4 – Guidelines for Data Entry
Appendix 5 – Guidelines for Data Cleanup Appendix 6 – A Brief Description of RPE Levels Appendix 7 – Correlation and Regression Analyses
Abstract
This report presents findings of a study conducted in Cameroon in May/June 1991, comparing the performance of three methods of testing for bilingualism. The three test methods under study are SLOPE (Second Language Oral Proficiency Evaluation), SRT (Sentence Repetition Test), and RPE (Reported Proficiency Evaluation). The nature of the relationships between these test methods is explored, and some recommendations and conclusions are given.
This report, compiled in 2001 by Marie C. South, draws from the following two earlier reports. The Cameroon Study: A Comparison of Second Language Proficiency Testing Methods by Deborah Hatfield, Carla Radloff, Ted Bergman, Marie South, Barrie Wetherill (presented at the International Language Assessment Conference, Horsleys Green, England, 1993), and Report on the Cameroon Trial of Bilingualism Assessment Methods, May– June 1991, by G. Barrie Wetherill and Marie C. South.
1
Outline of the Report
1.1 Goals and Objectives of this Report
The goal of this report is to present the findings of the study conducted in Cameroon in May/June 1991 which compared the performance of three methods of testing for bilingualism. The study has been generally referred to as "BITECOSTUG"—"Bilingual Test Comparison Study Group"—an acronym attributed to Juerg Stalder and Sue Hasselbring. The three test methods under study, described in section 2.3, are referred to as SLOPE (Second Language Oral Proficiency Evaluation), SRT (Sentence Repetition Test), and RPE (Reported Proficiency Evaluation). In this report, the nature of the relationships between the results generated using the three different methods are explored. In particular, the value and the limitations of the SRT to predict results obtained using the other two test methods are assessed. Some investigations into the way the SRT is developed and used are also presented.
Section 2 describes how the trial was carried out and why. Section 3 describes the data generated. Section 4 assesses the results. Section 5 draws together the conclusions and recommendations arising from the analysis.
1.2 Summary of Results and Conclusions
1.2.1 Relationship Between SRT and SLOPE
Figures 2 and 3 (in section 4) show that the relationship between SRT and SLOPE is strongly curved. The final form SRTs selected in this study were able to discriminate individuals at lower levels of SLOPE, but were not able to discriminate between upper levels. If a person obtained a low score on the SRT (<30), then it followed that they had a lower SLOPE rating (< 3); if a person obtained a high score on the SRT (>35) they were most likely to have a higher SLOPE rating (>= 3), but for those people having intermediate scores on the final form SRTs A and B (30–35), it was not possible to confidently predict their SLOPE rating. The majority of observations were at SLOPE levels 2 through 3+, whereas we really needed more observations at the extremes.
1.2.2 Relationship Between RPE and SLOPE
Figure 4 shows that the relationship between SLOPE and RPE in this study is strongly curved. There was found to be a disappointing amount of scatter in the RPE levels for any given SLOPE level, even after results for two of the RPE raters were discounted. This may have been a feature of the way RPE was applied (out of necessity) in this situation. It was not possible to reliably predict the distribution of SLOPE scores from the RPE scores in this study.
1.2.3 Relationship Between RPE and SRT
Due to the scatter noted above, the relationship between RPE and SRT was weaker than has been seen in other studies. Previous studies have shown an approximately linear relationship, with correlations in the region of 0.9 (Radloff 1991). In this study, high variability and some curvature in the relationship made correlation and
1.2.4 Overall Conclusion
Due to the sensitivity of these test methods to the “raters” being used and the linguistic constraints which applied at the time of test development, one should be cautious when applying these test methods and interpreting the results. The SRT appears to be a very useful screening tool, separating those with low linguistic ability in the language under test (SLOPE < 3 in this study) from those with higher levels of bilingualism. In this study, we could not discriminate between people having different higher levels of linguistic ability.
2
Outline of the Trial
2.1 Background
Sociolinguistic surveys are often carried out within SIL in order to make language planning decisions. One of the research questions frequently addressed is the extent to which a particular speech community is proficient in a second language (L2) of wider communication, e.g., an official, national, or regional language. In order to
adequately describe the levels of L2 proficiency in a speech community, a large number of people must be tested. One method proposed for this purpose is a Sentence Repetition Test (SRT). After an SRT is developed for a given language, including calibration by an independent L2 proficiency measure, and training has been completed for the administrators of the SRT, the SRT can be given and scored in approximately five minutes per testee.
Since 1963 various forms of sentence repetition tests have been used in many studies in second language acquisition research (see Radloff 1991 for a review of the literature). Particularly related to the present study, SIL researchers have developed SRTs for a number of languages—Pashto and Urdu (Radloff 1991), Indonesian (Andersen 1993), Lingala (Phillips 1992), Sango (Karan 1992), Tamil (O'Leary 1993, personal communication), and three other South Asian languages (Varenkamp 1993). These researchers have used the Reported Proficiency Evaluation (RPE) to calibrate the SRT. With this technique individuals who are first-language (L1) speakers of the test language are asked to rate the language abilities of several of their acquaintances who speak the test language as a second language.
High correlations have been obtained between these reported proficiency evaluations of L2 speakers and their scores on the SRT (e.g., r = .90635 for the Pashto SRT). However, high correlations do not necessarily indicate validity, and some questions have arisen concerning the validity and reliability of the RPE (Radloff 1991, Grimes 1989).
One of the problems in Cameroon is the linguistic complexity of the country. In all there are 271 separate
languages, many of which do not have a written form. There are two major languages—French and English—but a large percentage of the population has little or no capability in these, and thus a French SRT may prove very useful in assessing L2 proficiency in many speech communities within Cameroon.
The oral proficiency interview (OPI), using proficiency levels as defined by the (Federal) Interagency Language Roundtable (ILR), is generally considered to be the most valid measurement of L2 proficiency. (The OPI used by the ILR is the most widely known one, although other forms have been developed.) The Second Language Oral Proficiency Evaluation (SLOPE) is an OPI adapted from the ILR and designed for use in assessing the L2 proficiency of preliterate as well as literate individuals (SIL 1987).
The various questions which have been raised concerning the use of the SRT, the RPE, and SLOPE, together with the need for L2 evaluation within Cameroon, led to the study under consideration here.
2.2 Goals and Objectives of the Trial
Some subsidiary objectives were:
a. A comparison of the results of testees who took the SRT more than once, to see if there was a potential learning effect.
b. A comparison to see how well the two SRTs developed during the study predicted SLOPE and RPE results. Could they distinguish clearly between some or all assigned proficiency levels?
2.3 Instruments Being Tested
2.3.1 SLOPE
The USA Foreign Service Institute (FSI) developed an Oral Proficiency Test (FSI 1986), and this is considered by many to be the most valid method of testing bilingualism. Bruhn (1989) addressed criticisms of the method. The test assumes participants to be literate and hence the method has been adapted for use in preliterate societies and for the situation where the linguist may not know the languages being used in the testing (SIL 1987). This adapted version, the Second Language Oral Proficiency Evaluation, or SLOPE, involves an interview of about forty-five minutes, conducted by a specially trained linguist with the help of an assistant speaking the testee's mother tongue (L1). The testee is assessed in the areas of comprehension, discourse competence, structural precision, lexicalization, and fluency. An appropriate proficiency level is then awarded.
Thea Bruhn of the FSI trained the three SIL members (Juerg Stalder, Ruth (Nussbaumer) Stalder, and Phil Davison) who participated as "linguists" in the SLOPE evaluations in this study. The training included: viewing videos of oral proficiency interviews and evaluation sessions from FSI; making and reviewing videos of practice sessions with Cameroon SIL members and Cameroonians; listening to audio tapes of both, and intervention in the evaluation process by the trainer. At the end of three weeks of training, Bruhn concluded that none of the three "linguists" could give adequate evaluations on their own, but that they could by working together. Therefore, the three "linguists" were present for all of the SLOPE evaluations. When there was disagreement, the majority opinion was taken. Sometimes the initial SLOPE score was modified if it was felt that it led to an inappropriate level.
Another modification of recommended SLOPE procedures was that an "assistant" was used in only one evaluation session. First of all, the "linguists" and Thea Bruhn judged the presence of an "assistant" with whom the testee would interact in his/her L1 to be an unnatural situation with high proficiency speakers. They decided not to use an "assistant" if the testee was above RPE level 2+. It was sometimes difficult to find speakers of the same language who could serve as "assistants." In spite of the decision related to the 2+ RPE level, the end result was that an "assistant" was only used once.
The final modification was that the "testers" were not L1 speakers of French, as in recommended procedures. Again, due to the sociolinguistic situation, we used highly proficient L2 speakers who could meet the same criteria as for the RPE raters (see following section).
2.3.2 RPE
Although SLOPE is an adaptation of a well-validated method, the time and costs involved are prohibitive. It is not really suitable for widespread use: some would even say it is impossible in a rural setting. Another method has been developed known as the Reported Proficiency Evaluation, RPE. This is described by Radloff (1991). The method involves L1 speakers of the language under consideration acting as raters to assess the proficiency levels of L2 speakers known to them. The raters are asked to choose acquaintances whom they know well and with whom they communicate in the test language. A trained fieldworker interacts with them to arrive at RPE levels for the ratees (Radloff 1991). A brief description of the RPE levels is given in appendix 6.
The sociolinguistic situation in Cameroon is such that there are few Cameroonians who speak French as their L1. Therefore, we were forced to use French L2 speakers as RPE raters. The criteria we established for RPE raters for this study were:
• the rater was from the Francophone area of Cameroon;
This practice of using proficient L2 speakers as RPE raters was also used previously in the case of Lingala (Phillips 1992), due to Lingala being a pidgin, only now becoming a Creole.
Another departure from recommended procedures in Cameroon was that, due to the political situation in Cameroon at the time of the study, we were unable to use Cameroonian fieldworkers. Instead SIL members served as fieldworkers. This made it more difficult to find the required number of RPE raters.
Due to the political situation in Cameroon at the time of the study, we had to do the research in the capital, Yaoundé, and use SIL members instead of Cameroonians as fieldworkers. This gave rise to two difficulties. It was hard to find the required number of RPE raters and hard to find speakers with low proficiency in French.
2.3.3 SRT
The third test, developed by Radloff (1991), is the Sentence Repetition Test or SRT. The test involves asking the subject to repeat (usually fifteen) sentences in the test language, and the responses are scored. The hypothesis underlying the SRT is that there is a consistent relationship between the ability to repeat something and the degree of bilingual proficiency one has. Previous results have shown a high correlation between SRT and RPE evaluations (Radloff 1991, Andersen 1990, personal communication). Moreover, the SRT is simple and quick to administer and is well suited to use in developing countries. In this study, the sentences for the two “Final Form” SRTs (SRT A and SRT B) were chosen from a 63-sentence preliminary SRT on the basis of the Discrimination Index and the Difficulty Level of each sentence, as used in the development of other SRTs (Radloff 1991; see appendix 3). There was a discussion about how the SRT should be scored in this study, and it was agreed that the scoring used should be “strict” with one point off for word order, agreeing with the SRT manual.
2.4 Research Team
Many researchers were involved in the study. Carla Radloff was invited to participate in the project because of her experience with the development of the SRT and RPE while on the SIL South Asia Survey team and her
extensive research of these instruments. Thea Bruhn, Head of the Language Testing Unit of the Foreign Service Institute (FSI) of the United States Department of State was invited to ensure rigorous adherence to proper SLOPE administration. Prof. Barrie Wetherill, retired head of the Industrial Statistics Unit of the University of Newcastle-upon-Tyne, was invited along with one of his doctoral students, Marie South, to assist with
experimental design and subsequent analysis. The SIL Cameroon survey team consisted of Juerg Stalder (team leader), Kelly Bagley, Rosalind (Bebb) Bagwell, Phil Davison, and Ruth (Nussbaumer) Stalder. They were assisted by members of the Cameroon "Centre de Recherches et Études Anthropologiques" (CREA)—Etienne Sadembouo, Englebert Domche-Teko, and M. Bitja. Others participating in various ways included Deborah Hatfield from SIL Togo/Benin, Elisabeth Phillips from SIL Congo, Mark Karan from SIL Central African Republic, and Ted Bergman, SIL Task Assessment Coordinator, Africa Area, who instigated the study.
2.5 Study Design
2.5.1 Phase I
The study was conducted in 2 phases. In Phase I, the goal was to prepare two sets of fifteen French sentences to be recorded in Cameroonian French. These two “Final Form SRTs,” A and B, were then to be compared with results from RPE and SLOPE in Phase II.
Phase I was scheduled to take three weeks in total. The first week was to be used for training and the second two for completing the Phase I work. In Phase I the following steps were planned in accordance with procedures described by Radloff (1991).
1. Preparation of the preliminary SRT: with the aid of educated L1 speakers of French, collect sixty to sixty-five sentences of varying complexity as possible sentences for the final form fifteen-sentence SRTs A and B. The most complex sentences should be capable of challenging and distinguishing between higher proficiency L2 speakers.
2. Record and transcribe the sentences both for French French and Cameroonian French, and establish scoring standards.
3. Conduct RPE ratings on fifty to sixty Cameroonian French L2 speakers representing the full range of RPE levels, and administer the preliminary SRT to the fifty to sixty subjects.
5. Record the two sets in Cameroonian French for Phase II and calibrate using RPE
It was felt that two sets are needed in practice since it would bias results to use the same set of sentences on people who had just listened to someone else being tested.
2.5.2 Phase II
The goal of this phase was to compare the three methods, by giving sixty to seventy Cameroonian French speakers the two final SRTs and also assessing them using SLOPE and RPE. The intention was to continue testing in Phase II until all the major and minor SLOPE levels were represented, using additional subjects, probably from Phase I so that the RPE level was already known.
Approximately half the Phase II subjects had participated in Phase I. These subjects, in addition to scores on SLOPE, RPE, and the final short-form SRTs, would have “extracted scores” for each of SRTs A and B, calculated by adding the scores they obtained on the preliminary SRT for those sentences later included in SRTs A and B. By comparing the extracted scores with scores achieved when taking the final form SRT tests, we can see whether the extracted scores reflect accurately the scores achieved when actually taking the shortened forms. It may be that factors such as fatigue, or learning as the tests proceed, could cause the extracted scores to be lower than the actual scores. The fact that they have taken the long SRT may also affect their attitude and hence performance in the SLOPE test.
Approximately half were to be "new" subjects, i.e., had not taken the Preliminary SRT, and these new subjects would in addition require RPE ratings. This is to give us an independent assessment of the relationship between SLOPE/RPE and SRT scores for a group other than the group used in the development of the tests.
Phase II was designed to take three to five weeks. The following steps were involved:
1. Training sessions on SLOPE for the "testers" and "linguists" 2. RPE ratings for the "new" subjects (those not in Phase I)
3. Sixty to seventy Cameroonian French L2 speakers (some of whom had taken preliminary SRT) tested using the two final SRTs and SLOPE, the three tests being presented in random order. This is so that if there is a learning factor, with performance improving over time as test-taking skills improve, or if there is deterioration over time, e.g. due to fatigue, then such effects will be balanced out across all of the tests and will not influence our assessment of the relationship between them.
2.6 Final Study Layout
In Phase I, the preliminary SRT comprised sixty-three sentences, selected with the assistance of educated L2 speakers of French. Forty-eight Cameroonians living in and near Yaoundé were rated using the preliminary SRT and the RPE. Since four subjects only took the preliminary SRT after the sentences for the Final Form SRTs A and B were selected, scores for only forty-four subjects were used in the selection process. Of these forty-four subjects, twenty-nine also participated in Phase II and received SLOPE evaluations and were tested using SRTs A and B. Of the additional four subjects who took the Preliminary SRT later, two were also evaluated by SLOPE and SRTs A and B. Hence, there were in total thirty-one subjects who had scores for RPE, SLOPE, the
preliminary SRT, and final form SRTs A and B. There was a lack of subjects at the lower and at the very high proficiency levels, despite extensive efforts to try and correct this.
A further thirty-two subjects had SLOPE and SRT A and B evaluations in Phase II, with thirty-one of these having RPE evaluations. This makes a total of sixty-two subjects having SLOPE and RPE results. However, fourteen of these subjects, all in Phase II only, had their RPE evaluations by raters twelve or fifteen. The results from these two RPE raters were not included in the final analysis (see section 3.2). This left forty-eight subjects who took Final Form SRTs A and B, and who had both RPE and SLOPE evaluations.
Owing to unexpected difficulties in Yaounde, the study took considerably longer than expected. Phase 1 scheduled to take three weeks took five weeks, and Phase 2, scheduled to take three to five weeks took six weeks.
2.7 Analyses
scatter in some of the data. The ranges calculated from regression are therefore presented in appendix 7 for information only.
3 Data
3.1 Structure of the Dataset Produced
Appendix 1 lists the variables observed. The key variables used in the analysis are:
rraw: the RPE raw score
rlev: the RPE level
sraw: the SLOPE raw score
slev: the SLOPE level
psenXX: sentence results on sentence XX from the preliminary SRT psvs1: the total scores on the preliminary form SRT
srttsa1: the score on SRT set A ) Final SRT results srttsb1: the score on SRT set B )
Aextr: “extracted” score on SRT A ) scores found by adding results on the relevant Bextr: “extracted” score on SRT B ) sentences obtained taking the preliminary SRT Cextr: “extracted” score on SRT C, a sentence set derived after the trial.
These data (except for individual sentence results) are presented in appendix 2.
3.2 Data Entry and Cleanup
The data was available to the analysts in late September, but there were difficulties in getting it into a suitable format. Their analysis was delayed because of crowded schedules. A set of standard instructions on preparing data for this sort of statistical analysis has now been prepared (see appendix 4). Adherence to this could help to prevent delays in future studies.
“Rogue” and outlying values can seriously affect an analysis, so some care was taken over the cleanup phase. This included examining all the data carefully, and using some simple plots and graphs. Queries were then referred to the original sheets or to appropriate members of the team. Some notes on this phase are given in appendix 5.
Two of the Raters, numbered 12 and 15, gave a performance which was out of line with others. The reasoning is set out below. Unless otherwise stated, tables and plots which follow exclude subjects rated by these two raters.
Carla Radloff identified rater 12 as unreliable because of a negative correlation between RPE and SRT scores when only the 9 subjects rated by rater 12 were considered.
When the correlation between RPE and SRT scores is evaluated for the five subjects rated by rater 15, it appears high because of the very small number of subjects, and the fact that with rater 15 it was not the ranking of
subjects that was the problem, rather the overestimating of the ability of some of them. The SLOPE and RPE evaluations for this rater were widely divergent.
We noticed problems with raters 12 and 15 when regressing srttsa1 on rlev, when subjects 12.07, 12.09, 12.10, and 15.04 had larger than expected residuals. Further examination of the data revealed large discrepancies between the RPE levels and SLOPE levels for several subjects rated by 12 and 15.
4 Primary Data Exploration and Analysis
4.1 Relationship Between SRT and SLOPE
4.1.1 Preliminary SRT and SLOPE
First we explore the relationship between SLOPE and the total score on the preliminary SRT sentences. The Preliminary form of the SRT consisted of sixty-three sentences of varying complexity. Figure 1 shows a plot of the raw SRT total score against SLOPE for the thirty-one subjects who had valid scores on both tests. There appears to be a reasonable relationship, which shows some curvature, however, leading to a lack of discrimination at upper levels. There is some scatter, especially around SLOPE level 2.
The information displayed in figure 1 is summarised in the following cross-tabulation.
Table 1. Total score on preliminary SRT (rows) versus SLOPE level (cols)
Total Score on
The table and the graph show that those with a lower SLOPE rating do tend to score lower on the SRT. However, for those people scoring 120 or more on the SRT, the SRT score does not appear to discriminate between the different (higher) SLOPE levels. In interpreting the graph and the table, we must remember that we are comparing the results on sixty-three sentences (rather than a shorter final form) with SLOPE (which would not normally be used in routine calibration of an SRT). Let’s now see how SLOPE levels compare with the results obtained on the
final form fifteen-sentence SRTs A and B, remembering that sentences for the two Final Form SRTs were chosen from the sentences of the Preliminary form on the basis of the RPE-based Discrimination Index (DI) and Difficulty Level (DL) as described in Radloff (1991). The DI and DL results are shown in appendix 3.
4.1.2 Final Form SRTs and SLOPE
Figures 2 and 3 show how the scores obtained on final form SRTs A and B compare with SLOPE level, for the forty-eight subjects who had valid scores on these tests, and on the RPE, i.e, excluding scores for those subjects rated by RPE raters 12 and 15. (This ensures that in all the comparisons between final form SRTs A and B, SLOPE, and RPE, we are using results from the same population of forty-eight subjects. There is no reason to suppose, however, that the SLOPE scores or scores on SRTs A and B were flawed for those fifteen additional subjects rated by RPE raters 12 and 15. Although these are not included in the tables and graphs shown here, inclusion of their results confirmed the conclusions arrived at based on the forty-eight subjects used for the analysis.)
Tables 2 and 3 summarise the behaviour illustrated in figures 2 and 3. Fig. 2 X = SLEV Y = SRTTSA1
0 5 10 15 20 25 30 35 40 45 50
0 1 2 3 4 5
SLOPE LEVEL
Table 2. Total score on Final Form SRT A (rows) versus SLOPE level (cols)
Total Score on Final form SRTA
SLOPE Level
1 1+ 2 2+ 3 3+ 4 4+
0–2 3–5 6–8
0
9–11 1 0 0 0
12–14 0 0 0 0
15–17 1 2 0 0
18–20 0 1 0 1
21–23 0 0 2 0
24–26 0 1 2 1
27–29 0 0 1 2
0
30–32 0 0 2 0 0 0 0 0
33–35 0 0 2 4 5 1 2 0
36–38 1 4 1 1 0
39–41 1 4 2 0 0
42–44
0
0 0 1 1 1
Fig. 3 X = SLEV Y = SRTTSB1
0 5 10 15 20 25 30 35 40 45 50
0 1 2 3 4 5
SLOPE LEVEL
Table 3. Total score on Final Form SRT B (rows) versus SLOPE level (cols)
Total Score on Final Form SRTB
SLOPE
Level 1 1+ 2 2+ 3 3+ 4 4+
0–2 3–5 6–8
0
9–11 1 0 0 0
12–14 0 0 0 0
15–17 0 1 0 0
18–20 0 2 0 0
21–23 1 1 4 1
24–26 0 0 0 0
27–29 0 0 3 3
0
30–32 0 0 1 2 1 0 0 0
33–35 0 0 1 0 4 1 2 0
36–38 3 4 2 1 0
39–41 1 2 0 1 1
42–44
0
0 2 2 0 0
From these tables we see that the SRT is only useful to discriminate at the lower levels. There is a very wide spread of SRT scores at SLOPE level 2+. A person with a score on either of the SRT tests in the range 30–35 could have any SLOPE level from 2 to 4. For SLOPE levels 3 and above, there is no trend at all in the SRT scores. The majority of our subjects were assigned SLOPE levels 2 to 3, whereas we could have done with more subjects at the extremes.
It is apparent, however, that someone with a score > 35 is most likely to have an assigned SLOPE level of 3 or above, and that someone with a score of < 30 is most likely to have an assigned SLOPE level below 3. Those scoring 30–35 had a wide range of assigned SLOPE levels; for subjects scoring in this range, no reliable conclusions about L2 proficiency levels can be drawn.
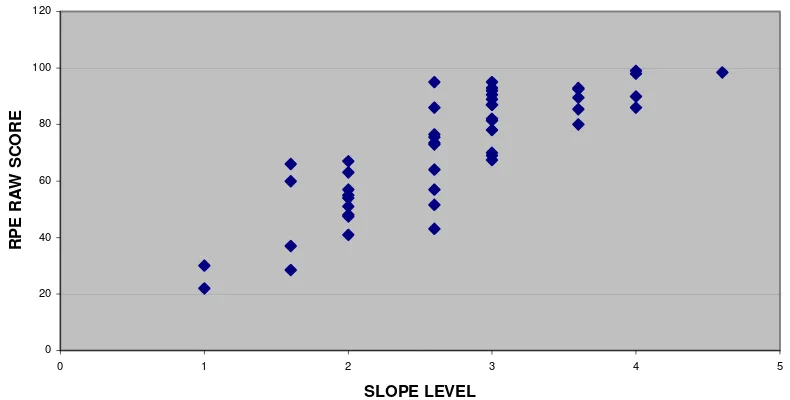
4.2 Relationship Between RPE and SLOPE
Figure 4 examines the relationship between the raw RPE score and SLOPE level for the forty-eight subjects having valid scores on both these tests.
The plot shows the following:
1. As RPE score increases, the scatter in the corresponding SLOPE levels increases.
2. At the central SLOPE levels (2–3), where we had most subjects, the scatter in the corresponding RPE scores is very high; at SLOPE level 2+ where we had most subjects (ten), the assigned RPE levels ranged from 2– 4+.
3. The relationship between RPE scores and SLOPE levels is curvilinear, with higher RPE scores failing to discriminate between different SLOPE levels.
Table 4. RPE assigned level (rows) versus SLOPE assigned level (Cols)
Table 4 shows that out of ten subjects who were assigned RPE levels 2 or below, five were assigned the same numerical level for SLOPE and five were assigned one-half level higher. By contrast, of the thirty-eight subjects who were assigned RPE level 2+ or higher, eight were assigned the same numerical SLOPE level, eleven were assigned one-half level lower and nineteen were assigned a SLOPE level which was more than one-half level lower than the assigned RPE level. It is this curvilinear relationship between the results of the two proficiency ratings, together with the disappointing amount of scatter illustrated in figure 4 and table 4, which makes it impossible for us to establish a one-to-one correspondence or a predictive relationship between them.
This outcome may be due to the modifications we had to make to both test procedures due to the prevailing circumstances in Cameroon at the time of the trial. However, since the final form SRTs A and B were developed from this study using the results of the modified RPE procedure, as compared above to the SLOPE ratings, we will require caution in interpreting the results of the SRTs A and B when using these to aid future language planning decisions.
4.3 Relationship Between SRT and RPE
4.3.1 Preliminary SRT and RPE
We first investigate the relationship between the Preliminary SRT scores and the RPE raw scores and levels since it was on the basis of the relationship of these two measures that the items for the two fifteen-sentence Final Forms were selected and calibrated. Figure 5 shows the total score on the preliminary SRT plotted against RPE level for the forty-four subjects included in the analysis used to select the final form SRTs.
Figure 5 shows a wide scatter, with no discrimination at the upper levels. The fact that there is a more reasonable relationship between the SRT total score and SLOPE level illustrated in figure 1 indicates that RPE (as it was used in this test) seems to be one of the main problems here. An additional problem was that few subjects at lower assigned proficiency levels took part. Attempts were made on the field to get testees at lower levels, but
without sufficient success.
However, at this point in the SRT development, the objective was to choose, if possible, a reduced set of sentences for each of the final form SRTs, in such a way that the extracted SRT scores for the sentences to be used in the final forms show less scatter and a more linear relationship with RPE than is observed above. The sentences for the two final form SRTs were chosen from the sentences of the preliminary form on the basis of the Discrimination Index (DI) and Difficulty Level (DL) as described in Radloff (1991). The DI and DL results are shown in appendix 3.
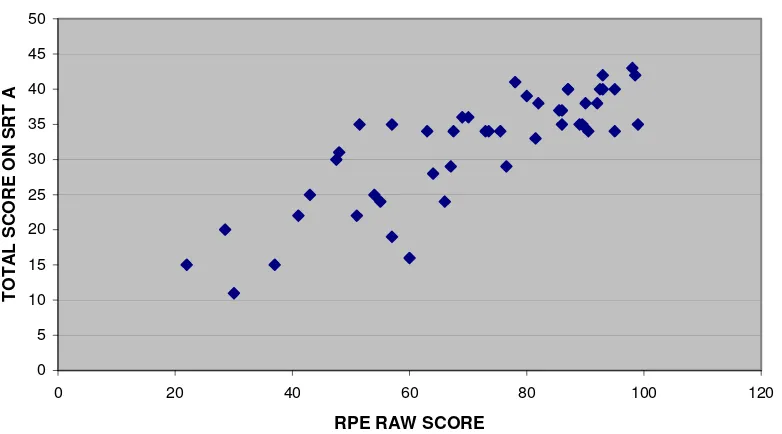
4.3.2 Final Form SRTs and RPE
Due to a clerical error, sentence 17 was included in final form A rather than sentence 47. Sentence 17 had a lower Difficulty Level than sentence 47 which resulted in an easier test than was intended. The spread of extracted scores was not as evenly distributed and the correlations were not as high as in some of the previous SRT studies. A possible explanation for this is that in this study, we were not able to use L1 speakers of French as RPE raters. Graphs, and more details of relationships between the extracted scores and the RPE levels (and also SLOPE levels) are given in appendices 7 and 8.
However, what is of real interest here is the relationship between the scores achieved by subjects when they actually took the final form SRTs A and B, rather than the extracted scores used in the selection of sentences for the final forms. Figures 6 and 7 show the scores on final forms A and B (i.e., not the extracted scores), plotted against RPE raw scores, for the forty-eight subjects who had valid results. There is still some considerable amount of scatter in the relationships shown here and lack of clear discrimination between RPE levels.
Tables 5 and 6 summarise the information shown in figures 6 and 7, indicating the relationship between RPE level and scores on final form SRTs A and B.
Fig. 5 X = RLEV Y = PSVS1
0 20 40 60 80 100 120 140 160 180
0 0.5 1 1.5 2 2.5 3 3.5 4 4.5 5
RPE LEVEL
TOTAL SCORE ON PRELIMINARY
Fig. 6 X = RRAW Y = SRTTSA1
Table 5. RPE assigned level (rows) versus SRTA total score (Cols)
RPE | SRTA level |score
9–11 12–14 15–17 18–20 21–23 24–26 27–29 30–32 33–35 36–38 39–41 42–44
Table 6.RPE assigned level (rows) versus SRTB total score (Cols)
RPE | SRTA level |score
9–11 12–14 15–17 18–20 21–23 24–
26 27–29 30–32 33–35 36–38 39–41 42–44
Here again we see the spread. Anyone with a score of 30–35 on final form SRT A or B could be RPE level 2 to 4.5.In general terms, we could derive some “cut-off” scores for RPE as we did for SLOPE. However, because of the variable nature of the RPE assigned levels in this study, it is difficult to estimate what the error would be in trying to generalise to any new population being assessed using the SRTs.
4.4 Relationship Between Preliminary and Final Form SRTs
Thirty-one subjects who took the Preliminary SRT also took the two Final Form SRTs (SRT A and SRT B). That is, these subjects repeated the same two sets of sentences. The first time these sentences were embedded in the Preliminary SRT, yielding the extracted scores for those sentences. The second time these sentences comprised the final form SRTs A and B, yielding the final form scores. In this section we investigate whether or not the extracted scores taken from the Preliminary SRT are significantly different from the scores on the same sentences in final forms A and B. To compare the extracted scores with the scores on the final forms we performed t-tests for paired samples. The results are as follows:
FORM A FORM B
For both forms SRT A and SRT B the subjects performed significantly better (p<.01) on the final forms than on the same sentences in the Preliminary SRT. This could be due to one of several factors:
1. a learning effect - the subjects do better on the Final Forms because they have 'learned' or become familiar with the sentences;
2. increased familiarity with the test methodology; or
3. there is less fatigue, and therefore concentration is better, with fifteen sentences than with sixty-three sentences.
If the effect is due not to experience (having already carried out the first round test), but due to reduced strain because of a shorter set of sentences, the suggestion is that calibrations based on extracted scores may not be entirely valid when the SRT tool is used on the field. A subject’s L2 proficiency level may be overestimated.
4.5 Further Analyses
5 Conclusions
and
Recommendations
5.1 Conclusions From This Study
5.1.1 Relationship Between the Three Test Instruments
The SRT forms developed appear only to be useful for discriminating those with SLOPE level below 3 (RPE level below 3+ in this study) from those with higher proficiency levels. There was little or no discrimination at the upper levels. SLOPE and RPE showed a reasonably strong relationship at the lower levels, but there was a lot of variability and a curved relationship, with lack of discrimination at upper levels again. The key problem in this study appears to have been the way that the RPE was applied due to circumstances in the region at the time of the study.
5.1.2 Relationship Between Preliminary and Final Form SRTs
The thirty-one subjects who had both the Preliminary SRT and the Final Forms A and B scored on average 1.8 higher (Form A) and 3.1 higher (Form B) on the final forms than on the same sentences on the Preliminary SRT. This difference of an extra 2–3 points on average may seem small, but is statistically significant (p<0.01 using a paired t-test) and could mean individuals being assigned higher L2 proficiency ratings based on their Final Form SRT results.
We do not know if the difference is due to learning effect (repeating the same sentences two times), greater concentration with fewer sentences, or increased familiarity with the testing methodology, or a combination thereof. If it is due to learning effect and/or increased familiarity with the testing methodology, the results pose no problems for future applications of French SRTs A and B because subjects will take the SRTs only once. It could pose a problem if results are due to greater concentration. If so, subjects taking the short SRTs may receive predicted L2 proficiency above their actual levels. This result should be researched further (see
Recommendations for Further Research).
5.1.3 Choice of Sentences for Final Form
There are clearly methods of selecting sentences for the final form SRTs which have potential to give improved performance in terms of ability to predict SLOPE or RPE. Such methods require further investigation (see Recommendations for Further Research).
5.2 Recommendations to Users of the SRTs Developed During this Study
Those who want to use the French SRTs A and B developed in this study in field research should note the following points:
• The French SRTs were shown to discriminate between those with assigned SLOPE levels below 3 and those with assigned SLOPE levels 3 and above, but not to discriminate between individual SLOPE levels, i.e., it was not possible to distinguish between SLOPE levels 3, 3+, and 4.
• There was not a good one-to-one correspondence between RPE and SLOPE in this study, so no attempt should be made to derive a community profile of RPE levels using SRTs A and B.
5.3 Recommendations for Further Research
Some recommendations for future studies arising from this research are as follows:
• Conduct a study similar to this one in which L1 speakers of the test language are used as RPE raters. Compare the results with SLOPE or another OPI. [We suggest that results for the RPE ratings in this study might have been better had L1 RPE raters been used.]
• Investigate other calibrating instruments to be used in sociolinguistic contexts where L1 RPE raters are not available.
• Investigate modifications of the RPE skill level descriptions to more closely evaluate the language functions important for SIL program decisions.
• Investigate the possibility of using groups of sentences, with graded difficulty. For example, use one group of ten to fifteen sentences aiming at discriminating testees with lower proficiency levels, with another set aimed at discriminating higher levels to be used subsequently if subjects do well on the first set.
• Investigate the factors that possibly influence a test-retest situation: learning effect, greater familiarity with the test instrument, possible improved concentration due to a shorter repetition test. This would help us to understand the differences reported above with the extracted versus final form scores, which of course influence “predicted” L2 capability if this is what the scores are used for.
5.4 Some Practical Recommendations for Those Conducting Further Research
• Note that the choice of raters appears crucial, and that people representing a good spread of RPE levels are needed. This may be difficult to achieve in field situations but the importance cannot be
overestimated.
• Simple statistical analysis should be conducted throughout. It is easier to address unusual patterns of variation at the time of data collection than it is later on.
• It would be better wherever possible to have some overlap in the raters, e.g., have every rater rate a couple of people who have been rated by another rater. This could alert staff to biased or unreliable raters.
Appendix 1 – Variables in Data Set
birthplace: if known by RPE rater
current: residence according to RPE rater
other: significant places lived according to RPE rater place: place lived according to ratee
duration: time spent in above place
depuis: how long ago moved from above place
time: known by rater
relation: of ratee to rater
together: language they speak together
frequency: of conversation during the past two months topics: normally occurring in their conversations
factors: other factors that may be significant (as suggested by rater)
rfw: RPE field worker ID racc: RPE accent score rgrm: RPE grammar score rflu: RPE fluency score rvoc: RPE vocabulary score rcom: RPE comprehension score rraw: RPE raw score (total) rlev: RPE level equivalent
pdate: Preliminary SRT date
psad: Preliminary SRT administrator pste: Preliminary SRT technician
psas: Preliminary SRT Acceptable Score [lenient] psrs: Preliminary SRT Restart Score [less lenient] psvs1: Preliminary SRT Verbatim Score [strict]
psen: list of verbatim scores for each sentence of Preliminary SRT extra,B,C: Extracted scores for final short-form SRTs
sdate: SLOPE date
srtad: Final SRT administrator code number srttec: Final SRT technician code number srtts: SRT total score
ssen: verbatim scores of each Final SRT sentence separated by spaces
order of phase 2 tests S=SLOPE
A=Final SRT A (per Carla's fax) B=Final SRT B (per Carla's fax) 1=Final SRT 1 (first set) 2=Final SRT 2 (first set)
Appendix 2 – Raw Data: Test Results
RPE raters 1 – 11 (predominantly Phase I subjects)
RPE raw
RPErater code rraw rlev sraw slev psvs1 srttsa_1 srttsB_1 Aextr Bextr Cextr
Appendix 2 – Raw Data: Test Results (cntd)
RPE raters 12 – 15 (predominantly Phase II subjects)
RPE raw
RPErater code rraw rlev sraw slev psvs1 srttsa_1 srttsB_1 Aextr Bextr Cextr
Appendix 4 – Guidelines for Data Entry
The terminology used in referring to data files varies. For the purpose of this report, we will refer to the set of data corresponding to an individual as a RECORD, and a slot within a record for a data item as a FIELD.
1. DATA FILES SHOULD NOT BE RAGGED
• within a given file, every record should have the SAME NUMBER OF fields;
• Separate NUMERICAL missing value codes should be assigned, since statistical packages operate on numbers.
• IF it is necessary to distinguish between fields with values "unknown" because the field is not needed for that subject (e.g., Phase II subjects did not need fields for preliminary srt scores) and fields with value unknown because of deficiency in recording data (e.g., the order of Phase II SRT/SLOPE tests was unknown for many subjects), then DIFFERENT numerical "missing value" codes should be assigned;
• no field should be left BLANK. Whenever a field does not have a value for any reason, an appropriate missing value code should be inserted.
2. FIELDS SHOULD APPEAR IN THE SAME ORDER FOR EVERY RECORD
3. FIELD-NAMES SHOULD BE CONSISTENT ACROSS RECORDS
• every distinct item of data should have its own field, appropriately named (e.g. sentence scores from the preliminary SRT should have been entered into 63 separate fields, named, e.g., psen1....psen63, rather than in a single field.
4. NUMERIC DATA SHOULD BE ENTERED IN MATRIX FORMAT (e.g., into a spreadsheet)
• one subject's record = one row • one data field = one column;
• The first row of the matrix should contain field identifiers; • The first col of the matrix should contain subject identifiers. 5. NUMERIC CODING SHOULD BE USED WHERE NEEDED
• use e.g., 0/1 for male/female, rather that m/s;
• use e.g., -1 for a missing value (ALL such codes need to be carefully documented and sent with data files):
e.g., ID SEX RPE SLOPE PRELIMSRT SRTA SRTB
1.01 0 83.2 -1 123 29 32
Appendix 5 – Guidelines for Data Cleanup
1. Checking directly from the forms
• each record should be checked at least twice following entry onto computer; • if an item of data is not clear from a form:
o can it be deduced logically (e.g., using other data from the form)? o is it present on another form?
o if not, contact person responsible for recording information; o lack of clarification following these steps => enter missing value.
2. Cross checking one form with another
• some items appear on several forms, e.g., age; • check values agree on different forms;
• if not, which is likely to be more reliable?
o e.g., age—is given by rater on RPE form and subject on SRT form; o if values disagree, take value given by subject;
o even if values for age are initially entered from RPE
forms (because RPE done first) DOUBLE CHECK when new data comes in on SRT forms.
3. Checking for internal consistency
• some items of data can be deduced from relationships between other data items, e.g., total score on SRT = sum of individual sentence scores; such data items should always be checked against each other; • in this way, an error was detected in the definition of set A:
o On communications, sentence 17 had been included in set A, but in the initial calculations, sentence 47 had been used instead ( in fact, the sentence used should have been 47).
Appendix 6 – A Brief Description of RPE Levels
The very brief description given here is only intended to help those not familiar with the RPE technique to
understand the main report. These details are abstracted from Radloff (1991), where a much broader description is given.
Each rater is asked to rate three to five second-language speakers with whom he communicates regularly, and he is guided in this task by a trained fieldworker. The raters are asked to first rank and then rate the L2 speakers by assigning them letters A, A+, B, ..., E+, or F. This ranking and rating is applied in five skill areas, Accent,
Grammar, Vocabulary, Fluency, and Comprehension, and detailed descriptions are given defining these levels. A combined weighted score is then calculated, and an RPE level assigned. Brief descriptions of the final levels are as follows:
Level 0+. Very minimal proficiency.
Level 1. Minimal limited proficiency.
A person at this level has a very heavy accent which makes understanding difficult and forces people to ask for repetition. There seem to be more mistakes in grammar than correct usage, except for stock phrases. Vocabulary is limited to basic personal and survival areas. Speech is slow and halting except for short routine sentences. Understanding is limited to slow, very simple speech, with frequent repetition and rephrasing.
Level 1+. Limited basic proficiency.
Level 2. Adequate basic proficiency.
A person at this level has a heavy accent that forces people to concentrate when listening and sometimes causes misunderstanding and gives the appearance of errors. Some important grammatical rules are not controlled which occasionally causes misunderstanding and even irritation. Vocabulary is broad enough for daily topics, but limited in some common domains and sometimes inaccurate. Hesitations and jerkiness are frequent, sometimes
sentences cannot be completed. Understanding is possible if people speak carefully and simplify their speech somewhat, but they must repeat and/or rephrase frequently.
Level 2+. Good, basic proficiency.
Level 3. Good general proficiency.
A person at this stage has a marked foreign accent, with occasional mispronunciations, but these do not interfere with understanding. Imperfect control of some grammatical patterns causes occasional errors, but understanding is not affected. Vocabulary is adequate to cope with varied social situations and special interest in some
professional domains with some circumlocutions. Speech is occasionally hesitant and perceptibly nonnative in speed and evenness. Normal educated speech is understood quite well, with only occasional need for repetition or rephrasing.
Level 3+. Very good general proficiency.
Level 4. Excellent proficiency.
A person at this level still has a very slight accent but no longer mispronounces words. No patterns of grammatical error remain and only rarely are errors made. Vocabulary is broad and precise, adequate for all technical, social, and practical situations. Only a slight difference in the speed and evenness of speech separates this speaker from a native speaker. Comprehension is complete except for very slurred or rapid speech or perhaps uncommon words or idioms.
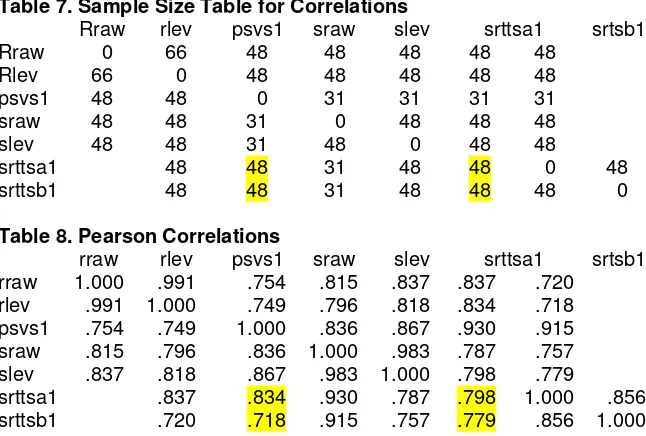
Appendix 7 – Correlation and Regression Analyses
The relationships described in section 4 of this report are highly nonlinear. There may be a linear relationship at lower proficiency levels, but this does not hold at the higher levels. Further, the variability in the results is different at different proficiency levels. Correlation is a measure of LINEAR relationships, and it is easy to demonstrate odd results in a nonlinear situation. In addition, it is assumed that the variability is constant at all levels. Correlations are therefore not really relevant to the analysis of the data in this study. They are given here for information only:
Table 7. Sample Size Table for Correlations
Rraw rlev psvs1 sraw slev srttsa1 srtsb1
Rraw 0 66 48 48 48 48 48
Rlev 66 0 48 48 48 48 48
psvs1 48 48 0 31 31 31 31
sraw 48 48 31 0 48 48 48
slev 48 48 31 48 0 48 48
srttsa1 48 48 31 48 48 0 48
srttsb1 48 48 31 48 48 48 0
Table 8. Pearson Correlations
rraw rlev psvs1 sraw slev srttsa1 srtsb1
rraw 1.000 .991 .754 .815 .837 .837 .720 rlev .991 1.000 .749 .796 .818 .834 .718 psvs1 .754 .749 1.000 .836 .867 .930 .915 sraw .815 .796 .836 1.000 .983 .787 .757 slev .837 .818 .867 .983 1.000 .798 .779
srttsa1 .837 .834 .930 .787 .798 1.000 .856
srttsb1 .720 .718 .915 .757 .779 .856 1.000
The high correlations here between psvs1 and srttsa1 are to be expected, since it includes scores on the same fifteen sentences. The important correlations, between srttsa1, srttsb1, and slev are more modest.
In the same way that correlation is a measure of linear relationship, linear regression is only useful for establishing the nature of the relationship between two variables which vary together in a linear manner, and where the variability is the same at all levels. In such instances, the variable which is considered to contain the least error should be plotted on the x-axis. This would generally mean:
• A linear equation to predict RPE or SLOPE from SRT should only be derived if graphs indicate that the scores do indeed vary linearly together, and variability is the same at all levels (all levels, especially extremes, should be well represented)
• That the “established” proficiency measure (generally taken to be RPE or SLOPE) should be plotted on the x-axis.
For these reasons, it was not appropriate to carry out a linear regression using the data from the Cameroon trial to predict RPE (y-axis) from SRT extracted scores (x-axis). However, the results of applying this method, which has been the procedure adopted in previous studies involving SRT, are given here for information only.
Table 9. Regression of RPE on Extracted Scores, SRT Forms A and B
(based on the performance of 44 subjects whose results were used in selecting sentences for final forms A and B)
Fig 9. X=RPE Level Y=SRT B extracted score
0 5 10 15 20 25 30 35 40 45
0 1 2 3 4 5
RPE Level
SRT B Ex
tr
a
c
te
d
Sc
or
e
Fig 8. X=RPE Level Y=SRT A extracted score
0 5 10 15 20 25 30 35 40 45
0 1 2 3 4 5
RPE Level
SRT
A Ext
ract
ed
Sco
Extracted A with RPE raw score Extracted B with RPE raw score
a0 = 15.273 a0 = 18.245
a1 = 1.858 a1 = 1.800
SEE = 13.174 SEE = 13.991
r = .756 r = .719
--- Final Form A (Calibrated w/RPE) Final Form B (Calibrated w/RPE)
Range of SRT scores per level Range of SRT scores per level
RPE0+ = 0 4 RPE0+ = 0 3
RPE1 = 5 9 RPE1 = 4 8
RPE1+ = 10 14 RPE1+ = 9 14
RPE2 = 15 20 RPE2 = 15 19
RPE2+ = 21 25 RPE2+ = 20 25
RPE3 = 26 30 RPE3 = 26 30
RPE3+ = 31 35 RPE3+ = 31 35
RPE4 = 36 41 RPE4 = 36 41
RPE4+ = 42 45 RPE4+ = 42 45
Fig 10. X=SLOPE Level Y=SRT A extracted score
0 5 10 15 20 25 30 35 40 45
0 1 2 3 4 5
SLOPE Level
SR
T
A
Ext
ract
ed
Sco
Table 10. Regression of SLOPE on Extracted Scores, SRT Forms A and B
(These are based on the performances of 29 subjects who took the Preliminary SRT. Since there were no subjects evaluated at less than SLOPE level 1, and the trend of discrimination in SRT scores stopped at level 3+, the calibrations go from levels 1-3+)
Extracted A with SLOPE level Extracted B with SLOPE level a0 = -.1136 a0 = .0292 a1 = .0961 a1 = .0949 SEE = .4567 SEE = .4802 r = .8579 r = .8415
--- Range of SRT scores per level Range of SRT scores per level
SL 1 = 9 14 SL 1 = 8 13
SL 1+ = 15 19 SL 1+ = 14 18
SL 2 = 20 24 SL 2 = 19 23
SL 2+ = 25 29 SL 2+ = 24 28
SL 3 = 30 35 SL 3 = 29 34
SL 3+ = 36 and up SL 3+ = 35 and up
(and above) (and above)
Fig 11. X=SLOPE Level Y=SRT B extracted score
0 5 10 15 20 25 30 35 40 45
0 1 2 3 4 5
SLOPE Level
SRT B Ex
tr
a
c
te
d
Sc
or
Appendix 8 – Alternative Methods for Choosing Final Sentence Sets
Table 11 summarises the number of subjects scoring 0,1,2, or 3 on each individual sentence in the preliminary SRT. A study of this shows which sentences were difficult or easy. For good discrimination it is clear that we would want a fairly even spread of results among the possible classes of 0, 1, 2, and 3.
Some of the sentences were very easy. This was intended at the start of the trial. For example, see the results for sentences 1, 5–7, and 10. By contrast, some sentences are very difficult, especially 60, on which noone who was tested for SLOPE scored at all! Other sentences which were difficult were 27, 42 and 61–63. It is a good practice to create and examine such tables when selecting sentences for the final form.
Table 12 shows, for a selection of sentences from the preliminary SRT, how people having different assigned SLOPE levels scored on individual sentences. They show some good patterns, in which those with high SLOPEs tend to get good scores, such as 20, 21, 23, 25. There are some cases of an occasional odd result, such as sentence 24, in which someone with SLOPE of 4 got zero! Occasional bad results could be expected. There are some additional sentences which give an odd distribution of results, e.g., sentence 22 (several people with low SLOPE scores score high marks), 26, 38, and 41 (overall spread of results versus SLOPE seems odd). Some explanation should be sought in these cases as there is likely to be learning.
Once the individual sentence scores have been examined, the criteria for selecting final form sentences must be established. After the actual study had been completed, several alternative methods were used to experiment in choosing sentences that could be used for final forms. For illustrative purposes, we report on two methods here. Set C was chosen by selecting the sentences having scores which correlated most highly with the SLOPE raw scores. Set D was chosen by selecting the sentences having scores which correlated most highly with the RPE raw scores. This gave rise to the following sentence sets (numbers refer to the sentence number as chosen from the original 63):
SETC = 15+19+21+28+32+34+35+36+39+46+47+49+52+54+57 SETD = 15+19+20+21+24+32+34+35+36+38+39+40+44+49+52
Table 13 shows the correlations between SLOPE levels and RPE levels with extracted scores for SRT A and B, Set C, and Set D. The correlation between extracted sentence scores and SLOPE level is highest for the set of sentences chosen on the basis of best correlation with SLOPE raw scores. The correlation between extracted sentence scores and RPE level is highest for the set of sentences chosen on the basis of correlation with RPE raw scores. Sets C and D both show marginally higher correlations with SLOPE and RPE than sets A and B. This result illustrates that there are alternative methods for creating final form SRTs in addition to the method
described by Radloff (1991) which could be expected to perform equally well, if not better. The plot of extracted set C scores with SLOPE levels (figure 12) is tighter than earlier plots, but it is pertinent to note that the curvature is still present.
Table 11. Number of Subjects Scoring 0, 1, 2, 3 on Each Sentence in the Preliminary SRT (only results for
those 31 subjects who were later tested on SLOPE are given; final column shows Pearson correlation of individual sentence scores with SLOPE raw scores)
Table 12. Relationship Between SLOPE Level and Score for Some Individual Sentences
Table 13. Correlations of Extracted Sentence Set Scores with SLOPE and RPE Levels
RPElevel SLOPElevel
SRTA .75 (n=44) .86 (n=29) SRTB .71 (n=44) .84 (n=29) SetC .76 (n=48) .91 (n=31) SetD .78 (n=48) .86 (n=31)
Fig 12. X=SLOPE Level Y=SRT C extracted score
References
Andersen, T. David. 1993. Measuring bilingualism in rural Sulawesi. Notes on Scripture in Use and Language Programs, 36, 42-64.
Bruhn, Thea C. 1989. `Passages': Life, the universe and language proficiency assessment. In Alatis, James E (Ed): 1989, Georgetown University Round Table on Languages and Linguistics 1989; Georgetown University Press, Washington DC, pp. 245-254.
Foreign Service Institute. 1986. FSI Oral Proficiency Test. United States Department of State.
Grimes, Barbara F. 1989. Validity and reliability in language survey testing. Papers presented at SIL International Language Assessment Conference 1989, 523-535.
Karan, Mark. 1992. Towards refining the SRT: observations drawn from the Sango SRT. Paper presented at SIL International Language Assessment Conference 1993.
Phillips, John. 1992. Developing a sentence repetition test to study Lingala bilingualism. Brazzaville, R. Congo: Société Internationale de Linguistique.
Radloff, Carla F. 1991. Sentence repetition testing for studies of community bilingualism. Dallas, TX: SIL and UTA.
Summer Institute of Linguistics. 1987. Second Language Oral Proficiency Evaluation. Notes On Linguistics. 40a, SIL Dallas.