2014
The State of World
Fisheries and Aquaculture
Opportunities and challenges
2014
ISSN 102
0-5
48
2014
The State of World
Fisheries and Aquaculture
Opportunities and challenges
FOOD AND AGRICULTURE ORGANIZATION OF THE UNITED NATIONS
concerning the delimitation of its frontiers or boundaries. The mention of specific companies or products of manufacturers, whether or not these have been patented, does not imply that these have been endorsed or recommended by FAO in preference to others of a similar nature that are not mentioned.
ISBN 978-92-5-108275-1 (print) E-ISBN 978-92-5-108276-8 (PDF)
© FAO, 2014
FAO encourages the use, reproduction and dissemination of material in this information product. Except where otherwise indicated, material may be copied, downloaded and printed for private study, research and teaching purposes, or for use in non-commercial products or services, provided that appropriate acknowledgement of FAO as the source and copyright holder is given and that FAO’s endorsement of users’ views, products or services is not implied in any way.
All requests for translation and adaptation rights, and for resale and other commercial use rights should be made via www.fao.org/contact-us/licence-request or addressed to [email protected].
Foreword
In a world where more than 800 million continue to suffer from chronic malnourishment and where the global population is expected to grow by another 2 billion to reach 9.6 billion people by 2050 – with a concentration in coastal urban areas – we must meet the huge challenge of feeding our planet while safeguarding its natural resources for future generations.
This new edition of The State of World Fisheries and Aquaculture highlights the significant role that fisheries and aquaculture plays in eliminating hunger, promoting health and reducing poverty. Never before have people consumed so much fish or depended so greatly on the sector for their well-being. Fish is extremely nutritious – a vital source of protein and essential nutrients, especially for many poorer members of our global community.
Fisheries and aquaculture is a source not just of health but also of wealth. Employment in the sector has grown faster than the world’s population. The sector provides jobs to tens of millions and supports the livelihoods of hundreds of millions. Fish continues to be one of the most-traded food commodities worldwide. It is especially important for developing countries, sometimes worth half the total value of their traded commodities.
However, we need to look beyond the economics and ensure that environmental well-being is compatible with human well-being in order to make long-term sustainable prosperity a reality for all. To this end, promoting responsible and sustainable fisheries and aquaculture is central to our work and purpose. We recognize that the health of our planet as well as our own health and future food security all hinge on how we treat the blue world. To provide wider ecosystem stewardship and improved governance of the sector, FAO is advancing Blue Growth as a coherent framework for the sustainable and socio-economic management of our aquatic resources. Anchored in the principles set out in the benchmark Code of Conduct for Responsible Fisheries back in 1995, Blue Growth focuses on capture fisheries, aquaculture, ecosystem services, trade and social protection. In line with FAO’s Reviewed Strategic Framework, the initiative focuses on promoting the sustainable use and conservation of aquatic renewable resources in an economically, socially and environmentally responsible manner. It aims at reconciling and balancing priorities between growth and conservation, and between industrial and artisanal fisheries and aquaculture, ensuring equitable benefits for communities. To reach these goals, the Blue Growth initiative taps into technical expertise throughout the Organization.
FAO recognizes the important contribution that small-scale fisheries make to global poverty alleviation and food security. To strengthen their often vulnerable and marginalized communities, FAO has been actively supporting the development of the Voluntary Guidelines for Securing Sustainable Small-scale Fisheries and working with Governments and non-state actors to assist countries in the implementation of the Voluntary Guidelines on the Responsible Governance of Tenure of Land, Fisheries and Forests. These efforts are also very much aligned with the 2014 International Year of Family Farming, during which we will continue to highlight the importance of aquaculture – especially small-scale fish farming – and support its development.
as catches from wild capture fisheries level off and demand from an emerging global middle class substantially increases. If responsibly developed and
practised, aquaculture can generate lasting benefits for global food security and economic growth.
The fisheries and aquaculture sector is facing major challenges. These range from the scourge of illegal, unreported and unregulated (IUU) fishing to harmful fishing practices to wastage to poor governance. They can all be overcome with greater political will, strategic partnerships and fuller engagement with civil society and the private sector. We need to foster good governance by ensuring the uptake and application of international instruments such as the Port State Measures Agreement, and we need to spur innovative solutions with business and industry. We all have a role to play in order to enable fisheries and aquaculture to thrive responsibly and sustainably for present and future generations.
In this regard, it is my sincere hope that you will find this issue of The State of World Fisheries and Aquaculture a valuable reference tool and that it will enhance your understanding of the vital role that fisheries and aquaculture can play in reaching the food-secure and sustainable future we aim for.
ContentS
Foreword iii Acknowledgements xi
Abbreviations and acronyms xii
PART 1
WORLD REVIEW OF FISHERIES AND AqUACULTURE
Status and trends 3
Overview 3
Capture fisheries production 9
Aquaculture 18
Fishers and fish farmers 27
The status of the fishing fleet 32
The status of fishery resources 37
Fish utilization and processing 41
Fish trade and commodities 46
Fish consumption 62
Governance and policy 69
notes 93
PART 2
SELECTED ISSUES IN FISHERIES AND AqUACULTURE
Small-scale fisheries: promoting collective action
and organization for long-term benefits 99
The issue 99
Possible solutions 101
Recent actions 102
Outlook 104 the role of aquaculture in improving nutrition: opportunities
and challenges 104
The issue 104
Possible solutions 107
Recent actions 108
Outlook 108
Post-harvest losses in small-scale fisheries 109
The issue 109
Possible solutions 110
Recent actions 115
Outlook 115 Management of inland waters for fish: a cross-sectoral
and multidisciplinary approach 116
The issue 116
Possible solutions 117
Recent actions 119
Outlook 120 Continuing challenges for the conservation and management of sharks 121
The issue 121
Possible solutions 126
Recent actions 128
Key approaches to the international fight against IUU fishing 130
The issue 130
Possible solutions 131
Recent actions 134
Outlook 135
Balanced harvest 136
The issue 136
Possible solutions 137
Recent actions 140
Outlook 140 notes 142
PART 3
HIGHLIGHTS OF SPECIAL STUDIES
Fish consumption in the Asia-Pacific region as measured by
household surveys 151
Understanding fish consumption through household surveys 151 Comparison with FAO apparent consumption figures 152
Consumption of fish and fish products 152
Conclusions 156 Key elements of the Voluntary Guidelines on the Governance of
tenure of Land, Forests and Fisheries in the Context of national
Food Security for the fisheries sector 156
Introduction 156
Key issue 1: Understanding tenure 157
Key issue 2: Tenure rights in fisheries 158 Key issue 3: The benefits of responsible governance of tenure in fisheries 159 Key issue 4: Achieving responsible governance of tenure in fisheries 159 Conclusion 161 transition from low-value fish to compound feeds in marine cage
farming in Asia 161
Introduction 161
Project activities 163
Synthesis of project findings 165
Conclusions 167 Recommendations 168 Challenges and opportunities in the utilization of fisheries by-products 169 Utilization of by-products for human consumption 169 Utilization of by-products for animal feed 171 Nutraceuticals and bioactive ingredients 171 Challenges facing the fisheries by-product industry 172 Snapshot of the activities of regional fishery bodies as a basis for
enhancing collaboration 173
Introduction 173
The August 2013 Snapshot 174
Conclusion 180 Initial assessments of vulnerabilities to climate change in fisheries and
aquaculture 181 Introduction 181 Summaries of vulnerabilities within case studies 181
Common issues across the case studies 186
VII
PART 4 OUTLOOK
Meeting future fish demand: outlook and approaches 199 Expected trends in fish supply and demand 199
Meeting future demand for fish 207
Overall conclusions and recommendations 220 notes 221
TABLES
table 1
World fisheries and aquaculture production and utilization 4 table 2
Marine capture fisheries: major producer countries 10 table 3
Marine capture: major fishing areas 11
table 4
Marine capture: major species and genera 16 table 5
Inland waters capture: major producer countries 18 table 6
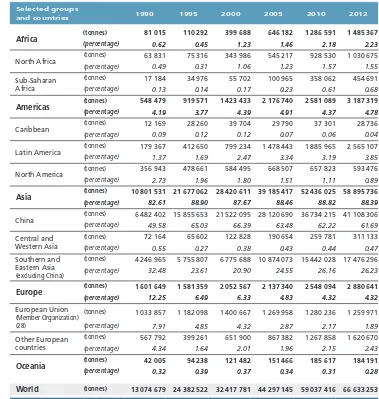
Aquaculture production by region: quantity and percentage of world
total production 20
table 7
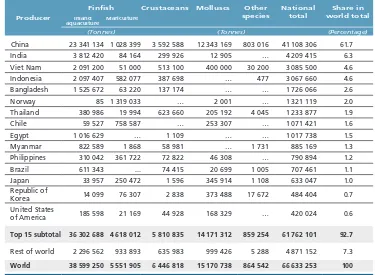
Farmed food fish production by top 15 producers and main groups
of farmed species in 2012 22
table 8
World production of farmed species groups from inland aquaculture
and mariculture in 2012 23
table 9
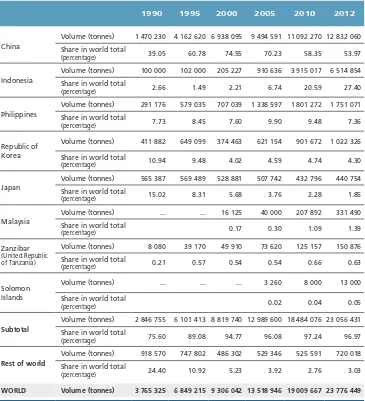
Aquaculture production of farmed aquatic plants in the world
and selected major producers 26
table 10
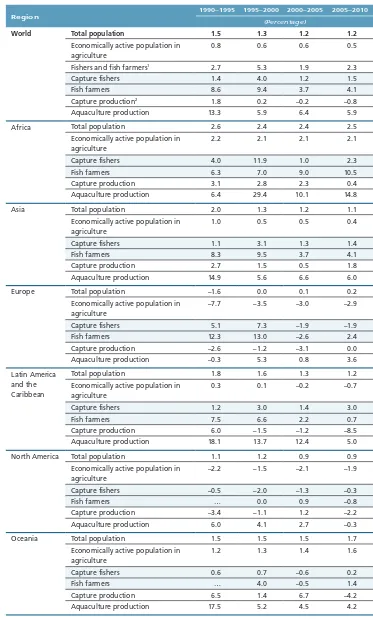
World fishers and fish farmers by region 28 table 11
Comparative average annual percentage growth rate by region
and period 29
table 12
Number of fishers and fish farmers in selected countries and territories 30 table 13
Fishery production per fisher or fish farmer by region 31 table 14
Numbers and proportion in terms of length of motorized vessels in
fishing fleets from selected countries and territories 35 table 15
Motorized fishing fleets in selected countries, 2000–2012 36 table 16
Top ten exporters and importers of fish and fishery products 50 table 17
Total and per capita food fish supply by continent and economic
grouping in 2010 63
table 18
Locations and species used for the farmers participatory trials 163 table 19
table 20
Summary results of the August 2013 Snapshot of regional
fishery bodies 176
table 21
Vulnerability of fisheries and aquaculture systems 185 table 22
Vulnerability of key fisheries and aquaculture stakeholders 185 table 23
Summary of proposed strategies for adaptation to climate change
in fisheries and aquaculture 187
table 24
FAO Fish Model: overall trends to 2022 201 table 25
FAO Fish Model: total growth in 2022 over 2010–2012 under
different scenarios 202
table 26
Fish to 2030: summary results under baseline scenario 205 table 27
Fish to 2030: summary results for 2030 under baseline and
alternative scenarios 206
FIGURES
Figure 1
World capture fisheries and aquaculture and aquaculture production 3 Figure 2
World fish utilization and supply 4
Figure 3
World capture fisheries production 5
Figure 4
Trends in major tuna species and genera 17 Figure 5
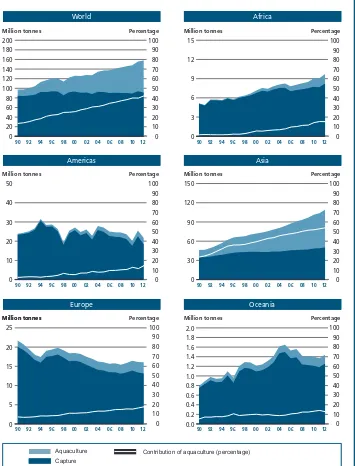
Share of aquaculture in total fish production 19 Figure 6
World inland aquaculture and mariculture production,
1980–2012 23 Figure 7
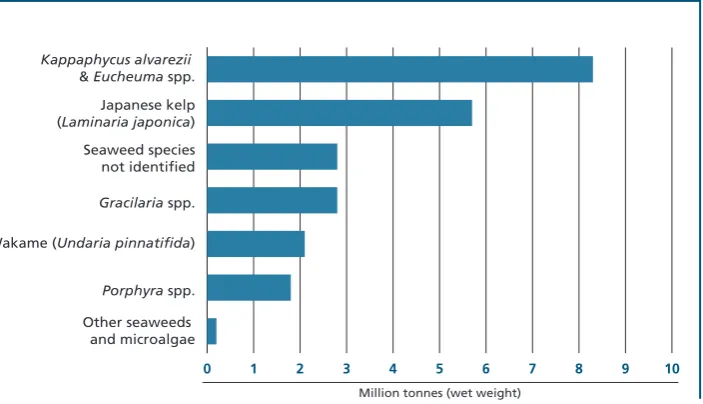
Map highlighting most populous countries in Asia 24 Figure 8
World aquaculture production of farmed aquatic algae grouped
by nature and intended use, 2012 27
Figure 9
Proportion of fishing vessels in marine and inland waters by
region in 2012 32
Figure 10
Proportion of marine fishing vessels with and without engine by
region in 2012 32
Figure 11
Distribution of motorized fishing vessels by region in 2012 33 Figure 12
Size distribution of motorized fishing vessels by region in 2012 34 Figure 13
Global trends in the state of world marine fish stocks, 1974–2011 37 Figure 14
Utilization of world fisheries production (breakdown by quantity),
IX
Figure 15
Utilization of world fisheries production (breakdown by
quantity), 2012 44
Figure 16
World fisheries production and quantities destined for export 47 Figure 17
Average fish prices in real terms (2005) 48 Figure 18
FAO Fish Price Index 49
Figure 19
Trade of fish and fishery products 51
Figure 20
Net exports of selected agricultural commodities by developing countries 52 Figure 21
Trade flows by continent (share of total imports in value; averages for 2010–2012) 54 Figure 22
Imports and exports of fish and fishery products for different regions,
indicating net deficit or surplus 56
Figure 23
Shrimp prices in Japan 58
Figure 24
Groundfish prices in the United States of America 59 Figure 25
Skipjack tuna prices in Africa and Thailand 60 Figure 26
Fishmeal and soybean meal prices in Germany and the Netherlands 61 Figure 27
Fish oil and soybean oil prices in the Netherlands 62 Figure 28
Total protein supply by continent and major food group
(average 2008–2010) 63
Figure 29
Contribution of fish to animal protein supply (average 2008–2010) 65 Figure 30
Fish as food: per capita supply (average 2008–2010) 65 Figure 31
Relative contribution of aquaculture and capture fisheries to food
fish consumption 66
Figure 32
World meat and fish food supply 67
Figure 33
World per capita meat and fish food supply 68 Figure 34
Occurrence of different types of losses in fresh fish 113 Figure 35
Enhancements of inland waters: production from different capture
and culture systems 118
Figure 36
Global catches of cartilaginous fishes reported to FAO, cumulative 123 Figure 37
Level of taxonomic detail for reporting FAO catch statistics in 2011
for bony and cartilaginous fishes 123
Figure 38
Figure 39
Shark catches and their taxonomic identification reported by
developed and developing countries, 2011 124 Figure 40
Estimates based on FAO statistics of global trade flows of shark fins
and other shark products, 2008–2011 127
Figure 41
Generalized representation of initial steps of the management
process to address balanced harvest 138
Figure 42
Size and diversity spectrum of the catch from various types of
fishing gear 139
Figure 43
Trends in the price of fishmeal and soybean meal 170 Figure 44
Trends in the price of fish oil and soybean oil 171 Figure 45
FAO Fish Model: world fishery production under different scenarios,
from 2010–12 to 2022 200
Figure 46
FAO Fish Model: world price changes under different scenarios,
from 2010–12 to 2022 200
Figure 47
World aquaculture production, fed and non-fed 216
BOxES
Box 1
The value of African fisheries 12
Box 2
Code questionnaire on aquaculture: more governments engaging
in self-assessment 70
Box 3
Examples of cooperatives in Latin America 100 Box 4
Women’s role in cooperatives 102
Box 5
Elinor Ostrom’s eight principles for managing a commons 103 Box 6
Women fish processors in Ghana and Liberia report effects of harmful
fishing practices 112
Box 7
The IPOA–Sharks and its implementation 125 Box 8
Examples of climate change adaptation in fisheries and aquaculture 182 Box 9
Social-ecological vulnerability to climatic shocks – an example of
fisheries communities dependent on coral reefs 188 Box 10
Adaptive management and the EAF management cycle 211 Box 11
Impacts of shrimp early mortality syndrome 213 Box 12
Farming systems with important social benefits and lower
environmental costs 215
XI
ACKNOWLEDGEMENTS
The State of World Fisheries and Aquaculture 2014 was prepared by staff of the FAO Fisheries and Aquaculture Department. General direction was provided by the Department’s Information Management and Communications Committee in close consultation with senior management and under the overall supervision of L. Ababouch, Director Fisheries and Aquaculture Policy and Economics Division.
Part 1, World review of fisheries and aquaculture, includes contributions from G. Bianchi, M. Camilleri, F. Chopin, T. Farmer, N. Franz, C. Fuentevilla, L. Garibaldi, R. Grainger (retired), N. Hishamunda, F. Jara (retired), I. Karunasagar (retired), G. Laurenti, A. Lem, G. Lugten, J. Turner, S. Vannuccini, R. Willmann (retired), Y. Ye and X. Zhou. S. Montanaro and contributors of selected sections prepared most of the figures and tables.
Main contributors to Part 2, Selected issues in fisheries and aquaculture, were: N. Franz, C. Fuentevilla, D. Kalikoski, R. Willmann, S. Siar and H. Josupeit (collective action and organizations in small-scale fisheries); J. Toppe and R. Subasinghe (role of aquaculture in nutrition); Y. Diei-Ouadi (post-harvest losses in small-scale fisheries); C. Capper, N. Leonard, G. Marmulla and D. Bartley (management of inland waters for fish); J. Fischer (shark conservation and management); A. Mosteiro, M. Camilleri and S. Tsuji (IUU fishing); and G. Bianchi, F. Chopin, S. Garcia, R. Grainger, P. Suuronen and Y. Ye (balanced harvest).
For Part 3, Highlights of special studies, contributors included: S. Funge-Smith and S. Needham (Asia-Pacific consumption surveys); N. Franz and R. Metzner (voluntary guidelines on tenure); M. Hasan (transition to compound feed in cage farming in Asia); I. Karunasagar and J. Toppe (fisheries by-products); G. Lugten (RFB update); and C. De Young, D. Brown, D. Soto and T. Bahri (climate change).
Part 4, Outlook, was prepared by D. Bartley, G. Bianchi, D. Soto and S. Vannuccini.
ABBreVIAtIonS And ACronYMS
ABNJ
areas beyond national jurisdiction
ALDFG
abandoned, lost or otherwise discarded fishing gear
BMP
better management practice
CCAMLR
Commission for the Conservation of Antarctic Marine Living Resources
CFS
Committee on World Food Security
CHD
coronary heart disease
CITES
Convention on International Trade in Endangered Species of Wild Fauna and Flora
CMS
Convention on Migratory Species
CODE
Code of Conduct for Responsible Fisheries
COFI
FAO Committee on Fisheries
CSO
civil society organization
DHA
docosahexaenoic acid
EAA
ecosystem approach to aquaculture
EAF
ecosystem approach to fisheries
EEZ
exclusive economic zone
EPA
XIII
FDA
Food and Drug Administration (United States of America)
FFA
Pacific Islands Forum Fisheries Agency
GDP
gross domestic product
GEF
Global Environment Facility
GFCM
General Fisheries Commission for the Mediterranean
GLOBAL RECORD
Comprehensive Global Record of Fishing Vessels, Refrigerated Transport Vessels and Supply Vessels
HS
Harmonized System
HUFA
highly unsaturated fatty acid
IFPRI
International Food Policy Research Institute
IMO
International Maritime Organization
IPOA
international plan of action
IPOA–IUU
International Plan of Action to Prevent, Deter and Eliminate IUU Fishing
IPOA–SHARKS
International Plan of Action for the Conservation and Management of Sharks
ITLOS
International Tribunal for the Law of the Sea
IUCN
International Union for Conservation of Nature
IUU
illegal, unreported and unregulated (fishing)
LIFDC
low-income food-deficit country
LOA
MCS
monitoring, control and surveillance
MOU
memorandum of understanding
MPA
marine protected area
MSY
maximum sustainable yield
NEAFC
North East Atlantic Fisheries Commission
NFFP
NEPAD-FAO Fisheries Programme
NGO
non-governmental organization
NPAFC
North Pacific Anadromous Fish Commission
OIE
World Organisation for Animal Health
PSMA
FAO Agreement on Port State Measures to Prevent, Deter and Eliminate Illegal, Unreported and Unregulated Fishing
RFB
regional fishery body
RFMO/A
regional fisheries management organization/arrangement
RPHLA
regional post-harvest loss assessment
RSN
Regional Fishery Bodies Secretariats Network
SRFC
Sub-Regional Fisheries Commission
SSF
small-scale fishery
SSF GUIDELINES
Voluntary Guidelines for Securing Sustainable Small-scale Fisheries in the Context of Food Security and Poverty Eradication
TAC
XV
UNGA
United Nations General Assembly
UNEP
United Nations Environment Programme
UVI
unique vessel identifier
VG TENURE
Voluntary Guidelines for the Responsible Governance of Tenure of Land, Fisheries and Forests in the Context of National Food Security
VMS
vessel monitoring system
WCO
World Customs Organization
WHO
World Health Organization
WTO
PART 1
worLd reVIew oF FISHerIeS
3
worLd reVIew oF FISHerIeS And
AQUACULtUre
Status and trends
oVerVIew
Global fish production has grown steadily in the last five decades (Figure 1), with food fish supply increasing at an average annual rate of 3.2 percent, outpacing world population growth at 1.6 percent. World per capita apparent fish consumption increased from an average of 9.9 kg in the 1960s to 19.2 kg in 2012 (preliminary estimate) (Table 1 and Figure 2, all data presented are subject to rounding). This impressive development has been driven by a combination of population growth, rising incomes and urbanization, and facilitated by the strong expansion of fish production and more efficient distribution channels.
China has been responsible for most of the growth in fish availability, owing to the dramatic expansion in its fish production, particularly from aquaculture. Its per capita apparent fish consumption also increased an average annual rate of 6.0 percent in the period 1990–2010 to about 35.1 kg in 2010. Annual per capita fish supply in the rest of the world was about 15.4 kg in 2010 (11.4 kg in the 1960s and 13.5 kg in the 1990s).
Despite the surge in annual per capita apparent fish consumption in developing regions (from 5.2 kg in 1961 to 17.8 kg in 2010) and low-income food-deficit countries (LIFDCs) (from 4.9 to 10.9 kg), developed regions still have higher levels of consumption, although the gap is narrowing. A sizeable and growing share of fish consumed in developed countries consists of imports, owing to steady demand and declining domestic fishery production. In developing countries, fish consumption tends to be based on locally and seasonally available products, with supply driving the fish chain. However, fuelled by rising domestic income and wealth, consumers in emerging economies are experiencing a diversification of the types of fish available owing to an increase in fishery imports.
0 20 40 60 80 100 120 140 160
50 55 60 65 70 75 80 85 90 95 00 05 12
Figure 1
World capture isheries and aquaculture production
Million tonnes
A portion of 150 g of fish can provide about 50–60 percent of an adult’s daily protein requirements. In 2010, fish accounted for 16.7 percent of the global population’s intake of animal protein and 6.5 percent of all protein consumed. Moreover, fish provided more than 2.9 billion people with almost 20 percent of their intake of animal protein, and 4.3 billion people with about 15 percent of such protein. Fish proteins can represent a crucial nutritional component in some densely populated countries where total protein intake levels may be low.
Table 1
World fisheries and aquaculture production and utilization
2007 2008 2009 2010 2011 2012
(Million tonnes)
ProdUCtIon
Capture
Inland 10.1 10.3 10.5 11.3 11.1 11.6
Marine 80.7 79.9 79.6 77.8 82.6 79.7
total capture 90.8 90.1 90.1 89.1 93.7 91.3
Aquaculture
Inland 29.9 32.4 34.3 36.8 38.7 41.9
Marine 20.0 20.5 21.4 22.3 23.3 24.7
total aquaculture 49.9 52.9 55.7 59.0 62.0 66.6
totAL worLd FISHerIeS 140.7 143.1 145.8 148.1 155.7 158.0
UtILIZAtIon1
Human consumption 117.3 120.9 123.7 128.2 131.2 136.2
Non-food uses 23.4 22.2 22.1 19.9 24.5 21.7
Population (billions) 6.7 6.8 6.8 6.9 7.0 7.1
Per capita food fish supply (kg) 17.6 17.9 18.1 18.5 18.7 19.2
Note: Excluding aquatic plants. Totals may not match due to rounding. 1 Data in this section for 2012 are provisional estimates.
0 20 40 60 80 100 120 140
50 55 60 65 70 75 80 85 90 95 00 05 12
0 3 6 9 12 15 18 21
Figure 2
World ish utilization and supply
Fish utilization (million tonnes)
Population (billions) and food supply (kg/capita)
World review of fisheries and aquaculture
5
Global capture fishery production of 93.7 million tonnes in 2011 was the second-highest ever (93.8 million tonnes in 1996). Moreover, excluding anchoveta catches, 2012 showed a new maximum production (86.6 million tonnes). Nevertheless, such figures represent a continuation of the generally stable situation reported previously.
Global fishery production in marine waters was 82.6 million tonnes in 2011 and 79.7 million tonnes in 2012 (Figure 3). In these years, 18 countries (11 in Asia) caught more than an average of one million tonnes per year, accounting for more than 76 percent of global marine catches. The Northwest and Western Central Pacific are the areas with highest and still-growing catches. Production in the Southeast Pacific is always strongly influenced by climatic variations. In the Northeast Pacific, the total catch in 2012 was the same as in 2003. The long-standing growth in catch in the Indian Ocean continued in 2012. After three years (2007–09) when piracy negatively affected fishing in the Western Indian Ocean, tuna catches have recovered. The Northern Atlantic areas and the Mediterranean and Black Sea again showed shrinking catches for 2011 and 2012. Catches in the Southwest and Southeast Atlantic have recently been recovering.
0 3 6 9 12
50 55 60 65 70 75 80 85 90 95 00 05 12
0 30 60 90
50 55 60 65 70 75 80 85 90 95 00 05 12
Figure 3
World capture isheries production
Million tonnes
Million tonnes
Catches of tuna and tuna-like species set a new record of more than 7 million tonnes in 2012. The annual global catch of the sharks, rays and chimaeras species group has been about 760 000 tonnes since 2005. In 2012, capture production of shrimp species registered a new maximum at 3.4 million tonnes, and the total catch of cephalopods exceeded 4 million tonnes.
Global inland waters capture production reached 11.6 million tonnes in 2012, but its share in total global capture production still does not exceed 13 percent.
Global aquaculture production attained another all-time high of 90.4 million tonnes (live weight equivalent) in 2012 (US$144.4 billion), including 66.6 million tonnes of food fish and 23.8 million tonnes of aquatic algae, with estimates for 2013 of 70.5 million and 26.1 million tonnes, respectively. China alone produced 43.5 million tonnes of food fish and 13.5 million tonnes of aquatic algae that year. Some developed countries, e.g. the United States of America, have reduced their aquaculture output in recent years, mainly owing to competition from countries with lower production costs.
World food fish aquaculture production expanded at an average annual rate of 6.2 percent in the period 2000–2012 (9.5 percent in 1990–2000) from 32.4 million to 66.6 million tonnes. In the same period, growth was relatively faster in Africa (11.7 percent) and Latin America and the Caribbean (10 percent). Excluding China, production in the rest of Asia grew by 8.2 percent per year (4.8 percent in 1990– 2000). The annual growth rate in China, the largest aquaculture producer, averaged 5.5 percent in 2000–2012 (12.7 percent in 1990–2000). In 2012, production in North America was lower than in 2000.
The fifteen main producer countries accounted for 92.7 percent of all farmed food fish production in 2012. Among them, Chile and Egypt became million-tonne producers in 2012. Brazil has improved its global ranking significantly in recent years. However, Thailand’s production fell to 1.2 million tonnes in 2011 and 2012 owing to flood damage and shrimp disease. Following the 2011 tsunami, Japanese aquaculture recovered slightly in 2012.
Some 58.3 million people were engaged in the primary sector of capture fisheries and aquaculture in 2012. Of these, 37 percent were engaged full time. In 2012, 84 percent of all people employed in the fisheries and aquaculture sector were in Asia, followed by Africa (more than 10 percent). About 18.9 million were engaged in fish farming (more than 96 percent in Asia). In the period 2010–2012, at least 21 million people were capture fishers operating in inland waters (more than 84 percent in Asia).
Employment in the sector has grown faster than the world’s population. In 2012, it represented 4.4 percent of the 1.3 billion people economically active in the broad agriculture sector worldwide (2.7 percent in 1990). Overall, women accounted for more than 15 percent of all people directly engaged in the fisheries primary sector in 2012. The proportion of women exceeded 20 percent in inland water fishing and up to 90 percent in secondary activities (e.g. processing). FAO estimates that, overall, fisheries and aquaculture assure the livelihoods of 10–12 percent of the world’s population.
The total number of fishing vessels was estimated at 4.72 million in 2012. The fleet in Asia accounted for 68 percent of the global fleet, followed by Africa (16 percent). Some 3.2 million vessels were considered to operate in marine waters. Globally, 57 percent of fishing vessels were engine-powered in 2012, but the motorization ratio was much higher (70 percent) in marine-operating vessels than in the inland fleet (31 percent). The marine fleet shows large regional variations, with non-motorized vessels accounting for 64 percent in Africa.
In 2012, about 79 percent of the world’s motorized fishing vessels were less than 12 m length overall (LOA). The number of industrialized fishing vessels of 24 m and larger operating in marine waters was about 64 000.
World review of fisheries and aquaculture
7
2012, with the incorporation of new and more powerful units. In the European Union (Member Organization), the downward trend in terms of numbers, tonnage and power has continued.
The proportion of assessed marine fish stocks fished within biologically sustainable levels declined from 90 percent in 1974 to 71.2 percent in 2011, when 28.8 percent of fish stocks were estimated as fished at a biologically unsustainable level and, therefore, overfished. Of the stocks assessed in 2011, fully fished stocks accounted for 61.3 percent and underfished stocks 9.9 percent.
Stocks fished at biologically unsustainable levels have an abundance lower than the level that can produce the maximum sustainable yield (MSY) and are therefore overfished. They require strict management plans to rebuild them to full and biologically sustainable productivity. Stocks fished within biologically sustainable levels have abundance at or above the level associated with MSY. Stocks fished at the MSY level produce catches that are at or very close to their maximum sustainable production. Therefore, they have no room for further expansion in catch, and require effective management to sustain their MSY. Stocks with a biomass considerably above the MSY level (underfished stocks) may have some potential to increase their production.
The ten most productive species accounted for about 24 percent of world marine capture fisheries production in 2011. Most of their stocks are fully fished and some are overfished.
Rebuilding overfished stocks could increase production by 16.5 million tonnes and annual rent by US$32 billion. With the ever-strengthening declarations of international political will and increasing acceptance of the need to rebuild overfished stocks, the world’s marine fisheries can make good progress towards long-term sustainability.
The proportion of fisheries production used for direct human consumption increased from about 71 percent in the 1980s to more than 86 percent (136 million tonnes) in 2012, with the remainder (21.7 million tonnes) destined to non-food uses (e.g. fishmeal and fish oil).
In 2012, of the fish marketed for edible purposes, 46 percent (63 million tonnes) was in live, fresh or chilled forms. For developing countries as a whole, these forms represented 54 percent of fish destined for human consumption in 2012. Developing countries have experienced a growth in the share of fish production utilized as frozen products (24 percent in 2012). In developed countries, this proportion increased to a record high of 55 percent in 2012.
A significant, but declining, proportion of world fisheries production is processed into fishmeal (mainly for high-protein feed) and fish oil (as a feed additive in aquaculture and also for human consumption for health reasons). They can be produced from whole fish, fish remains or other fish by-products. About 35 percent of world fishmeal production was obtained from fish residues in 2012.
About 25 million tonnes of seaweeds and other algae are harvested annually for use as food, in cosmetics and fertilizers, and are processed to extract thickening agents or used as an additive to animal feed.
Fish prices are influenced by demand and supply factors, including the costs of production and transportation, but also of alternative commodities (e.g. meat and feeds). The aggregate FAO Fish Price Index increased markedly from early 2002 and, after some fluctuations, reached a record high in October 2013.
China is, by far, the largest exporter of fish and fishery products. However, since 2011, it has become the world’s third-largest importing country, after the United States of America and Japan. The European Union (Member Organization) is the largest market for imported fish and fishery products, and its dependence on imports is growing.
An important change in trade patterns is the increased share of developing countries in fishery trade. Developing economies saw their share rise to 54 percent of total fishery exports by value in 2012, and more than 60 percent by quantity (live weight). Although developed countries continue to dominate world imports of fish and fishery products, their share has decreased. Exports from developing countries have increased significantly in recent decades also thanks to the lowering of tariffs. This trend follows the expanding membership of the World Trade Organization (WTO), the entry into force of bilateral and multilateral trade agreements, and rising disposable incomes in emerging economies. However, several factors continue to constrain developing countries in accessing international markets.
Almost two decades since its adoption, the Code of Conduct for Responsible Fisheries (the Code) remains key to achieving sustainable fisheries and aquaculture. The Code provides the framework, and its implementation is steered by 4 international plans of action (IPOAs), 2 strategies and 28 technical guidelines, which have evolved to embrace the ecosystem approach. Most countries have fisheries policy and
legislation that are consistent with the Code, while other countries have plans to align them. Globally, the priority for implementation is the establishment of responsible fisheries with due consideration of relevant biological, technical, economic, social, environmental and commercial aspects. Members have reported progress on various aspects of the Code including establishment of systems to control fisheries operations, developing food safety and quality assurance systems, establishment of mitigation measures for post-harvest losses, and development and implementation of national plans to combat illegal, unreported and unregulated (IUU) fishing and curtail fishing capacity. Several regional fishery bodies (RFBs) have implemented management measures to ensure sustainable fisheries and protect endangered species. The 2012 independent evaluation of FAO’s support to the implementation of the Code was positive but called for more strategic and prioritized development and support, improved outreach, closer articulation between normative and operational work, and more attention to the human dimensions.
FAO is promoting “Blue Growth” as a coherent approach for the sustainable, integrated and socio-economically sensitive management of oceans and wetlands, focusing on capture fisheries, aquaculture, ecosystem services, trade and social protection of coastal communities. The Blue Growth framework promotes responsible and sustainable fisheries and aquaculture by way of an integrated approach involving all stakeholders. Through capacity development, it will strengthen the policy
environment, institutional arrangements and the collaborative processes that empower fishing and fish-farming communities, civil society organizations and public entities.
World review of fisheries and aquaculture
9
Traceability in the food supply chain is increasingly becoming a requirement in major fish importing countries. It can safeguard public health and demonstrate that fish has been caught legally from a sustainably managed fishery or produced in an approved aquaculture facility. FAO technical guidelines describe best practices for certification of products and processes and for ensuring that labels on fish products are accurate and verifiable.
The RFBs are the primary organizational mechanism through which States work together to ensure the long-term sustainability of shared fishery resources. Progress has been made in extending the global coverage of RFBs, which ideally will eventually result in all marine and transboundary inland aquatic regions being covered by some form of RFB or arrangement. The RFBs recognize the need for their mandates to be sound and for their practices, procedures and advice to be best practice. Most have prioritized plans for implementing review recommendations and are effectively monitoring their progress.
Illegal, unreported and unregulated (IUU) fishing remains a major threat to marine ecosystems. Therefore, many States are striving to implement the
International Plan of Action to Prevent, Deter and Eliminate Illegal, Unreported and Unregulated Fishing (IPOA–IUU), while RFBs have engaged in vigorous campaigns to combat IUU fishing. The binding 2009 FAO Agreement on Port State Measures to Prevent, Deter and Eliminate Illegal, Unreported and Unregulated Fishing (PSMA) has not yet come into force but it has the potential to be a cost-effective and efficient means of combating IUU fishing. In June 2014, the FAO Committee on Fisheries (COFI) will consider the “Voluntary Guidelines for Flag State Performance”. These should prove a valuable tool for strengthening compliance by flag States regarding fishing vessels.
Bycatch and discards remain a major concern. FAO has developed international guidelines on bycatch management and discard reduction and has been urged to provide support in capacity building for their implementation within the ecosystem approach. FAO and its partners are therefore developing a series of global and regional bycatch initiatives.
A recent FAO survey indicates a good overall status of governance in aquaculture. The ecosystem approach to aquaculture (EAA) and spatial planning are becoming important in supporting implementation of the Code, particularly with respect to social licence and environmental integrity. Interest in the certification of aquaculture production systems, practices, processes and products is also increasing. However, the plethora of international and national certification schemes and accreditation bodies has led to some confusion and unnecessary costs. In this regard, FAO has developed technical guidelines on aquaculture certification and an evaluation framework for assessing such schemes. Overall, the major challenge for aquaculture governance is to ensure that the right measures are in place to guarantee environmental sustainability without destroying entrepreneurial initiative and social harmony.
Areas beyond national jurisdiction (ABNJ) comprise the high seas and the sea bed beyond the exclusive economic zones (EEZs). They include ecosystems that are subject to impacts from shipping, pollution, deep-sea mining, fishing, etc. FAO is coordinating the “Global sustainable fisheries management and biodiversity conservation in the Areas Beyond National Jurisdiction Program” to promote efficient and sustainable management of fisheries and biodiversity conservation.
CAPtUre FISHerIeS ProdUCtIon total capture fisheries production
However, these recent results should not raise expectations of significant catch increases. Rather, they represent a continuation of the generally stable situation reported previously.1 Variations in production by country, fishing area and species are
buffered at the global level through compensatory developments in different fisheries. In 1998, extremely low anchoveta catches reduced the total catch to 85.7 million tonnes. Thereafter, the widest deviations from the annual average of 91.1 million tonnes in the best and worst years (2011 and 2003 at 93.7 and 88.3 million tonnes, respectively) have been only about 3 percent.
world marine capture production
Global fishery production in marine waters was 82.6 million tonnes in 2011 and
79.7 million tonnes in 2012 (74.3 and 75.0 million tonnes excluding anchoveta). In these two years, 18 countries caught more than an average of one million tonnes per year, accounting for more than 76 percent of global marine catches (Table 2). Eleven of these countries are in Asia (including also the Russian Federation, which fishes much more in the Pacific than in the Atlantic).
Most of these Asian countries have shown considerable increases in marine catches in the last 10 years, with the exception of Japan and Thailand, which have registered decreases, and the Philippines and the Republic of Korea, whose catches have grown slightly. However, while some countries (i.e. the Russian Federation, India and Malaysia) have reported decreases in some years, marine catches submitted to FAO by Myanmar,
Table 2
Marine capture fisheries: major producer countries
2012 Ranking
Country Continent 2003 2011 2012
Variation 2003–2012 2011–2012
(Tonnes) (Percentage)
1 China Asia 12 212 188 13 536 409 13 869 604 13.6 2.4
2 Indonesia Asia 4 275 115 5 332 862 5 420 247 27.0 1.7
3 United States of America
Americas 4 912 627 5 131 087 5 107 559 4.0 –0.5
4 Peru Americas 6 053 120 8 211 716 4 807 923 –20.6 –41.5
5 Russian Federation
Asia/ Europe
3 090 798 4 005 737 4 068 850 31.6 1.6
6 Japan Asia 4 626 904 3 741 222 3 611 384 –21.9 –3.5
7 India Asia 2 954 796 3 250 099 3 402 405 15.1 4.7
8 Chile Americas 3 612 048 3 063 467 2 572 881 –28.8 –16.0
9 Viet Nam Asia 1 647 133 2 308 200 2 418 700 46.8 4.8
10 Myanmar Asia 1 053 720 2 169 820 2 332 790 121.4 7.5
11 Norway Europe 2 548 353 2 281 856 2 149 802 –15.6 –5.8
12 Philippines Asia 2 033 325 2 171 327 2 127 046 4.6 –2.0
13 Republic of Korea
Asia 1 649 061 1 737 870 1 660 165 0.7 –4.5
14 Thailand Asia 2 651 223 1 610 418 1 612 073 –39.2 0.1
15 Malaysia Asia 1 283 256 1 373 105 1 472 239 14.7 7.2
16 Mexico Americas 1 257 699 1 452 970 1 467 790 16.7 1.0
17 Iceland Europe 1 986 314 1 138 274 1 449 452 –27.0 27.3
18 Morocco Africa 916 988 949 881 1 158 474 26.3 22.0
total 18 major countries 58 764 668 63 466 320 60 709 384 3.3 –4.3
world total 79 674 875 82 609 926 79 705 910 0.0 –3.5
World review of fisheries and aquaculture
11
Viet Nam, Indonesia and China have shown continuous growth, in some cases resulting in an astonishing decadal increase (e.g. Myanmar up 121 percent, and Viet Nam up 47 percent).
The drop in capture production for Japan and Thailand (–22 and –39 percent, respectively) has been due to different reasons. Japan has been progressively reducing its fishing fleet since the early 1980s. In March 2011, its northeast coast was hit by a tsunami caused by the fifth-most powerful earthquake in the world since modern record-keeping began in 1900. Following the destruction of fishing vessels and infrastructure, Japan’s total catch was forecast to fall by about one-third. However, the actual decrease in comparison to 2010 was about 7 percent, with a further decrease of 3.5 percent in 2012. Thailand’s catches have fallen markedly owing to depletion of some marine resources by overfishing and environmental degradation in the Gulf of Thailand, and cessation of fishing operations by Thai vessels in Indonesian waters since 2008.
Reflecting the extensive fishing by Asian countries, the Northwest and Western Central Pacific are the areas with highest and still-growing catches (Table 3). Production in the Southeast Pacific is always strongly influenced by climatic variations. In the Northeast Pacific, despite annual strong fluctuations for major species (i.e. Alaska pollock and salmons), the total catch in 2012 was the same as in 2003.
The growth in total catch seems unending in the Indian Ocean, as in 2012 two new record highs were recorded for the Western (4.5 million tonnes) and Eastern (7.4 million tonnes) fishing areas. After three years (2007–09) in which total tuna catches in the Western Indian Ocean decreased by 30 percent as piracy deterred fishing operations, tuna catches have recovered since 2010.
The decline in catches in the Northern Atlantic areas and in the Mediterranean and Black Sea seemed to have ended at the beginning of the 2010s, but data for 2011
Table 3
Marine capture: major fishing areas
Fishing area code
Fishing area name 2003 2011 2012
Variation
2003–2012 2011–2012
(Tonnes) (Percentage)
21 Atlantic, Northwest 2 293 460 2 002 323 1 977 710 –13.8 –1.2
27 Atlantic, Northeast 10 271 103 8 048 436 8 103 189 –21.1 0.7
31 Atlantic, Western Central 1 770 746 1 472 538 1 463 347 –17.4 –0.6
34 Atlantic, Eastern Central 3 549 945 4 303 664 4 056 529 14.3 –5.7
37 Mediterranean and Black Sea 1 478 694 1 436 743 1 282 090 –13.3 –10.8
41 Atlantic, Southwest 1 987 296 1 763 319 1 878 166 –5.5 6.5
47 Atlantic, Southeast 1 736 867 1 263 140 1 562 943 –10.0 23.7
51 Indian Ocean, Western 4 433 699 4 206 888 4 518 075 1.9 7.4
57 Indian Ocean, Eastern 5 333 553 7 128 047 7 395 588 38.7 3.8
61 Pacific, Northwest 19 875 552 21 429 083 21 461 956 8.0 0.2
67 Pacific, Northeast 2 915 275 2 950 858 2 915 594 0.0 –1.2
71 Pacific, Western Central 10 831 454 11 614 143 12 078 487 11.5 4.0
77 Pacific, Eastern Central 1 769 177 1 923 433 1 940 202 9.7 0.9
81 Pacific, Southwest 731 027 581 760 601 393 –17.7 3.4
87 Pacific, Southeast 10 554 479 12 287 713 8 291 844 –21.4 –32.5
18, 48, 58, 88
Arctic and Antarctic areas 142 548 197 838 178 797 25.4 –9.6
and 2012 again showed shrinking catches. Trends in the Southwest and Southeast Atlantic have been variable in the last decade but in recent years both areas have been recovering from the catch decreases of the late 2000s.
About one-third of total capture production in the Western Central Atlantic comes from United States’ catches of Gulf menhaden (Brevoortia patronus), a clupeoid species that is processed into fishmeal and fish oil. In 2010, the menhaden fishery experienced unprecedented closures of long-established fishing grounds owing to the Deepwater Horizon oil spill. High catches in 2011 contributed to a recovery in the overall total for the Western Central Atlantic to about 1.5 million tonnes, a level not achieved since 2004. In-depth analysis of catch trend in this area is hampered by the low quality of data or non-submission of fishery statistics by several Caribbean and coastal States.
Similarly, for a real picture of the trend in the Eastern Central Atlantic, where the maximum was reached in 2010 at 4.4 million tonnes, catch data are needed for all distant-water fleets fishing in the EEZs of West African countries (Box 1 provides an estimate of the value of fisheries agreements with foreign nations fishing in these EEZs). Some coastal countries (e.g. Guinea-Bissau and Mauritania) provide information on such catches to FAO. This information is cross-checked with data submitted by the flag States, and the catches that had not been reported to FAO are added to the
Box 1
The value of African fisheries
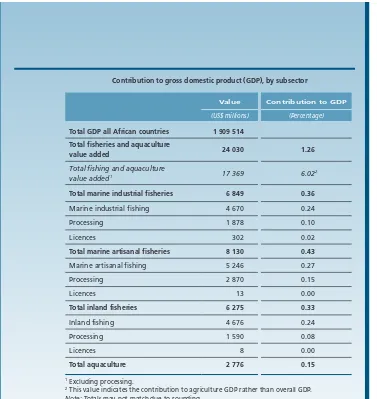
The contribution of fishery activities to national economies is multifaceted. In addition to supplying food, capture and aquaculture production contributes to gross domestic product (GDP), provides livelihoods for fishers and processors, is a source of hard currency (from exports of fishery products), and boosts government revenues through fisheries agreements and taxes.
The study “The value of African fisheries”1 was carried out in the framework of the NEPAD-FAO Fisheries Programme funded by the Swedish International Development Cooperation Agency (Sida). The aim was to estimate the contribution to national and agriculture GDPs and the employment generated by the whole fisheries sector, defined as including fishing, processing, licensing of local fleets, and aquaculture.
Information was provided by 42 experts from the 23 countries (more than 40 percent of all African States) collaborating in the study. To obtain figures for the entire continent, data from the sampled countries were analysed and calibrated to extrapolate values for the non-sampled countries, which were classified into separate groups for marine fisheries, inland fisheries and aquaculture according to their geographical location or productivity.
The value added by the fisheries sector as a whole in 2011 was estimated at more than US$24 billion, 1.26 percent of the GDP of all African countries (see table). Detailed figures by subsector highlight the relevance of marine artisanal fisheries and related processing, and also of inland fisheries, which contribute one-third of the total catches in African countries. Aquaculture is still developing in Africa and is mostly concentrated in a few countries but already produces an estimated value of almost US$3 billion per year.
World review of fisheries and aquaculture
13
FAO database. However, some foreign vessels operate in joint ventures with local companies, which makes correct attribution of catch nationality more complex and avoiding catch recording easier.
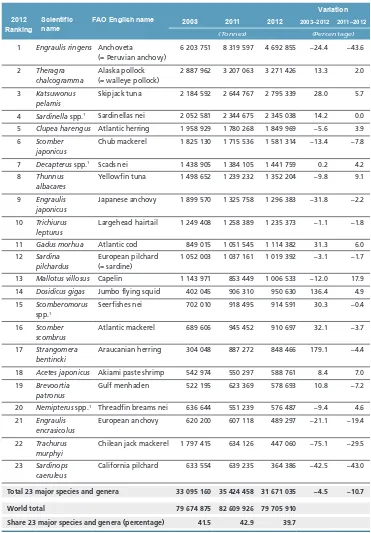
Table 4 ranks the 23 species and genera for which catches exceeded an average of half a million tonnes in 2011 and 2012. The FAO global capture database now includes statistics for almost 1 600 harvested marine species, but these 23 major species alone represent about 40 percent of the total marine catch. Almost two-thirds of these species are small pelagics that present large fluctuations owing to environmental regimes. In several cases, they are widely used as raw material in reduction to meal and oil, and are of low commercial value.
Besides the above-mentioned drop in anchoveta catches, 2012 also saw significant decreases in catches of California pilchard and Chilean jack mackerel. Final catch data for the latter will also be at a low level in 2013 as the South Pacific Regional Fisheries Management Organisation has adopted conservation and management measures to arrest its depletion, including a reduced overall catch quota.
In 2011 and 2012, the Gadiformes group confirmed its recovery from the catch of less than 7 million tonnes recorded in 2009. The two most important species in this group (Alaska pollock and Atlantic cod) have shown continuously increasing catches
Contribution to gross domestic product (GdP), by subsector
Value Contribution to GdP
(US$ millions) (Percentage)
total GdP all African countries 1 909 514
total fisheries and aquaculture
value added 24 030 1.26
Total fishing and aquaculture
value added1 17 369 6.02
2
total marine industrial fisheries 6 849 0.36
Marine industrial fishing 4 670 0.24
Processing 1 878 0.10
Licences 302 0.02
total marine artisanal fisheries 8 130 0.43
Marine artisanal fishing 5 246 0.27
Processing 2 870 0.15
Licences 13 0.00
total inland fisheries 6 275 0.33
Inland fishing 4 676 0.24
Processing 1 590 0.08
Licences 8 0.00
total aquaculture 2 776 0.15
1 Excluding processing.
in the last 3–4 years, and the levels attained in 2012 had not been reached since 1998. Blue whiting (Micromesistius poutassou), which was the third most-caught of all species in 2004, ranked about thirtieth in 2012. From the late 1990s, this species had eight strong consecutive year classes until 2005 when recruitment collapsed to former levels. Various hypotheses have been proposed for these variations but firm conclusions have yet to be drawn.2 However, in 2012, catches resumed growing after an extremely
Box 1 (cont.)
The value of African fisheries
According to the new estimates produced by the study, the fisheries sector as a whole employs 12.3 million people as full-time fishers or full-time and part-time processors, representing 2.1 percent of Africa’s population of between 15 and 64 years old. Fishers represent half of all people engaged in the sector, 42.4 percent are processors and 7.5 percent work in aquaculture. About 27.3 percent of the people engaged in fisheries and aquaculture are women, with marked differences in their share among fishers (3.6 percent), processors (58 percent), and aquaculture workers (4 percent). There are clear geographical patterns with high percentages of processors in western and southern Africa, and consequently large female employment, whereas in eastern Africa the number of fishers often exceeds that of processors (see figure). Expanding on what the figure indicates, at the country level, Nigeria ranks first with almost 2 million people engaged in the fisheries and aquaculture sector, followed by Morocco (almost 1.4 million) and Uganda (almost 1 million). Breaking this down, in terms of number of fishers, Morocco (870 000) tops Nigeria (790 000), Uganda (470 000) and Mali (350 000). In terms of processors, Nigeria (more than 1 million) has almost double the number of Morocco (slightly more than 500 000), followed by Uganda (420 000) and Ghana (385 000). For aquaculture, the picture is very different with Egypt (580 000) having more people employed in the sector than all the other countries of Africa combined, followed by Nigeria (135 000) and Uganda (53 000). In addition to this direct employment, substantial numbers of people are engaged in support services to the sector such as boat building and repair, provisioning vessels, fish marketing, administration and research.
In addition to the estimated value added of US$24 billion, in 2011 African countries also received US$0.4 billion under fisheries agreements with foreign nations fishing in their exclusive economic zones, according to a conservative estimate by FAO. This figure was calculated using publicly available information on the agreements with countries in the European Union (Member Organization) and extrapolated values for other countries. Considering that 25 percent of all marine catches around Africa are still by non-African countries, the value added to national economies could be much higher than US$0.4 billion if African fleets also accounted for this portion of catches.
World review of fisheries and aquaculture
15
low level in 2010 and, on the basis of a spawning stock biomass that almost doubled from 2010 to 2013, the International Council for the Exploration of the Sea advised an increase in the total allowable catch by 64 and 48 percent for 2013 and 2014, respectively.
Catches of flatfish, coastal and other demersal species groups have been stable in recent years.
Note: Final boundary between the Republic of the Sudan and the Republic of South Sudan has not yet been determined.
employment in African fisheries, by subsector
Total ishers
employment
Total processors
Total aquaculture workers
workers
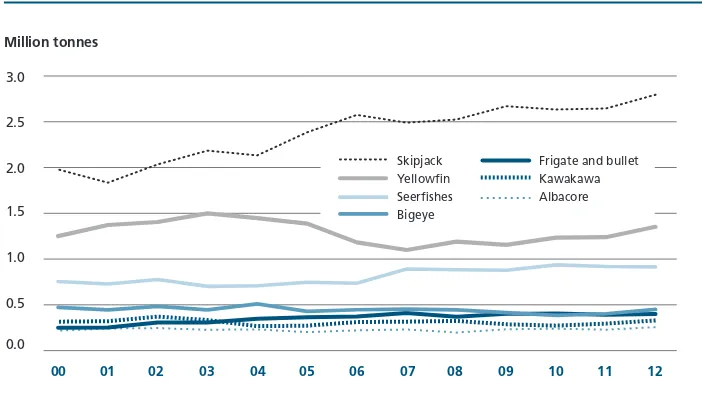
Catches of tuna and tuna-like species resumed growing and set a new record of more than 7 million tonnes in 2012. Seven species and genera have consistently accounted for about 90 percent of the total tuna catch since 2000. Catches of small tunas (such as skipjack, frigate and bullet tunas), seerfishes (Scomberomorus spp.) and albacore have grown significantly (Figure 4). In 2012, catches of yellowfin exceeded their 2000 level after fluctuating, while bigeye had the only decreasing trend with catches down by 5 percent.
Table 4
Marine capture: major species and genera
2012 Ranking
Scientific name
FAO English name 2003 2011 2012
Variation
4 Sardinella spp.1 Sardinellas nei 2 052 581 2 344 675 2 345 038 14.2 0.0
5 Clupea harengus Atlantic herring 1 958 929 1 780 268 1 849 969 –5.6 3.9
6 Scomber
Japanese anchovy 1 899 570 1 325 758 1 296 383 –31.8 –2.2
10 Trichiurus lepturus
Largehead hairtail 1 249 408 1 258 389 1 235 373 –1.1 –1.8
11 Gadus morhua Atlantic cod 849 015 1 051 545 1 114 382 31.3 6.0 12 Sardina
pilchardus
European pilchard (= sardine)
1 052 003 1 037 161 1 019 392 –3.1 –1.7
13 Mallotus villosus Capelin 1 143 971 853 449 1 006 533 –12.0 17.9
14 Dosidicus gigas Jumbo flying squid 402 045 906 310 950 630 136.4 4.9
15 Scomberomorus
spp.1
Seerfishes nei 702 010 918 495 914 591 30.3 –0.4
16 Scomber scombrus
Atlantic mackerel 689 606 945 452 910 697 32.1 –3.7
17 Strangomera bentincki
Araucanian herring 304 048 887 272 848 466 179.1 –4.4
18 Acetes japonicus Akiami paste shrimp 542 974 550 297 588 761 8.4 7.0
19 Brevoortia patronus
Gulf menhaden 522 195 623 369 578 693 10.8 –7.2
20 Nemipterus spp.1 Threadfin breams nei 636 644 551 239 576 487 –9.4 4.6
21 Engraulis encrasicolus
European anchovy 620 200 607 118 489 297 –21.1 –19.4
22 Trachurus murphyi
Chilean jack mackerel 1 797 415 634 126 447 060 –75.1 –29.5
23 Sardinops caeruleus
California pilchard 633 554 639 235 364 386 –42.5 –43.0
total 23 major species and genera 33 095 160 35 424 458 31 671 035 –4.5 –10.7
world total 79 674 875 82 609 926 79 705 910
Share 23 major species and genera (percentage) 41.5 42.9 39.7
Note: nei = not elsewhere included.
World review of fisheries and aquaculture
17
The global catch of the sharks, rays and chimaeras species group has been stable since 2005 around an annual average of 760 000 tonnes. About 37 percent of recent catches are for shark species items, 30 percent for rays, 1 percent for chimaeras, and 32 percent are unidentified “Elasmobranchii”. However, as the great majority of catches grouped under “Elasmobranchii” belong to proper sharks, total recent shark catches can be estimated at about 520 000 tonnes. Previous issues of The State of World Fisheries and Aquaculture mentioned that the apparent increase in shark catches in the 1990s up to the record high of 2003 may have been influenced by the enhanced species breakdown in the catch statistics reported (see also section Continuing challenges for the conservation and management of sharks on pp. 121–130). As improvement in the quality of the shark catch data collected by national offices and regional fishery bodies seems to be approaching a plateau, the indication from recent data of a stable trend is now considered more reliable.
In 2012, capture production of shrimp species registered a new maximum at 3.4 million tonnes. More than half of the global shrimp catch comes from the Northwest and Western Central Pacific, with other important fisheries in the Indian Ocean and Western Atlantic (respectively, almost 20 and 17 percent of the total). After peaking in 2007 at 4.3 million tonnes, the total catch of cephalopods slowed for some years, but in 2012 it again exceeded 4 million tonnes. The jumbo flying squid (Dosidicus gigas) from the Eastern Pacific, Japanese flying squid (Todarodes pacificus) from the Northwest Pacific, and the Argentine shortfin squid (Illex argentines) from the Southwest Atlantic are the most-caught species, also by distant-water fleets. Catches of octopuses, which at the global level are more stable than those of squids, come mainly from the Northwest Pacific and Eastern Central Atlantic.
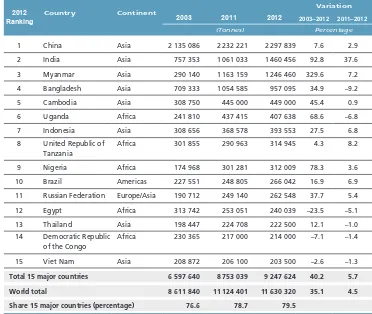
world inland waters capture production
Global inland waters capture production reached 11.6 million tonnes in 2012. Although its upward trend seems continuous, its share in total global capture production does not exceed 13 percent.
“Inland waters” remains the most difficult subsector for which to obtain reliable capture production statistics. Several countries in Asia, the continent that accounts for two-thirds of the global total, are believed to either under- or over-estimate their inland water catches. The total catch reported by India is very variable and that from Myanmar has increased 4.3 times in a decade (see Table 5, which shows data for countries whose catches exceeded 200 000 tonnes in 2012). However, consumption surveys in Cambodia, the Lao People’s Democratic Republic, Thailand and Viet Nam reveal that capture production in the lower Mekong Basin is probably significantly greater than officially reported.3
Figure 4
Trends in major tuna species and genera
Million tonnes
00 01 02 03 04 05 06 07 08 09 10 11 12
Skipjack Yellowin Seerishes Bigeye
Frigate and bullet Kawakawa Albacore
Inland fisheries are also important in Africa, where one-third (2.7 million tonnes) of total capture fisheries production comes from inland waters. The numerous populations living near the Great Lakes (Victoria, Tanganyika and Malawi) and major rivers (Nile, Niger, Congo, etc.) depend primarily on fish for their protein intake. The “Value of African Fisheries” study (see Box 1) highlights the importance of inland fisheries in terms of value and employment.
The total inland waters catch in the other continents is stable at about 0.58 million and 0.38 million tonnes for the Americas and Europe (including the Russian
Federation), respectively, and 18 000 tonnes in Oceania.
AQUACULtUre
World aquaculture production continues to grow, albeit at a slowing rate. According to the latest available statistics collected globally by FAO, world aquaculture production attained another all-time high of 90.4 million tonnes (live weight equivalent) in 2012 (US$144.4 billion), including 66.6 million tonnes of food fish (US$137.7 billion) and 23.8 million tonnes of aquatic algae (mostly seaweeds, US$6.4 billion). In addition, some countries also reported collectively the production of 22 400 tonnes of non-food products (US$222.4 million), such as pearls and seashells for ornamental and decorative uses. For this analysis, the term “food fish” includes finfishes, crustaceans, molluscs, amphibians, freshwater turtles and other aquatic animals (such as sea cucumbers, sea urchins, sea squirts and edible jellyfish) produced for the intended use as food for human consumption. At the time of writing, some countries (including major producers such as China and the Philippines) had released their provisional or final official
aquaculture statistics for 2013. According to the latest information, FAO estimates that world food fish aquaculture production rose by 5.8 percent to 70.5 million tonnes in 2013, with production of farmed aquatic plants (including mostly seaweeds) being estimated at 26.1 million tonnes. In 2013, China alone produced 43.5 million tonnes of food fish and 13.5 million tonnes of aquatic algae.
Table 5
Inland waters capture: major producer countries
2012 Ranking
Country Continent
2003 2011 2012
Variation
2003–2012 2011–2012
(Tonnes) Percentage
1 China Asia 2 135 086 2 232 221 2 297 839 7.6 2.9
2 India Asia 757 353 1 061 033 1 460 456 92.8 37.6
3 Myanmar Asia 290 140 1 163 159 1 246 460 329.6 7.2
4 Bangladesh Asia 709 333 1 054 585 957 095 34.9 –9.2
5 Cambodia Asia 308 750 445 000 449 000 45.4 0.9
6 Uganda Africa 241 810 437 415 407 638 68.6 –6.8
7 Indonesia Asia 308 656 368 578 393 553 27.5 6.8
8 United Republic of Tanzania
Africa 301 855 290 963 314 945 4.3 8.2
9 Nigeria Africa 174 968 301 281 312 009 78.3 3.6
10 Brazil Americas 227 551 248 805 266 042 16.9 6.9
11 Russian Federation Europe/Asia 190 712 249 140 262 548 37.7 5.4
12 Egypt Africa 313 742 253 051 240 039 –23.5 –5.1
13 Thailand Asia 198 447 224 708 222 500 12.1 –1.0
14 Democratic Republic of the Congo
Africa 230 365 217 000 214 000 –7.1 –1.4
15 Viet Nam Asia 208 872 206 100 203 500 –2.6 –1.3
total 15 major countries 6 597 640 8 753 039 9 247 624 40.2 5.7
world total 8 611 840 11 124 401 11 630 320 35.1 4.5
World review of fisheries and aquaculture
19
The total farmgate value of global aquaculture has probably been overstated owing to factors such as some countries reporting retail, product or export prices instead of prices at first sale. Nonetheless, when used at aggregated levels, the value data are useful in showing the development trend and for comparison of the relative importance of economic benefit among different types of aquaculture and different groups of farmed aquatic species.
The global trend of aquaculture development gaining importance in total fish supply has remained uninterrupted. Farmed food fish contributed a record 42.2 percent of the total 158 million tonnes of fish produced by capture fisheries (including for non-food uses) and aquaculture in 2012 (Figure 5). This compares with just 13.4 percent in 1990 and 25.7 percent in 2000. Asia as a whole has been producing more farmed fish than wild catch since 2008, and its aquaculture share in total production reached 54 percent in 2012, with Europe at 18 percent and other continents at less than 15 percent.
Million tonnes Percentage Million tonnes Percentage
Million tonnes Percentage Million tonnes Percentage
Million tonnes Percentage Million tonnes Percentage