CURCUMIN QUANTIFICATION IN DOSAGE FORMS USING HIGH PERFORMANCE LIQUID CHROMATOGRAPHY* Ida Musfiroh1), Wiwiek Indriyati1), Yasmiwar Susilawati2), Asri Percekawati1) 1) Laboratory of Pharmaceutical Analysis, Faculty of Pharmacy, Universitas Padjadjaran
2) Laboratory of Pharmacognocy, Faculty of Pharmacy, Universitas Padjadjaran
ABSTRACT
Curcumin quantification in dosage forms using high performance liquid chromatography
(HPLC) has been carried out. This experiment was aimed to determine analysis conditions to be
applied in curcumin dosage form analysis using HPLC. The experiment has been done with the
following steps: mobile phase preparation, instrument preparation, working solution preparation
followed by precision assay, accuracy assay, standard curve estimation, and sample measurement.
The chosen condition was HPLC, LC-10AT, Shimadzu; column Shimadzu C18, VP-ODS, 150L
4.6; acetonitrile-2% acetic acid (45:55) as mobile phase; acetonitrile as solvent; detection at 420
nm; flow rate 1.2 mL/min. The result showed a correlation coefficient value was 0.9999, recovery
value for accuracy assessment was 99.50%, variation coefficient for precision was 1.33%, limit of
detection was 0.7816 ppm, and limit of quantification was 2.6053 ppm. Thus, the analytical method
using HPLC for curcumin were feasible for curcumin quantification in dosage forms. This method
has been applied for measuring three curcumin dosage forms A, B, C, and one curcumin raw
material D. Samples A, B, C, and D measurement gave 105.86, 87.12, 10.71, and 130.35%,
respectively.
INTRODUCTION
Curcumin is a principal curcuminoid of Indonesian spice turmeric. Curcumin is an
orange-yellow coloring principle obtained by solvent extraction of turmeric. Pharmacology activities for
curcumin are antibacterial, antifungi, antihepatotoxic, analgesic, antiinflammation, anticholesterol,
choleretic, antioxidand, and so on. Cholagogum activity is marked by increase of bile production
and secretion that worked choleretic and cholekinetic (Sidik 1992). By increasing bile secretion, it
will decrease solid particles in gallbladder. This condition reduces bile cholic, stomach puffing
caused by fat metabolism disorder, and lower blood cholesterol level (Dalimartha 2001). Curcumin
and xanthorrizol are marker compounds in curcuma rhizomes (Badan POM 2004). Marker is a
biological active substance marking or the major compound in a simplisia.
Research of dosage form with herbal drugs as raw material nowadays focused on isolation,
identification, and pharmacological study of active substance, while quantitative analysis of active
substance in herbal drug that might be unstable after distribution is rarely found. Curcumin
quantitative analysis in 1983 were carried by high performance liquid chromatography (HPLC)
method using Nucleosil-NH2 column and reversed phase with ethanol as mobile phase, and
fluorometer detector. Some curcuminoid analytical methods using HPLC such as mix of
acetonitrile:acetic acid 5% (51:49) as mobile phase and ultraviolet detector, trifluoroasetic
acid:water (40:60) and visible detector, acetonitrile:acetic acid 0,25% and visible detector, and
acetonitrile:acetic acid 7,6% (55:45) with visible detector. The relative polar property of
curcuminoid and consisting hydroxyl chromophore group makes its quantitative analysis able to be
carried out by using reversed phase system with octadesilsilane column and ultraviolet-visible
detector. Then this research carried out curcumin quantification in dosage forms using HPLC
reversed phase system equipped with visible detector.
MATERIAL AND METHOD Material
The materials used were curcuminoid (Sigma) and acetonitrile (JT Baker).
Equipment
HPLC, LC-10AT, Shimadzu; Column: Shimadzu C18, VP-ODS 150L 4.6; Membrane filter 0.45 µm; Syringe filter 0.45 µm.
Determination of Analysis Condition a. Mobile phase preparation
1. An amount of 20 mL glacial acetic acid measured then put into 1 L beaker glass; 980 mL aqua
bidestilata was the added. The mixture was stirred using magnetic stirrer for 10 minutes to obtain
homogeneous solution. The solution was then filtered by pump filter; the filtrate was placed in
Erlenmeyer flask and degassed. The solution was then placed into mobile phase bottle and labeled
FG-Ac 2%.
2. An amount of 1 L acetonitrile was placed in beaker glass. The solution was filtered by pump
filter then placed in mobile phase bottle and labeled FG-ACN.
b. Instrument Optimation
HPLC column was cleaned up by elution, filtration, and degasion. Elution runs for 1 hour,
conditioned by eluting mobile phase 2% acetic acid and acetonitrile (45:55) for 30 minutes and at
the same time it was run for baseline.
c. Working solution preparation
For standard solution 100 ppm, 50 mg curcuminoid standard was weighed accurately, diluted
in 50 mL volumetric flask until the limit mark with acetonitrile, then 2.5 mL was taken and diluted
into 25 mL volumetric flask with the same solvent. Procedures for other standard concentrations
were done similarly.
d. Linearity and Range Study
Six concentrations of curcuminoid standard solution were made: 5, 10, 20, 40, 80, and 100
ppm. Each solution was filtered by syringe filter 0.45 µm. The solutions were injected into injector
once for each time and the area under curve was recorded and measured for the r2 and r values.
e. Presicion Study
Ten solutions of 20 ppm curcuminoid were made for standard solutions. Each solution was
filtered by syringe filter 0.45 µm. The solutions were injected into injector once for each, and then
the area under curve was recorded and measured for the coefficient variation values (CV 1).
f. Accuracy Study
Three concentrations of curcuminoid standard solution were prepared for 20, 40, and 80 ppm.
Each solution was filtered by syringe filter 0.45 µm. The solutions were injected into injector three
times for each silution and then area under curve was recorded and measured for the average
recovery values.
g. Limit of Detection and Limit of Quantification Study
Six concentrations of curcuminoid standard solution were prepared: 5, 10, 20, 40, 80, and 100
ppm. Each solution was filtered by syringe filter 0.45 µm. The solutions were injected once for each
time and then the area under curve was recorded and measured for the standard deviations, limit of
deviation (LOD), and limit of quantitation (LOQ) values.
h. Standard curve estimation
Six concentrations of curcuminoid sandard solution were prepared: 5, 10, 20, 40, 80, and 100
ppm. The solutions were injected into injector once for each and the area under curve was recorded
and measured for the correlation coefficient in linear regression equation (Y = ax + b).
Quantitative Analysis
a. Sample solution preparation
1. Dosage form sample. Two samples of tablet were weighed and powdered to homogeneous.
The powder sample was weighed for 1 dosage and diluted into 25 mL volumetric flask; 5 mL
solution was taken and diluted with the same solvent into 10 mL in a volumetric flask. The solution
was filtered with 0.45 µm Whatman paper, and placed into HPLC vials. For capsule dosage form,
similar steps were carried out as for tablet, with adjusted dilution for curcuminoid concentration in
sample.
2. Curcuminoid raw material sample. Fifty mg curcuminoid sample was weighed accurately,
diluted in 50 mL volumetric flask with acetonitrile, and then 2.5 mL of the solution was taken and
diluted into 25 mL volumetric measure flask with the same solvent. The solution was filtered with
0.45 µm Whatman paper, and placed into HPLC vials.
b. Concentration measurement
Eighty ppm solution from the stock solution of four samples was injected into injector twice
for each sample. The area under curves were recorded and plotted into standard curve linear
regression equation.
RESULTS AND DISCUSSION
The chosen experiment condition obtained for HPLC (LC-10AT, Shimadzu. Column:
Shimadzu C18, VP-ODS 150L 4.6) was using mobile phase consisted of acetic acid 2% and
acetonitrile 55:45. The chosen solvent was acetonitrile. The curcumin linear regression curve was y
= 36300x – 2771.6, with correlation coefficient r = 0.9999. Recovery results at nine concentrations
measured in this experiment gave 99.50%. The presicion study resulted from ten concentrations
measured in this experiment gave variation coefficient of 1.33%. LOD and LOQ study gave 0.7816
ppm and 2.6053 ppm, respectively.
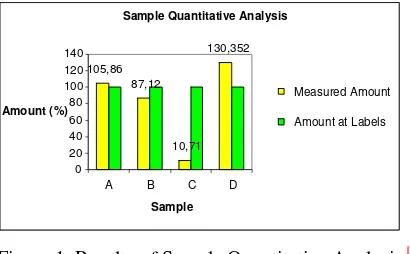
Sample Quantitative Analysis
From three dosages form samples and one curcuminoid raw material samples were as
follows: average concentration of A: 105.86%, B: 87.12%, C: 10.71%, and D: 130.35%.
Figure 1 Results of Sample Quantitative Analysis
Sample Quantitative Analysis
105,86 87,12
10,71 130,352
0 20 40 60 80 100 120 140
A B C D
Sample Amount (%)
Measured Amount
Amount at Labels
The method used in this experiment refers to Yang et al. (2006) experiment, however some
conditions such as mobile phase, flow rate, and injection volume were not applied to this
experiment. They carried out curcumin analysis in Gan Zhi Ping capsules using Zorbax C18 column,
mobile phase acetonitrile-7,6% acetic acid (55:45), flow rate 1mL/minute and injection volume 10µL, while the detection run at 420 nm. We conclude that the use of this method does not guarantee a good accuracy and precision when applied at different place and condition. Therefore, it
is necessary to run an analytical validation method. Analytical validation method is an observation
on certain parameters, based on laboratory experiment to prove that those parameters meet their
requirements. However, a valid method in a certain condition is not a guarantee to be valid in other
conditions.
The mobile phase used in this experiment was mixture of acetonitrile and 2% acetic acid.
This is results of several trials until we got the best condition at 2% acetic acid for composition
(45:55) with acetonitrile. Curcumin was observed as the last peak eluted. Tonnesen and Karlsen
(1983) reported that curcuminoid from turmeric eluted at the first peak was bidesmethoxycurcumin,
followed by desmethoxycurcumin and curcumin. The method validation from the chosen conditions
was started with standard curve estimation. The standard curve made from six concentrations of
standard solutions at the range of 5 to 100 ppm gave a correlation coefficient (r) 0.9999. This value
is taken from the third peak of chromatogram which was assumed as curcumin, as observed in the
previous experiment and based on the largest area under curve considering curcumin as major
compound of curcuminoid.
Accuracy was estimated by recovery study using direct comparation with the standard. The
study used three different concentrations of standard solutions, which is 20, 40, and 80 ppm, with
three replications for each measurement. The recovery value was 99.50%. This value meets the
requirement for accuracy assay, which must at the range of 98-102%. Presicion was estimated by
measuring ten standard solutions with the same concentration (20 ppm). From ten solutions
measured, the coefficient value was 1.33%. This value also meets acceptance criteria for precision
assay, which must below 2%.
Curcumin Quantitative Analysis in Samples
Samples in this experiment were three curcuminoid dosage form samples and one
curcuminoid raw material sample. Sample A, B, and C are the dosage form samples, while sample
D is raw material sample. Selection of these samples was run randomly to dosage forms with
curcuminoid as active ingredient, whether as single ingredient or in a mixture with any ingredients,
method application on curcuminoid isolation from nature material. This raw material estimation
may be useful for small industry that does not own analytical method for curcumin quantitative
analysis.
Each samples then measured twice. Sample A measurement gave curcumin concentration
105.86% from its real value on the label (100%). Higher concentration may caused by inaccurate
production or tolerancy from analytical method. Curcumin concentration in sample B was 87.12%.
It might be caused by inaccurate production or curcmin degradation during distribution and storage.
However, the incorret value still meets the requirement range. For sample C, the result was only
10.71% curcumin. This value is far away from its real value on the label and did not meet the
requirements. The deviation that very far from the true value may cause a different indication.
Sample D showed curcumin concentration of 130.35% from the label. This value is far above its
true concentration on the label, which was 80%. It might caused by improper isolation procedure
and quantitative analysis on label, and also tolerancy from the method.
CONCLUSIONS
From the results above we can conclude that curcumin can be measured by HPLC reversed
phase system, using C18 column; acetonitrile-2% acetic acid as mobile phase in a ratio of 45:55 and
acetonitrile as solvent. Accuracy and precision is fulfilled by 99.50% for recovery, and variation
coefficient for presicion is 1.33%. Whereas the limit of detection was 0.7816 ppm, and limit of
quantification was 2.6053 ppm. With this analytical method, curcumin concentration in samples can
be determined for samples A, B, C, and D (from the concentrations written in the label) as 105.86,
87.12, 10.71, and 130.35%, respectively.
REFERENCES
Badan POM RI. 2004. Monografi Ekstrak Tumbuhan Obat Indonesia. Volume 1. Jakarta: Badan
POM RI.
Dalimartha S. 2001. Atlas Tumbuhan Obat Indonesia. Volume 2. Jakarta: Trubus Agriwidya.
Depkes RI. 1995. Farmakope Indonesia. Volume 4. Jakarta: Departemen Kesehatan.
Harmita. 2004. Petunjuk Pelaksanaan Validasi Metode dan Cara Perhitungannya. Majalah Ilmu
Kefarmasian 1:117-135.
Ibrahim S. 1998. Pengembangan Metode Analisis Menggunakan Kromatografi Cair Kinerja Tinggi.
Seminar on HPLC Application for Analysis of Drugs, Food, and Environment. Bandung:
Department of Pharmacy, Institut Teknologi Bandung. p. 1-19.
Janaki N, Bose JL. 1967. An improved method for the isolation of curcumin from turmeric
(Curcuma longa L.). J Indian Chem Soc 44: 985-986.
Mulja M, Suharman. 1995. Analisis Instrumenttal. Surabaya: Airlangga University Press. p.
236-259, 279-285.
Pothitirat W, Supabphol R, Gritsanapan W. 2004. Comparison of Free Radical Scavenging Activity
and Curcuminoids Content of Turmeric Extracts Using Different Methods of Extraction.
http://www.mahidol.ac.th. [24 Feb 2007].
Sidik, Moelyono, Muhtadi A. 1992. Temulawak (Curcuma xanthorrhiza Roxb.). Phyto Medica,
Jakarta. Hal. 26-41.
Snyder LR, Glajch L, Kirkland JJ. 1997. Practical HPLC Method Development. New York: John
Wiley. p. 15-49.
Tonnesen HH, Karlsen J. 1983. High Performance Liquid Chromatography of Curcumin and
Related Compounds. J Chrom 259:367-371.
Tonnesen HH, Karlsen J. 1985. Studies on Curcumin and Curcuminoids: Alkaline Degradation of
Curcumin. Z. Lebens. Unters Forsch 180: 132-134.
Tonnesen HH. 1986. Chemistry, Stability, and Analysis of Curcumin, A Naturally Occuring Drug
Molecule. Research Report. Norway: University of Oslo.
Yang M, Pan HL, Xu HL. 2006. Determination of Curcumin in GanZhiPing Capsules by
RP-HPLC. http://www.shouxi.net. [24 Feb 2007].