Detection of Chloramphenicol Residue in Bovine Meat Using
Liquid Chromatography Mass Spectrometry
Widiastuti R, Anastasia Y
Toxicology Department, Indonesian Research Center for Veterinary Science Jl. RE Martadinata 30, Bogor 16114 Indonesia
E-mail: [email protected]
(Diterima 16 Januari 2014 ; disetujui 11 Maret 2014)
ABSTRAK
Widiastuti R, Anastasia Y. 2014. Deteksi residu kloramfenikol pada daging sapi menggunakan Kromatografi Cair Spektrometri Masa. JITV 19(1): 74-79. DOI: http://dx.doi.org/10.14334/jitv.v19i1.997
Klormfenikol (chloramphenicol = CAP) adalah antibiotika berspektrum luas yang telah dilarang penggunaanya di banyak negara oleh karena menimbulkan efek samping yang serius terhadap kesehatan manusia. Instrumentasi yang digunakan dalam mendeteksi CAP dalam pangan harus mampu menunjukkan batas kemampuan terendah yang dibutuhkan (minimum required performance limit = MRPL) pada 0,3 ng/g. Tujuan dari penelitian ini adalah untuk mengembangkan metoda deteksi residu CAP pada daging sapi menggunakan kromatografi cair spektrometri masa (KCSM) dan mengetahui keberadaan residu CAP pada 36 sampel daging sapi dari pasar lokal dan 16 sampel daging impor. Kolom yang digunakan adalah kolom fasa terbalik C18 dan dipisahkan menggunakan fasa gerak campuran air-asetonitril (1:1) pada laju alir 0,2 mL/menit serta diionisasi dengan electron spray ionisation (ESI) ion negatif. Hasil validasi metoda untuk parameter uji linearitas menunjukkan nilai koefisien korelasi (R2) sebesar 0,9981 untuk kalibrasi dengan konsentrasi 0,125; 0;25; 0;63; 1,00 dan 2,00 ng/g. Uji perolehan kembali dari fortifikasi pada tiga tingkat konsentrasi yang berbeda (0,25; 0,50 dan 1,00 ng/g) adalah 77,5; 97,3 dan 83,4% untuk masing-masing konsentrasi fortifikasi. Nilai batas decision dan batas kemampuan masing-masing adalah 0,15 ng/g dan 0,17 ng/g. Hasil analsis terhadap 52 sampel yang diuji menunjukkan bahwa residu CAP terdeteksi pada 9 sampel pada kisaran konsentrasi 0,14 hingga 2,70 ng/g dan 6 diantaranya melebihi MRPL. Oleh karenanya, untuk menjamin penyediaan pangan yang aman bagi konsumen, kewaspadaan dan monitoring terhadap residu CAP pada pangan asal ternak perlu ditingkatkan.
Kata Kunci: Kloramfenikol, Residu, KCSM, Daging Sapi
ABSTRACT
Widiastuti R, Anastasia Y. 2014. Detection of chloramphenicol residue in bovine meat using Liquid Chromatography Mass Spectrometry. JITV 19(1): 74-79. DOI: http://dx.doi.org/10.14334/jitv.v19i1.997
Chloramphenicol (CAP) is a broad spectrum antibiotic that has been banned in many countries due to its serius side effect to human. Detection of CAP residue in food has been determined to a minimum required performance limit (MRPL) of 0.3 ng/g. The purpose of this research was to conduct the analysis of CAP residue in bovine meat by using LCMS and to study the presence of CAP residue in marketed bovine meat samples. LC separation was done on a Shimpack column C18 with ammonium acetate 10 mM/water as mobile phase, and ESI-MS analysis in negative ion mode. The coefficient of determination, R2 = 0.9981 at concentration of 0.125, 0.25, 0.63, 1,00 and 2.00 ng/g. Recovery at three fortification levels (0.25, 0.50 and 1.00 ng/g) was in the range 77.5, 97.3 and 83.4%. The decision limit and the detection capability were 0.15 ng/g and 0.17 ng/g respectively. Analysis results of 52 marketed samples showed that CAP residue were detected in 9 samples in the concentration range of 0.14 to 2.70 ng/g and 6 among those positive samples were above the MRPL value. Therefore, it is important to increase the awareness and also to monitor regularly CAP residues in food originated from animal to provide safe food for the consumers.
Key Words: Chloramphenicol, Residue, LCMS, Bovine Meat
INTRODUCTION
Chloramphenicol (CAP) is a broad-spectrum antibiotic with historical veterinary uses in all major food-producing animals and with current uses in humans and companion animals. It is effective against both Gram-positive and Gram-negative organisms, rickettsiae, chlamydiae, and mycoplasmas. CAP has
shown serius side effect to human, cause bone marrow depression and a severe aplastic anemia (Reeves 2012). The International Agency for Research on Cancer (IARC) in 1990 assigned CAP in group 2A and considered as ‘‘probably carcinogenic to humans’’.
products, honey and eggs might be exposed to potentially harmful levels of drug residues which also contribute to the development of resistant strains of bacteria and too serious health problems (Ferguson et al. 2005). For these reasons, the use of CAP was banned by the European Union (EU) and other countries includes the USA, Canada, Australia, Japan and China, due to the potential health risk posed by its traces in method (EC 2003). Whereas, Indonesian government determined for CAP maximum residue level (MRL) of 10 ng/g in meat, egg and milk (DSN 2000).
Even CAP was banned in some countries, it may still be in use in some developing countries including Indonesia (Latif 2004) because of its low cost (Mottier et al. 2003; Ferguson et al. 2005). Therefore, despite legal prohibition on its use in domestic animals, there is evidence suggesting that CAP may be widely used in cattle industry.
Numerous chromatographic methods for determining CAP in various matrices have been reported such as GC with electron capture detector (Pfenning et al. 2000) and HPLC (Posyniak et al. 2003; Samouris et al. 2003). The GC-ECD analysis required derivatization which lengthens the preparation procedure. Meanwhile, the GC-MS technique is unsuitable for CAP detection at level less than 2 ng/g due to insufficient detector sensitivity and selectivity in the electron impact mode (Gantverg et al. 2003). The HPLC-UV method was often disturbed by interfering peaks and did not provide any structural or fragmentation information of the target compound. Those methods also have a main drawback of difficulties in reaching MRPL requirement of 0.3 ng/g. The use of liquid chromatography tandem to MS (LC/MS) offers a rapid, simplified, specific and sensitive (Penney et al. 2005; Rodziewicz & Zawadzka 2008) even not as superior as LCMSMS that provides more complete ionization precursors at lower levels than LC/MS that useful in confirmation purpose.
Nowdays, the use of LCMSMS is common to determine CAP residues in meat, poultry meat, seafood, egg, honey, milk, plasma and urine (Ronning et al. 2006; Siqueira et al. 2009). However, as far as we know, no study concerning the determination of CAP in animal products which detected by liquid chromatography (LC) has been published in Indonesia at concentration lower than the MRPL (0.3 ng/g). The lowest detection limit of CAP reported in Indonesia was
0.31 ng/g by LCMS which meant still above the recommended MRPL (Muchlisa 2012).
In order to fulfill the MRPL requirement for CAP detection, this study aimed to demonstrate the ability of LCMS to detect CAP residue in bovine meat at least at the level of 0.3 ppb and also to determine the presence of its residue in local meat samples marketed in Indonesia.
MATERIALS AND METHODS
Chemicals
Acetonitrile (HPLC grade), acetonitrile p.a, hexane and ammonium acetate were obtained from Merck (Darmstadt, Germany). Chloramphenicol (P/N C1919) standard was used as CAP reference standard and purchased from Sigma-Aldrich (St.Louis, MO, USA). The stock solution of the CAP reference standard was prepared in acetonitrile at 1000 µg/L and was stored at -20°C. Dilutions of these stock solution were all prepared in Milli-Q water and stored at 4°C. The stability of CAP stock solution at 4°C is at least 6 months. An ultra high purity (UHP) water is processed by Elga Purelab (Lab Water, Veolia Water Solution & for 30 seconds. The sample was eventually centrifuged at 3000 rpm for 10 minutes and the supernatant was transferred to a second polypropylene tube. Another additional 12 mL acetonitrile was added to the remaining sample and the process was repeated. The acetonitrile extracts were combined and added with 10 mL hexane. The extract was then shaked slowly and the hexane layer was aspirated to waste. This step was repeated 2 times. The extract was evaporated to dryness at temperature of 60oC. The residue was dissolved in 1 mL mobile phase of 10 mM ammonium acetate-acetonitrile (60 : 40) and passed through a 0.45 µm (22 mm) Acrodisc PTFE syringe filter (Waters Corp. Milford, USA) into an LC auto-sampler vial.
LCMS conditions
Separation was achieved by a Shimpack column C18 (150 mm x 2.1 mm) (Shimadzu Corp.) in combination with the guard pre-column. The mobile phase was a binary gradient mobile phase of an UHP water (100% A) and an acetonitrile HPLC grade (70% B) at flow rate of 0.2 mL/min. Injection volume (simplo) of 10 μL for standards and samples was applied, and the temperature was maintained at 30oC. Negative ion mode electrospray ionization (ESI) and selected ion monitoring (SIM) of two masses (m/z 321 and 323) were used. Heater block temperature was 200oC, gas temperature 250oC, curved desolvation line (CDL) temperature 250oC
,
drying gas flow 0.1 L/min, nebulizing gas flow (N2) 1.5 L/min. The diagnostic fragment ions of the parent ion of deprotonated molecular ion [M-H]- (m/z 321) and the corresponding isotopic ion (m/z 323) were chosen following the previous study (Krivohlavek et al. 2007) that obtained the most obvious areas of CAP found at m/z 321 and 323. In this study, m/z 321 was chosen as the quantifying ion.Method validation
A method validation is the process of demonstrating that analytical procedures are suitable for their intended use. The validation method includes the determination of linearity (calibration curve), accuracy (recovery study) and limit of detection (LOD) and limit of quantitation (LOQ) and conducted in accordance to the performances criteria (Ellis 2008).
Analysis of marketed samples
A total of 36 of bovine meat samples from traditional and modern markets in Sukabumi, Bandung and Jakarta collected in July-August 2010 and 16 imported samples received in February and March 2011 were analysed using the validated method. Meat samples were stored at -20ºC before analysis.
RESULTS AND DISCUSSION
LCMS detection
Mass spectrometry in conjunction with chromatographic separation (LCMS) is a very powerful combination for identification of an analyte in the extract. Structural information obtained from LCMS generated in the mass spectra from protonated or deprotonated molecules resulting from the compound ions combining with the mobile phases (Jeannota et al.
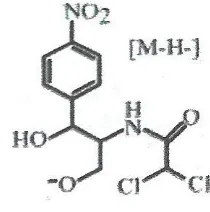
2000). CAP were first analyzed in negative ESI-MS mode to select characteristic ions as the precursors and detected of two m/z 321 (Figure 1) which represents the deprotonated molecule [M-H]- of the isotope of CAP and m/z 323, the isotopic ion which corresponds to the 37
Cl isotope (Penny et al. 2005). The ESI source is suitable for analysis because of the polar nature of CAP.
Figure 1. CAP precursor ion m/z 321 (Siqueira et al. 2009)
A confirmation method for determination CAP in bovine meat using the LC/MS that developed in this research offered simplicity without the use of solid phase extraction (SPE) step for purification. For identification and confirmation purposes of CAP both m/z 321 and 323 ions are necessary to give signal at the same retention time with the analyte in the standard solution and have the same value of the ion intensity ratio both in sample and in sample solution (Marghitas et al. 2010). Therefore confirmation is very specific and can be calculated as ordinary chromatographic separation by comparing to its standard.
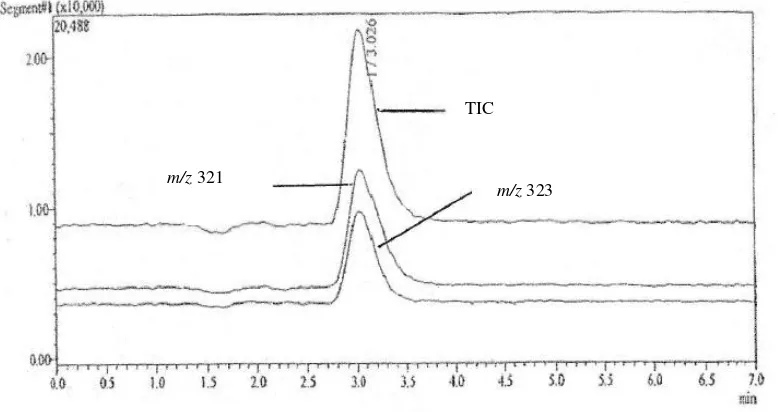
Specificity was determined by analysing 10 injections of CAP standard solution and blank samples. The peaks should represented m/z 321 and 323. No interfering peaks were observed at the retention time around 3.0 minutes. This allows for clear identification and quantification of all analytes. Typical chromatogram of standard solution containing 1.25 ng/g CAP shown in Figure 2.
Linearity, recovery and limit of reporting level
Figure 2. Chromatogram of a standard solution containing 1.25 ng/g of CAP
y = 161144x + 3839.2
R2 = 0.9981
0 70000 140000 210000 280000 350000
0 0.25 0.5 0.75 1 1.25 1.5 1.75 2
Concentration (ng/g)
In
te
n
si
ty
(A
U
)
CAP
Figure 3. Calibration curve of CAP standard solution on several concentrations
The accuracy of analysis method can be evaluated from the recoveries at three different spiked levels of 0.25, 0.50 and 1.00 of CAP standards into blank samples (n = 3) and subjected to the complete analytical procedure in determining the recovery of the method as presented on Table 1.
The recoveries gave a satisfacory results in the range of 77.5% to 97.3% and reproduciblity (RSD) in the range of 2.9 to 6.2%. These values comparable and more sensitive compared to the study conducted by Penney et al. (2005) for spiked levels of 0.5 to 3.0 ng/g CAP and obtained the recoveries within 83 to 90%.
The limit of reporting level (LRL) for the method, established as the lowest spiked level for which recovery and precision were reasonable at 7 replicates, was 0.125 ng/g. All results below the LRL (0.125 ng/g)
decision limit (CCα) and the detection capability (CCβ) were evaluated in accordance with the guidelines in 2002/657/EC. The CCα was expressed as the concentration corresponding to the lowest calibration level (0.125 ng/g) plus 2.33 x standard deviation (SD) of the y intercept calculated. CCβ was calculated as CCα + 1.64-fold the standard deviation (SD) of the within-laboratory reproducibility at the CCα. The CCα and CCβ were obtained at 0.15 ng/g and 0.17 ng/g respectively. These were both well below the MRPL of 0.3 ng/g. Those values were also lower than those reported by Penney et al. (2005) nor Siqueira et al. (2009). However, its performance was not as good as the research conducted by Krivohlavek et al. (2007) who used the same brand of the LCMS and was able to detect the CAP residue in milk and performed a LOQ of 0.1 ng/g.
Monitoring CAP residue in marketed beef samples
In order to verify the practical applicability of the validated method, analysis of CAP in 37 meat samples was conducted. The samples collected from local markets in West Java island of Sukabumi municipal (8 samples), Bandung city (9 samples), Jakarta city (20 samples) and 16 imported bovine meat (no information on the origin country) from Tanjung Priok Port.
The overall results revealed that the contamination occurred among 9 (17.3%) samples, i.e. 4 samples collected from Bandung and Jakarta contained CAP in concentration range of 0.15 to 1.92 ng/g and5 imported samples at the concentration range of 0.14 to 2.70 ng/g, m/z 321
TIC
Table 1. Recoveries for CAP detection in bovine meat
CAP spiking concentration (ng/g)
Measured recovery (ng/g)
Mean recovery (%) RSD (%)
I II III
0.25 82.4 77.2 72.8 77.5 6.2
0.50 97.4 101.6 93.0 97.3 4.4
1.00 82.6 86.1 81.5 83.4 2.9
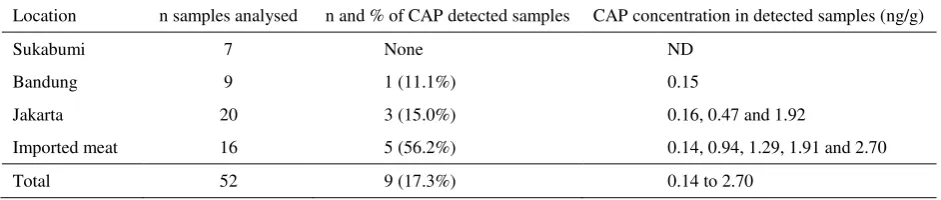
Table 2. CAP residues in bovine meat from local markets and imported samples
Location n samples analysed n and % of CAP detected samples CAP concentration in detected samples (ng/g)
Sukabumi 7 None ND
Bandung 9 1 (11.1%) 0.15
Jakarta 20 3 (15.0%) 0.16, 0.47 and 1.92
Imported meat 16 5 (56.2%) 0.14, 0.94, 1.29, 1.91 and 2.70
Total 52 9 (17.3%) 0.14 to 2.70
ND = not detected (≤ 0.125 ng/g)
Sukabumi. The rest of 43 samples (82.7%) did not show any CAP residue and safe for human consumption. Six among 9 positive samples were above the MRPL (0.3 ng/g) in the range of 0.47 to 2.70 ng/g CAP. The imported samples (usually from Australia or New Zealand) indicated as positive samples which CAP concentration higher than the local samples.
The study above was different from the study conducted in Brazil (Siqueira et al. 2009) that shown none among 646 samples analysed above 0.1 ng/g. A monitoring CAP residues conducted in Croatia (Bilandzic et al. 2011) on 109 bovine meat samples showed that the contamination levels of the positive samples were under the MRPL. A monitoring program conducted in Oman also presented the occurrence of CAP residues in goat and sheep meat (Mahgoub et al. 2006) meant that CAP was being u not only in cattle industry but also in other animals such as chicken.
Although the contamination level of positive samples shown in this study below the Indonesian regulation of 10 ng/g, it is still important to increase the awareness and to monitor regularly to avoid the occurrence of CAP residues in food originated from animal. The probability for contamination of CAP residue might be arose from illegal use. Other possibility on its occurrence may be through ingestion of naturally occurring CAP from the environment. There was an evidence of the occurence CAP naturally in Artemesia family plant originated from Mongolia at levels ranging from 0.1 to 450 µg/kg in (Berendsen et al. 2010), and also that CAP produced in the soil and the plants (grass) absorbed CAP through their root systems.
The results of this study demonstrated that beef samples for human consumption marketed in some cities in West Java, contained rare case of CAP residue. The seemingly rare occurrence of CAP residue in the meat probably indicates of good application of veterinary practices by the farmers. On the other hand, high concentration of CAP residue in small portion of the samples analysis, could suggest a high risk of illegal use of chloramphenicol in beef industry so that it needs a control on the distribution of the illegal drug.
CONCLUSION
A detection method for determination CAP in bovine meat could be achieved using the LC/MS. In this research decision limit (CCα) and detection capability (CCβ) were obtained at 0.15 ng/g and 0.17 ng/g respectively. These are both well below the MRPL of 0.3 ng/g.
ACKNOWLEDGEMENT
This research was financially supported by the Indonesian Agency for Agricultural Research and Development, Ministry of Agriculture. The authors are grateful to all the contributors who gave the permission to conduct this research and Mr. R. Firmansyah SSi for his valuable helping in this research.
REFERENCES
Bilandzic N, Varenina I, Kolanovic BS. 2011. Control of chloramphenicol in samples of meat, meat products and fish. MESO. XIII:192-197.
Berendsen B, Stolker L, De Jong J, Nielen M, Tserendorj E, Sodnomdarjaa R, Cannavan A, Elliott C. 2010. Evidence of natural occurrence of the banned antibiotic chloramphenicol in herbs and grass. Anal Bioanal Chem. 397:1955-1963.
[DSN] Dewan Standarisasi Nasional. 2000. Batas maksimum cemaran mikroba dan batas maksimum residu dalam bahan makanan asal hewan. Standar Nasional Indonesia SNI-01-6366-2000.
[EC] European Commision. 2003. Commission Decision of 13 March 2003 amending Decision 2002/657/EC as regards the seating of minimum required performance limits (MRPLs) for certain residues in food animal origin (2003/18/EC), Off Eur Commun. L71:17.
Ellis RL. 2008. Developmen of veterinary drug residue control by Codex Allimentarius Commision : a review. Food Add Contam. 25:1432-1438.
Ferguson J, Baxter A, Young P, Kennedy G, Elliott C, Weigel S, Gatermann R, Ashwin H, Stead S, Sharman M. 2005. Detection of chloramphenicol and chloramphenicol glucuronide residues in poultry muscle, honey, prawn and milk using a surface plasmon resonance biosensor and Qflex® kit chloramphenicol. Anal Chim Acta. 529:109-113.
Gantverg A, Shishani I, Hoffman M. 2003. Determination of chloramphenicol in animal tissues and urine by liquid chromatography-tandem mass spectrometry versus gas chromatography-–mass spectrometry. Anal Chim Acta. 483:125-135.
Krivohlavek A, Barušiæ L, Šmit Z, Bošnir J, Puntariæ D. 2007. HPLC-MS Analysis of chloramphenicol residues in milk and powdered milk products. Kem Ind. 56:53-56.
Latif H. 2004. Analysis of antibiotic residues in milk powder using some analytical methods. Forum Pascasarjana. 27:41-52.
Mahgoub O, Kadin IT, Mothershaw A, Al Sadjali SA and Annamalai K. 2006. Use of enzyme linked Immunosorbent Assay (ELISA) for detection of
antibiotic and anabolic residues in goat and sheep meat. World J Agric. 2:298-302.
Mottier P, Parisad V, Gremaud E, Guy PA, Stadler RH. 2003. Determination of the antibiotic chloramphenicol in meat and seafood products by liquid chromatography electrospray ionization tanadem mass spectrometry. J Chromatogr A. 994:75-84.
Muchlisa FN. 2012. Penetapan kadar residu kloramfenikol pada daging sapi yang beredar di pasaran secara Liquid Chromatography-Mass Spectrometry (LC-MS) (skripsi S1). [Jakarta (Indones)]: Universitas Pancasila.
Penney L, Smith A, Coates B, Wijewickreme A. 2005. Determination of chloramphenicol in milk, eggs, and tissues by liquid chromatography mass spectrometry. J AOAC Int. 88:645-653.
Pfenning AP, Roybal JE, Rupp HS, Turnipseed B, Gonzales SA, Hurlbut JA. 2000. Simultaneous determination of residues of chloramphenicol, florfenicol, florfenicol amine, and thiamphenicol in shrimp tissue by gas chromatography with electron capture detection. J AOAC Int. 83:26-30.
Posyniak A, Zmuddzki J, Niedzielska J. 2003. Evaluation of sample preparation for control of chloramphenicol on porcine tissues by enzyme-linked immunosorbent assay and liquid chromatography. Anal Chim Acta. chloramphenicol residues in milk powder by liquid chromatography-elektrospray ionization tandem mass spectrometry. Talanta. 75:846-850.
Ronning HT, Einarsen K, Asp TN. 2006. Determination of chloramphenicol residues in meat, seafood, egg, honey, milk, plasma and urine with liquid chromatography-tandem mass spectrometry, and the validation of the method based on 2002/657/EC. J Chromatogr A. 1118:226-233.
Salita E. 2011. Pemeriksaan residu kloramfenikol pada Udang Windu (Penaeus monodon) dari hasil budidaya tambak secara kromatografi cair kinerja tinggi. (skripsi S1). [Medan (Indones)]: Universitas Sumatera Utara.
Samouris GB, Nathanael H, Tsoukali-Papadopoulou, Papadimitriou N. 2003. Determination of chloramphenicol residues in eggs by high performance liquid chromatography (HPLC). Vet Hum Toxicol. 35:406-409.