Fruit Color Properties of Different Cultivars of Dates
(
Phoenix dactylifera, L.
)
M. Fadel , L. Kurmestegy, M. Rashed and Z. Rashed
UAE University, College of Food and Agriculture, 17555 Al-Ain, UAE;
ae
Lolo, Khalas, Berhi, Fard and Bomaan are among the most famous date cultivars in the United Arab Emirates. Color properties of those cultivars were investigated to explore the possibilities of using them as a segregation criterion. Date image was taken using a digital camera and the color was fragmented into red, green and blue (R, G, B). Using image analysis software, frequency distribution of image pixels colors was calculated and the mean value was used to compare between the different cultivars. Results showed that, color luminosity and all color ingredients (R, G and B) may be used to differentiate between Lolo and Bomaan where the blue should be used to discriminate between Berhi and Bomaan as well as between Berhi and Khalas. This research provides the foundation for a new computerised date variety recognition system.
Keywords: Date Fruits, Fruit Color Properties, Date Fruit Properties, Tamr Color, Phoenix dactylifera, L.
1. INTRODUCTION
Fruit color is an important property as a maturity index, which may be used to demonstrate its readiness for harvesting and to qualify it market wise. Machine vision can be used to enable quantitative measurements for qualitative criteria. It is based on different techniques such as image processing and pattern recognition etc.
Few research papers focused on applying machine vision technique on dates. Most of them studied each variety individually. Therefore, it was necessary to study several cultivars of dates altogether to lay the foundation for a machine vision system, which has the capability to differentiate among various date cultivars as well as to estimate sugar content of each variety, if possible.
Automatic segregation of various date fruits cultivars required a deep knowledge of each cultivar physical characteristics. Color ingredients of the fruit are promising distinctive criteria. For human eyes, different cultivars may look very similar. Digital imaging made it possible to derive color ingredients (R, G and B) easily.
Scant research papers in the field of date fruits color properties could be found in the databases. Al-Janobi(1998) Applied the line-scan based vision for inspecting fast moving on a grading conveyor belt date fruits, where it is capable of determining the color/quality of date fruits whereas Adamsen et al. (1999) used the green to red (G/R) ratio for each pixel in an image for cropped images from a digital camera to determine the effects of elevated CO2
2
because of significant international trade in date fruits, the need for objective color measurement for maintaining strict quality standards has become obvious, because of significant international trade in date fruits. They used a Macbeth color checker spectrophotometer to quantify color of date fruits to compare between different date cultivars and for quality control of processed date products in the international trade. In a more advanced step, Al-Janobi (2000) developed a color computer vision system consisting of a microcomputer with an image frame grabber and a charged-coupled device (CCD) color camera for sorting and grading Saudi dates based on color threshold technique. He stated that in the date industry, grading is based on color, size, surface defects and texture. Color is an important factor in distinguishing between acceptable date fruits and damaged or immature dates. The color of acceptable dates is predominantly light amber and relatively uniform in color. And Wulfsohn et al. (1989) in addition to an infrared cutoff filter, used the a color camera to capture date fruit images to determine the relative reflectance in the range of 400-1000 nm for good and defective dates. They noted that the red band image was most effective for detecting defective Majhul dates, the green band image performed best for Zahidi dates.
2. MATERIALS AND METHODS
The five cultivars Lolo, Bomaan, Khalas, and Fard are commonly grown in the Gulf area. Random sample design was utilized and ten samples of each cultivar, containing 40 fruits each, were studied. An image of each sample was captured using a Sony Mavica digital camera. Image resolution was 1912 x 916 pixels. Fluorescent light was used as illumination source as recommended by referenced papers Davies and Perkins (1991). A brief code was developed in Matlab 6.1 in order to analyze color of each image separately and plot the red, green and blue (RGB) frequency distribution (Color Histogram). For each variety, image data for the all ten samples were stacked together to determine its RGB frequency distribution. Meanwhile, standard deviation, mean, and median were calculated for each sample as well as for the stacked data. Microsoft Office Excel 2003 was used to carry out analysis of variance (ANOVA) between means as a statistical tool to find out if there was a significant difference within the same variety as well as between cultivars.
3. RESULTS
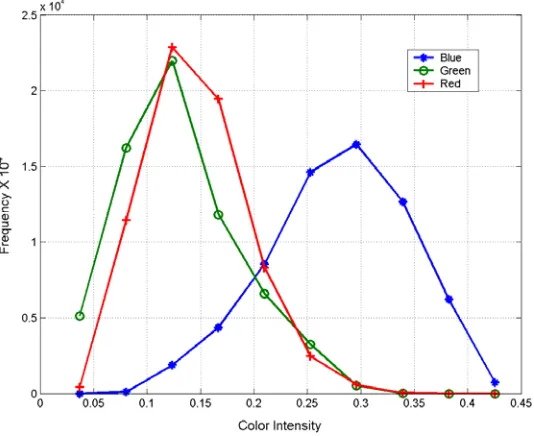
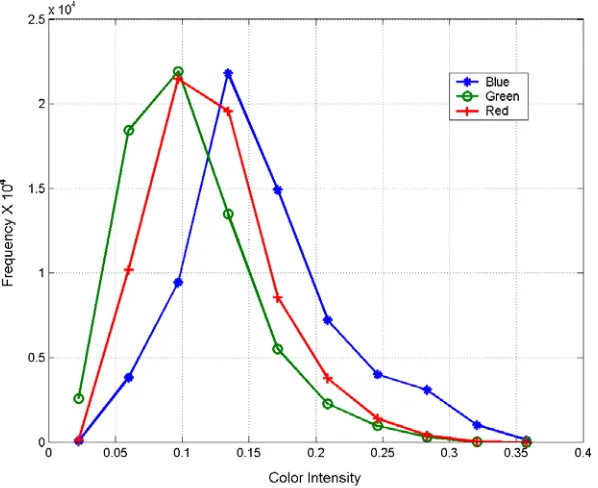
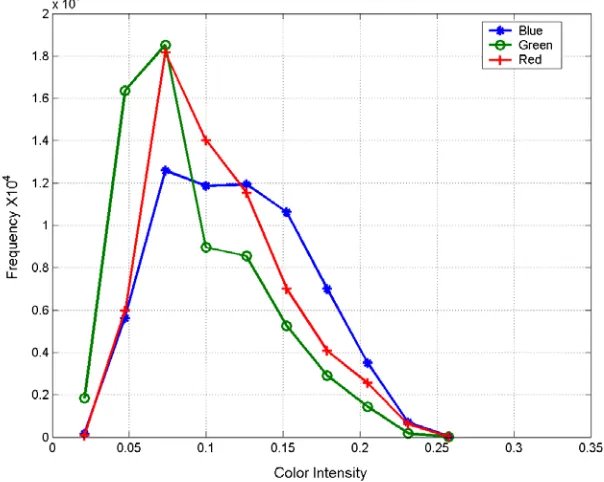
Figure 1,2,3,4 and 5 display frequency distribution of color ingredients R, G and B intensity for Berhi, Bomaan, Khalas, Lolo and Fard respectively. Color intensity is represented on zero to one scale. In Berhi color intensity of R, G and B ranged from 0.03 to 0.26; 0.03 to 0.35 and from 0.13 to 0.45 respectively. However, in Bomaan blue ingredient has wider range than the other two color ingredients as well as in Khalas. On the other hand, in both Lolo and Fard, the three color ingredients are very similar in color intensity range.
Figure 1. Frequency distribution of R, G and B intensity , Berhi cultivar
Figure 2. Frequency distribution of R, G and B intensity, Bomaan cultivar
4
Figure 3. Frequency distribution of R, G and B intensity, Khalas cultivar
Figure 4. Frequency distribution of R, G and B intensity, Lolo cultivar
Figure 5. Frequency distribution of R, G and B intensity, Fard cultivar Table 1. Color ingredients analysis for date cultivars
Intensity M. Fadel, L. Kurmestegy, M. Rashed and Z. Rashed “Fruit Color Properties of Different Cultivars of Dates (Phoenix dactylifera, L.)”. Agricultural Engineering International: the Table 1 shows mean, median and Standard Deviation values of color ingredients of each cultivar. The listed mean values were used to calculate Analysis of Variance (ANOVA) between color ingredients of the five date cultivars. As shown in Table 1, mean values of red of the five cultivars ranged from 0.1087 to 0.1475 with SD ranged from 0.0393 to 0.0467
6
whereas mean values of green ranged from 0.0908 to 0.1246 with SD range from 0.0427 to 0.0539. On the other hand, mean values of blue ranged from 0.1149 to 0.2838 with SD range from 0.0448 to 0.0652.
Figure 6. Frequency distribution of green ingredient of different cultivars
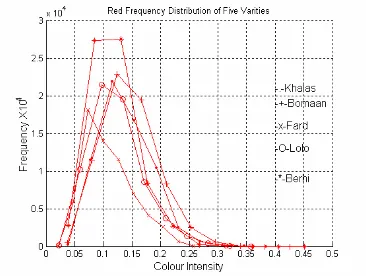
Figure 7. Frequency distribution of red ingredient of different cultivars
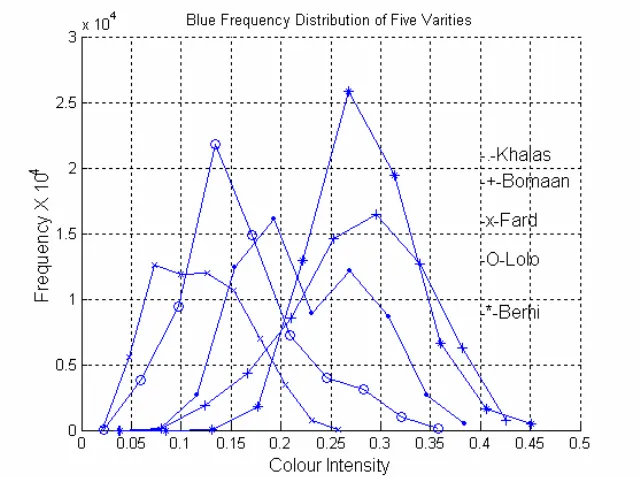
Figure 8. Frequency distribution of blue ingredient of different cultivars
Comparisons between green, red and blue are plotted in Figure 6, 7 and 8 respectively for the five cultivars. both green and red frequency distribution charts (Figure 6 and 7) show that in the five cultivars under investigation, red and green frequency distributions have the same tendency to accumulate in a very narrow range of color intensity with very close frequency values. On the other hand, blue frequency distributions of various cultivars are broadened on a wide range of color intensity and with distinctive frequency values.
Table 2 shows the results of ANOVA test, the displayed results express that there is a significant difference between the two date cultivars located in the corresponding vertical and horizontal cells. For example, red color in both Fard and Berhi are significantly different on significance level of P≤0.05.
Table 2. ANOVA results between the investigated date cultivars
Fard Lolo Khalas Bomaan Significance level P≤0.05 R: red; G: green; B: blue
8
4. DISCUSSION
Frequency distributions of the three color ingredients of each date cultivar are presented in Figures 1, 2, 3, 4 and 5. Blue ingredient in Berhi, Bomaan and Khalas cultivars showed the tendency to occupy the high color intensity end of the X-axis with mean values much higher than the other two color ingredients. In Berhi, the blue mean value was 0.284 while they were 0.118 and 0.125 for red and green respectively. Also, in Bomaan, the mean value of blue was 0.218 while they were 0.150 and 0.133 for red and green respectively. Furthermore, the Khalas blue ingredient mean value was 0.230 while red and green mean values were 0.138 and 0.121 respectively. On the other hand, the mean values of blue, green and red were 0.160, 0.106 and 0.123 respectively and were 0.119, 0.109 and 0.090 respectively for Lolo and Fard cultivars. In Berhi, the blue mean value was 0.284 with standard deviation of 0.048 while the green mean value was 0.125 and standard deviation 0.054. The red mean value was 0.118 and standard deviation was 0.040.
Mean values of red, green and blue of Lolo were 0.124, 0.106 and 0.160 respectively while standard deviation values were 0.044, 0.046 and 0.056 respectively. On the other hand, mean values of red, green and blue of Fard were 0.109, 0.091 and 0.119 respectively while standard deviation values were 0.012, 0.043 and 0.045 respectively. For Berhi, Bomaan and Khalas, the blue ingredient is the most influentialcolor ingredient upon fruit color. For both Lolo and Fard cultivars, the three color ingredients tend to have very close mean values and standard deviation.
Although red and green ingredients of the studied cultivars tended to accumulate in a very narrow zone of the frequency distribution charts (Figure 6 and 7), the results in table 2 show that there is a significant difference between green ingredients in two cases, between Fard and Berhi and between Fard and Bomaan. On the other hand, significant differences between red mean values were found in two cases, between Fard and Berhi and between Bomaan and Berhi. Frequency distributions of blue ingredients of the five cultivars are widely distributed along the color intensity axis (Figure 8). Table 2 shows that there significant differences between blue mean values between Fard and Berhi; Fard and Bomaan; Lolo and Bomaan and Khalas and Bomaan.
5. CONCLUSIONS
Using the unaided eye, color differences may not be the best criteria to differentiate between date cultivars. Digital imaging equipment is used to represent images in a mathematical format. Color components red, green and blue (R, G, B) may be used to segregate various date fruits from cultivars.
The following conjectures can be concluded from the results of studying color properties of date fruits:
a. Red ingredient intensity can be used to discriminate Berhi from Bomaan and Berhi from Fard.
b. Green ingredient intensity can be used to distinguish between Fard and Berhi and Fard and Bomaan.
c. Blue ingredient intensities can be used to differentiate between Fard and Berhi; Fard and Bomaan; Lolo and Berhi and Khalas and Berhi.
d. More complicated mathematical procedures may be employed to utilize the resulted information in order to identify each cultivar.
6. REFERENCES
Al-Hooti S. and Sidhu, J.S., 1997. Objective color measurement of fresh date fruits and processed date products. Journal of Food Quality, 20(3), 257-266
AL-Janobi, A.A. 1998. Color line scan system for grading date fruits. ASAE Annual International Meeting, Orlando, Florida, USA, 12-16 July, ASAE Paper No. 983028.
Al-Janobi, A.A. 2000. Date inspection by color machine vision. Journal of King Saud University, 12,(1),69-79.
Adamsen, F.J.; Pinter, P.J.; Barens, E.M.; LaMorte, R.L.; Wall, G.W.; Leavitt, S.W.; and Kimball, B.A. 1999. Measuring wheat senescence with a digital camera. Crop Science of America, 39(3) ,719-724.
Davies, J. and Perkins, R.M. 1991. Effect of illumination in grading dates. ASAE Paper No. 91-3547.
Williams, E.J. and Adams, S.D. 1996. Machine vision system for inspection of agricultural commodities. United States Department of Agricultural Patents. Washington, D.C. Jan. 30th.
Wulfsohn , D. ; Sarig, Y. and Algazi, R.V. 1989. Preliminary investigation to identify parameters for sorting of dates by image processing. ASAE Paper No.89-6610