31
Mathematics Literacy: An Australian Perspective and Experience
Allan Leslie White
SEAMEO Regional Centre for QITEP in Mathematics [email protected]
A brief listing of five different types of mathematical literacy is provided. The definition used by the Program for International Student Assessment (PISA) is selected and some brief remarks are provided on this program. The performance of Australian students is examined which shows that at the beginning of the new century 2000, Australian educators were feeling comfortable and reasonably satisfied with student performance but by 2016 there was great concern over a consistent decline. The reasons for this decline are briefly discussed with the focus on Australian governmental policies that followed the directions of reform in the United States and Great Britain, and what has been labelled GERM. Current policies have been tried and failed and it is time to look for alternatives. While it is not wise to just copy the programs and policies of another country rather than adapt them due to differences in culture, population diversity, and other factors, nevertheless countries such as Finland can offer alternative paths to be explored. In Australia’s case it would also seem to be unwise to adopt policies and programs of countries who perform worse than it.
Keywords:mathematical literacy, PISA, GERM, TIMSS, high-stakes testing, Finland, market-driven policies, MaRWA, NAPLAN
Introduction
The term mathematical literacy raises many issues and questions for educators and
researchers such as: (1) What are the different views of mathematical literacy and how are they
related to, or distinct from, other similar views such as numeracy, quantitative literacy,
mathematical competence, mathematical proficiency? (2) Why is mathematical literacy on the
agenda of mathematics education? (3) How is mathematical literacy implemented in education
programs and curricula? (4) Is it meant to be a separate subject or an integrated part of
mathematics and what teaching and learning activities and materials exist? (5) How does a
focus on mathematical literacy influence pre-service and in-service teacher education? (6) How
is mathematical literacy situated in comparative studies in mathematics education nationally or
internationally? (7) How is mathematics education being influenced by literacy based studies?
(8) What new and valuable outcomes can be gained from focusing on mathematical literacy
instead of or in addition to traditional mathematical knowledge and skills? (9) What problems or pitfalls may result from such a focus? (10) What are the likely desirable or undesirable
changes of practices in mathematics education resulting from a mathematical literacy focus?
This paper will not attempt to answer all these questions. Instead, it will begin by selecting a
definition from among many and then focus the discussion upon the Australian experience.
There has been an expanding body of research and scholarship focused on school
literacy and numeracy. Within this expansion, the term ‘mathematical literacy’ has emerged.
Jablonka (2003) attempted to define the term, making the distinction that was wider than
32
mathematical knowledge to a specific context. It is literacy for something, and she categorized
five different types of mathematical literacy.
Her list includes mathematical literacy for developing human capital that looked at the
world through mathematical eyes, emphasizing higher order thinking, real world problems, and
underpinned by critical citizenship for participation in public and economic life. Organization for Economic Co-operation and Development (OECD) (2006) suggests that the Program for
International Student Assessment (PISA) is intended to estimate and compare the stock of
human capital. PISA (OECD, 2006) defines mathematical literacy as an “individual’s capacity
to identify and understand the role that mathematics plays in the world, to make well-founded
judgments, and to engage in mathematics in ways that meet the needs of that individual’s
current and future life as a constructive, concerned, and reflective citizen" (p. 72). As a
consequence of this definition, PISA mathematics units usually begin with a description of a
real life context and it is here that a difficulty arises in making the contexts comparable across
differing countries. Irrespective of the large body of criticism around their validity in making
cross country comparisons, the results of the international comparative studies have contributed
to a growing public interest in mathematical literacy.
Second on Jablonka’s (2003) list is mathematical literacy for cultural identity, where mathematics is seen as a pan-cultural universal activity for representing and explaining the
natural world and that all cultures have developed some kind of mathematical capital.
A third list inclusion is mathematical literacy for social change where it becomes a
process of developing a critical consciousness for re-interpreting parts of reality and pursuing
different realities. This recognizes attempts to avoid privileging Western academic
mathematical knowledge by incorporating ethno-mathematical and everyday knowledge into
school mathematics.
A fourth inclusion is mathematical literacy for environmental awareness which is a
process for developing skills and attitudes for understanding the interrelationships between
humans and the natural environment.
In the light of global environmental problems and scientific fallacies, which are conceived as partly caused by technological interventions based on traditional mathematics, a few writers consistently suggest that mathematics itself should be developed into more suitable alternative forms (Jablonka, 2001, p. 97).
The final inclusion is mathematical literacy for evaluating mathematics where all applications of mathematics are seen as value driven and thus the school curriculum requires
criteria for evaluation. The curriculum aims to produce a
33
and to participate in political discussions that draw on statistics and results from mathematical models (Jablonka, 2001, p. 97).
For the purposes of this paper, only one will be adopted and briefly examined in relation
to the Australian experience and that is the definition used by PISA.
Mathematical literacy is an individual’s capacity to formulate, employ and interpret mathematics in a variety of contexts. It includes reasoning mathematically and using mathematical concepts, procedures, facts and tools to describe, explain and predict phenomena. It assists individuals to recognise the role that mathematics plays in the world and to make the well-founded judgments and decisions needed by constructive, engaged and reflective citizens (OECD, 2016, p. 13).
In Australia, the term numeracy is often used synonymously with mathematical literacy,
although in fact its meaning ranges from a narrow ability with number, ability to use
mathematics in different situations; ability to understand the meaning of mathematics (Willis,
1991).
Australia’s Performance
Having chosen to confine mathematical literacy to Jablonka’s (2003) category one fits
with the definition of the PISA which claims to be an international assessment of the skills and
knowledge of 15-year olds.
Figure 1. Cycles of PISA and the major and minor domains of assessment for each cycle (Thomson, De Bortoli, & Underwood, 2016, p. xv).
Member countries of the OECD conduct this program at three year intervals since 2000.
The PISA website (www.oecd.org/pisa) is the official gateway to information and most of the
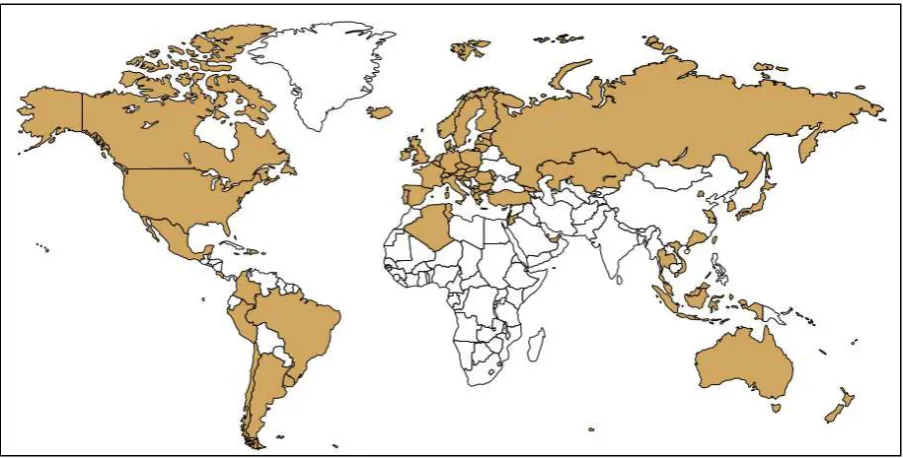
references used in this paper and many other PISA reports can be downloaded. There were 72
countries and economies that participated in PISA 2015, including 35 OECD countries and 37
34
Figure 2. Countries and economies that participated in PISA 2015 (Thomson, De Bortoli, & Underwood, 2016, p. xviii)
PISA mathematical literacy is organized into three broad components: (1) the situations
and contexts in which problems are located and sources of stimulus material, (2) the
mathematical content to which different problems and questions relate, and (3) the
mathematical competencies connected to the real world problem solving required. Of note is
that Pearson which is one of the biggest textbook publishers and providers of professional
development services for teachers around the world has been contracted by OECD to develop
the 2018 PISA test (Lingard, Sellar, Hogan, & Thompson, 2017). The three components are
shown in Figure 3.
35
At the beginning of the new century 2000 Australian educators were feeling comfortable
and reasonably satisfied with student performance as indicated by international studies and they
were unprepared for both a decline in performance and a domestic political war that erupted
involving state and federal bodies as the century progressed.
In the early twenty-first century Australia’s 15-year old students performed very well on the mathematical literacy scales in terms of the knowledge and skills investigated by the
OECD in its PISA for 2000 and 2003 (OECD 2000, 2004). In addition, the Trends in
International Mathematics and Science Study (TIMSS) for 1994/5 and for 2002/03 revealed
that Australian Year 8 students’ achievement in mathematics was significantly higher than the
international average in all content areas considered (Thomson & Fleming, 2004).
Figure 4. Components of the Australian national assessment program (Thomson, Hillman, & De Bortoli, 2013, p. 2)
In the lead up to 2015 PISA, Australia had declared its ambition to be within the top
five countries in PISA by 2025. So serious was it about this ambition that the Australian
Government had incorporated it into the Australian Education Act 2013, then PISA became an
integrated part of an Australian national assessment program which had greatly centralized the
curriculum, introduced corporate management models for educational change, and introduced a national basic skills testing program, National Assessment Program Literacy and Numeracy
(NAPLAN).
If the focus now jumps ahead to the PISA 2015 when the results were launched on 6
December 2016, the situation in Australia had changed. The results confirmed what had been
a steady decline in the performance of Australian students on international comparison testing
36
The results displayed in Figure 5 illustrate the decline. PISA warned that Australia’s previous
ranking as a high-equity and high-quality education system was in jeopardy.
Figure 5. Australia’s mathematical literacy performance on PISA (Thomson, De Bortoli, and Underwood, 2016, p. 21)
Andreas Schleicher, the education chief of the OECD warned Australia that it needed
to take the decline seriously. Of equal concern was those students in the lowest achievement
bands which included a disproportionate number of indigenous students. Students in the highest
socioeconomic quartile achieved an average score of 541 points, which was 86 points (or around three years of schooling) higher than the average score of 455 points for students in the
lowest socioeconomic quartile. The next section will briefly examine reasons for Australia’s
slide from a comfortable position to one of concern over a period of fifteen years.
What Contributed to the Decline?
The Howard years in government spanned 1996 till 2007 and during those years there
was an increase in the politicizing of education and education funding and an increasing move
to provide better support for private schools arguing there was a need to provide parents with
more choice. In Australia the states provided the majority of funding to government schools
with some federal input, whereas the reverse happened for private and independent schools.
The Labor opposition argued that this was support for the elite at the expense of the disadvantaged students although both federal and state governments increased resources for the
independent sector.
The Rudd-Gillard-Rudd years in government 2007-2013 continued the trend of using
education as a political issue. One of the Rudd Government's key proposals in the 2007 election
campaign was the implementation of the Building the Education Revolution (BER). This was
to include the “digital revolution” with the provision of computers for every secondary school student in Years 9–12 and the implementation of a national curriculum. In response to the
37
and is known as the Gonski Report. One issue it highlighted was that disadvantaged schools
required greater support and resources. This report has been hotly debated between the states
and federal government and between Labor and the conservative-liberal coalition. Also,
scholarships for disadvantaged students and funding for childcare became areas of savage
political contention.
NAPLAN was introduced as a series of tests focused on basic skills that were
administered annually to Australian students in Years 3, 5, 7, and 9. These standardized tests
assessed students' reading, writing, language (spelling, grammar, and punctuation) and
numeracy and were administered by the Australian Curriculum, Assessment and Reporting
Authority (ACARA). The data obtained from the NAPLAN tests are shown on the My School
website which shows all schools' average performance against other schools in the country. It
claimed to provide parents with information in order to compare schools and thus providing
them with greater choice. However, many critics claim that while NAPLAN testing was
designed to improve the quality of education young people receive in Australia, its
implementation and uses and misuses meant that it undermined quality education and did harm
that was not in the best interests of Australian children. Of note in the state of New South Wales
since 2012 under two agreements with the NSW Educations Standards Authority, Pearson has been responsible for printing and distributing NAPLAN tests, overseeing the marking process
and reporting the results.
Under the Labor, the Australian Institute for Teaching and School Leadership (AITSL)
was formed to develop and monitor national teaching standards and teacher accreditation. This
initiative has generally been well received as a strategy for improving the professionalism of
the teaching work force. In the mid of 2010, Gillard who had been education minister replaced
Rudd as leader and was then replaced by Rudd in 2013 and shortly after the Labor party lost
the election.
The Abbot – Turnbull government (2013 – current) has adjusted the existing programs
to meet its political aims and has recently announced changes to the funding of childcare by the
Education Minister Birmingham which includes the testing of children, and a revised Gonski
model.
It is possible to summarize the directions of federal and state educational policies since
the start of the new century that have accompanied the decline in Australia’s international
student performance:
increased politicization of education across Australia;
38
major political parties unable to compromise and collaborate;
greater funding of independent and private schools and failure to implement Gonski's needs-based funding of all schools;
increase in the amount of testing and reporting of student performance on basic skills;
increasing inequality and less emphasis on reducing educational disadvantage; and
a loss of autonomy by teachers and schools and a greater administration load.
Australia has a history of following trends in education that have arisen in the United
States and/or Great Britain in spite of mostly performing better than these two countries on
international assessment studies such as TIMSS and PISA.
Sahlberg (2011) the Director General of the Centre for International Mobility and
Cooperation at the Finnish Ministry of Education used the acronym GERM (Global Education
Reform Movement) to refer to the education reforms and policy-making procedures of US and
Great Britain and other western countries that employ "management models from the business
world, such as test-based accountability, merit-based pay, and data-driven administration" (p. 99). Australian and other researchers feel the movement is more accurately described as
GERMs (Lingard, Sellar, Hogan, & Thompson, 2017).
Sahlberg (2011) listed five features of GERM: (1) standardization in education, (2)
increased focus on core subjects in the curriculum, (3) prescribed curricula, (4) management
models from the corporate world, and (5) high-stakes accountability policies for schools.
Sahlberg (2011) claimed that GERM leaders choose the wrong drivers for change: by
emphasizing teacher accountability over teacher professionalism, by targeting individual
teacher quality over encouraging collegiality, technology vs. pedagogy, and fragmented
strategies vs. systems thinking. Australia has embraced these features of GERM in spite of
research that shows they are not working (the United States is consistently below Australian PISA performance). Hargreaves (2011, p. xv) claims show that:
… the United States, like many other Anglo-American nations, has epitomized Einstein's definition of madness: keep doing the same thing while expecting to get a different result.
Professor Yong Zhao, the leading American expert on educational reform in China and
Southeast Asia, is gentler in his remarks. However, he points out that China, the leading
economic competitor of the United States, is decentralizing its curriculum, diversifying its
assessment, and encouraging local autonomy and innovation. Meanwhile, Zhao concludes,
while China is decentralizing and Singapore is promoting a creative environment characterized
39
what schools should teach” (Zhao, 2009, p. 40). Zhao’s comments resonate with the education
directions in Australia which is certainly showing the effects of GERMs.
Even the last American president Barack Obama was worried about the assessment
regime and offered three principles that should be fulfilled in order to be worthwhile.
1. Students should only take tests that are worth taking. Tests that are of high quality and aimed at good instruction while ensuring students are on the right track.
2. Tests should not occupy too much classroom time, or crowd out teaching and learning. Tests should enhance the teaching and learning process.
3. Tests should be just one source of information to be used alongside classroom work, surveys, and other factors, to give us a comprehensive view of student progress.
So, after studying the declining performance of Australian students, what should the
educational authorities do to achieve their ambition to be within the top five countries in PISA
by 2025?
Where to Now?
If Australia is to lift performance on PISA and TIMSS in the future, a possible direction
may be to scrutinize the policies and practices of other successful countries rather than the
unsuccessful ones. Finland has been highlighted as a model to follow whereby “the Finns
transformed their educational system from mediocre in the 1980s to one of the models of
excellence today (Sahlberg, 2011, p. 1). Yet education researchers (Hatano & Inagaki, 1998;
White, 2013) have highlighted problems with just adopting other country programs rather than
adapting them to local contexts because “pedagogical methods are culturally embedded, and
transplanting them from one culture to another is not always feasible” (Hatano & Inagaki, 1998,
p. 101). There are considerable differences between Finland and Australia to make direct
copying unwise. For example, Finland is a small nation in size with a homogeneous population, a small immigration intake whereas Australia is a large continent with a multi-cultural
population and with a large immigration intake. However, these warnings do not prevent
Australia from learning from the Finns. For example, instead of blindly following the top-down,
test-based accountability, the use of market competition between schools, the use of private
sector managerial practices, and the increasingly standardized curriculum that focuses on
literacy and numeracy, it is possible “that a consistent focus on equity and cooperation … can
lead to an education system where all children do well” (Sahlberg, 2011, p. 9). At the very least,
Finland provides some alternative directions for consideration as current policies are increasing
the inequality among Australian students.
Perhaps the components of the Australian national assessment program need to be
revisited. Is it educationally sound to include PISA and TIMSS as key components? This also
40
schooling which is beyond the scope of this paper and can be found elsewhere (see Lingard,
Sellar, Hogan, & Thompson, 2017).
Is the influence of PISA and TIMSS beneficial or harmful? Perhaps the Australian
government could lessen the policy focus upon PISA and other international assessment
programs and neutralize their influence upon education in Australia. Kilpatrick (2013, p. 793) in the Third International Handbook of Mathematics Education does not feel their influence
has been thoroughly investigated:
Studies such as TIMSS and PISA are extensively reported in the media in many countries, but any effects on school mathematics in those countries have yet to be documented.
There are many who doubt that international comparisons are relevant or even reliable
in what they claim to show and do not include the full range of outcomes produced by
schooling. Skill sets that include interpersonal, spatial, and creative skills are becoming
increasingly important in the current business world.
One point of view is that academic achievement tests, such as the Programme for International Student Assessment (PISA), Trends in International Mathematics and Science Study (TIMSS), and Progress in International Reading Literacy Study (PIRLS) focus on areas too narrow to capture the whole spectrum of school education, and ignore social skills, moral development, creativity, or digital literacy as important outcomes of public education for all (Sahlberg, 2011, p. 8).
Wu (2008) quantified the effects of school curricula on the results by measuring what
she called the content advantage to show how a country’s national performance on international
tests is affected by the alignment of its curriculum with the PISA assessment criteria. Australian
students consistently do well in the assessment items involving chance and the interpretation
of data as these topics are well represented in the Australian curriculum.
A final criticism involving the nature of the items revolves around the real world
context. The criticism is that the PISA ambitions of testing real-life skills and competencies in
authentic contexts are by definition impossible to achieve (Sjøberg, 2007). Add to this is the
difficulty in finding contexts that are common to a variety of participating countries.
It is beyond the scope of this paper to do justice to the large amount of research evidence
which questions the value of these international assessment programs in terms of individual countries but also points to why it is not fair, constructive or valid to use them to compare
countries. To obtain maximum value for the great cost of participating, a country might well
be advised to participate in the programs but insist that their data was not aggregated and used
in any comparative reports. Or they might develop their own more localized program as
SEAQiM is currently doing by constructing a regional assessment program for Southeast Asian
41 Conclusion
This paper has briefly discussed why the Australia education system is in decline as
evidenced by international and national assessment programs. The challenge for policymakers,
schools, and teachers is how to respond to increasing pressure to lift test results on PISA,
TIMSS, and NAPLAN testing programs, while also addressing systemic inequality in order to ensure that every Australian student is given access to a meaningful education. Equitable
funding of schools, including redistribution to schools serving disadvantaged communities,
remains a pressing policy issue in Australia.
There are lessons to be learned by other countries in observing the Australian experience
and that is to avoid GERMs or to put it more bluntly do not adopt policies and programs from
countries that are performing worse than you.
References
Jablonka, A. (2003). Mathematical Literacy. In A.J. Bishop, M.A. Clements, C. Keitel, J.
Kilpatrick, & F.K.S. Leung (Eds.), Second international handbook of mathematics education (pp. 75-102). Dordrecht, the Netherlands: Kluwer Academic Publishers. Hargreaves, A. (2011). Foreword: Unfinished business. In P. Sahlberg, Finnish lessons (pp.
xv-xx). New York: Teachers College Press.
Hatano, G., & Inagaki, K. (1998). Cultural contexts of schooling revisited: A review of the
learning gap from a cultural psychology perspective. In S. G. Paris, & H. M. Wellman
(Eds.), Global prospects for education development, culture and schooling (pp. 79-104). Washington D.C.: American Psychological Association.
Kilpatrick, J. (2013). Introduction to section D: International perspectives on mathematics education. In M.A. Clements, A.J. Bishop, C. Keitel, J. Kilpatrick, & F.K.S. Leung
(Eds.), Third international handbook of mathematics education (pp. 791-795). New York: Springer.
Lingard, B., Sellar, S., Hogan, A., & Thompson, G. (2017). Commercialisation in public schooling (CIPS). Sydney: New South Wales Teachers Federation.
Organization for Economic Co-operation and Development (OECD). (2002). PISA 2000 technical report. Paris: OECD.
Organization for Economic Co-operation and Development (OECD). (2004). Learning for
tomorrow’s world. Paris: OECD.
42
Organization for Economic Co-operation and Development (OECD). (2016). PISA 2015 assessment and analytical framework: Science, reading, mathematics and financial literacy. Paris: Author.
Sahlberg, P. (2011). Finnish lessons. New York: Teachers College Press.
Stacey, K. (2011). The PISA view of mathematical literacy in Indonesia. Indonesian Mathematics Society Journal of Mathematics Education, 2(2), 95-126.
Sjøberg, S. (2007). PISA and “real life challenges”: mission impossible? In S.T. Hopmann,
G. Brinek, & M. Retzl, (Eds.), PISA according to PISA, does PISA keep what it
promises? (pp. 1-18). Wien: LIT Verlag.
Thomson, S., & Fleming, N. (2004). Summing it up: Mathematics achievement in Australian schools in TIMMS 2002, (TIMMS Australia Monograph No 6). Camberwell, Victoria: ACER.
Thomson, S., Hillman, K., & De Bortoli, L. (2013). A teacher’s guide to PISA mathematical
literacy. Camberwell, Victoria: ACER Press.
Thomson, S., De Bortoli, L., & Underwood, C. (2016). PISA 2015: A first look at Australia’s results. Camberwell, Victoria: ACER Press
Thomson, S., De Bortoli, L., & Underwood, C. (2017). PISA 2015: Reporting Australia's results. Retrieved from: http://research.acer.edu.au/ozpisa/22
White, A. L. (2013). Literacy and mathematics. In R. Gregson (Ed.), Literacy across the curriculum (pp. 34-51). Illinois, USA: Common Ground Publishing.
Willis, S. (1990). Numeracy and society: the shifting ground. Being numerate: what counts (Ed.). Melbourne: Australian Council for Educational Research.
Wu, M. (2008). A Comparison of PISA and TIMSS 2003 achievement results in mathematics and science. Paper presented at the 3rd IEA Research Conference, Taipei.