Refer to Important disclosures in the last page of this report
Stock DataTarget price (Rp) Rp8,200
Prior TP (Rp) Rp8,300
Share price (Rp) Rp6,575
Upside/downside (%) +24.7
Shares outstanding (m) 46,667
Market cap. (US$ m) 20,253
Republic of Indonesia 60.0%
Estimate Change; Vs. Consensus
2018F 2019F
PT Indo Premier Sekuritas [email protected] +62 21 5793 1168
Solid growth from lower credit cost
9M18 earnings rose 20% (in-line) while core profit grew modestly.
Strong loan growth mitigated NIM pressure from rising rates.
Credit cost improved despite still elevated middle corporate NPLs.
Reiterate BUY albeit with lower TP of Rp8,200 (from Rp8,300).
Results in-line. BMRI reported net profit of Rp18.1n in 9M18 (+20% yoy), in line
with FY18F consensus estimate of Rp24.3tn albeit slightly below our forecast due
to tax-case loss of c.Rp300bn in 3Q18 arising from disputed timing of tax-benefit
associated with achieving 40% stock free float post a rights issue in 2011. BMRI’s
tax-case loss in 3Q, as ruled by the Supreme Court, came after its tax-dispute win
of Rp1.08tn in 2Q18. Excluding these non-operating items, its earnings grew 19%
qoq in 3Q due to its lower loan provisions (-24% qoq). The bank’s strong earnings
growth in 9M18 was driven by its modest top line growth, strong cost control and
also partly due to a low base effect from its very weak 1Q17 earnings.
Modest PPOP growth. Excluding provisions, BMRI’s core profit grew 7% in 9M18
driven by its strong asset growth (loans: +14%; deposits: +9%), which mitigated
NIM pressures arising from 125bps interest rate hikes so far in 2018, and modest
operating cost growth of only 6%. Although NIMs declined 17bps yoy in 9M18,
NIMs were stable in the past 3 quarters and came at the top end of 5.5%-5.7%
guidance although we still expect lower NIM in 4Q when its loan growth slows to
narrow the gap with deposit growth. The bank’s IDR cost of funds rose by 20bps
to 3.1% in 3Q due to 50bps rise in time deposit costs in the last quarter.
Asset quality. BMRI’s credit cost improved to 183bps in 3Q18 (1H18: 209bps)
while its new NPL formation also dropped to Rp3.06tn (1.8% of loans), from an
average of Rp4.1tn or 2.6% of loans in 1H18 (FY17: 2.6%), of which half of these
new NPLs came from its middle corporate loans (4.3% of loans), albeit still better
vs. 6.1% in 1H18. Management is guiding for new NPLs of Rp3.6tn in 4Q18 (9M:
Rp13.5tn) and maintain credit cost guidance of 2.0-2.2% for FY18F (9M: 1.97%).
BMRI’s NPL ratio improved to 3.0% in 3Q, from 3.74% a year earlier, with stable
provision/NPL coverage of 136%.
Valuation. We lower our earnings forecasts for FY18F/FY19F by 2.6%/3.1% and
our TP to Rp8,200 (from Rp8,300), due to our slightly lower book value forecast
arising from bond revaluation losses in 2018. Our TP is based on our GGM-derived
target FY18F P/B of 2x, assuming LT ROAE of 16.6%, growth of 8.5%, and cost of
equity of 12.5%. We estimate BMRI’s LT ROAE based on our DuPont analysis,
Operating income (RpBn) 70,824 73,718 78,504 85,827 93,882
PPOP (RpBn) 39,556 38,704 41,670 46,113 51,060
Source: BMRI, IndoPremier Share Price Closing as of : 17-October-2018
2
Refer to Important disclosures in the last page of this report
Fig. 1: Net Interest Income (Rp bn) and NIMs (%) Fig. 2: Non-Interest Income (Rp bn; % of Gross Income)
Source: Company, IndoPremier Source: Company, IndoPremier
Fig. 3: Operating Expense (Rp bn) and Cost/Income Ratio (%) Fig. 4: Pre-Provision Profit (Rp bn; % of Average Assets)
Source: Company, IndoPremier Source: Company, IndoPremier
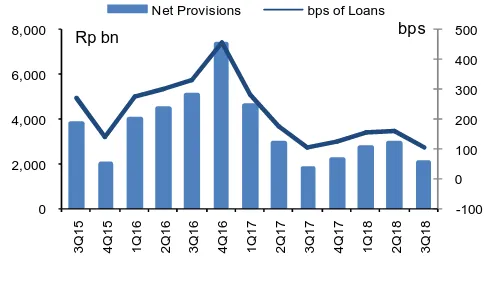
Fig. 5: Net Loan Provisioning (Rp bn; bps of Average Loans) Fig. 6: Net Profit (Rp bn) and ROAA (%)
Source: Company, IndoPremier Source: Company, IndoPremier
3.0%
Net Interest Income Net Interest Margin
Rp bn
Other Income Other Income % of Total
Rp bn
Operating Expenses Cost-Income Ratio
Rp bn
Pre-Provision Profit Pre-Provision Profit ROAA
Rp bn
Net Provisions bps of Loans
bps
Net Profit Net Profit ROAA
3
Refer to Important disclosures in the last page of this report
Third Quarter 2018 Results
(Rp Bn) 9M18 9M17 % Y-Y 3Q18 2Q18 % Q-Q
Risk-Weighted Assets 836,221 756,066 10.6 836,221 830,913 0.6
Shareholders’ Funds 172,871 160,972 7.4 172,871 166,834 3.6
4
Refer to Important disclosures in the last page of this report
Year To 31 Dec (RpBn) 2016A 2017A 2018F 2019F 2020F
Income Statement
Interest income 76,710 79,502 81,342 91,870 103,646
Interest expense (24,885) (27,174) (26,621) (31,635) (37,341)
Net interest income 51,825 52,327 54,721 60,235 66,305
Fees and commissions 11,440 12,483 12,836 14,119 15,531
Trading income 3,027 3,950 4,250 4,778 5,016
Other operating income 4,532 4,958 6,698 6,695 7,029
Total operating income 70,824 73,718 78,504 85,827 93,882
Personnel expenses (13,619) (14,859) (16,047) (17,331) (18,718)
G&A expenses (13,958) (15,406) (16,176) (17,470) (18,868)
Other operating expenses (3,691) (4,750) (4,612) (4,913) (5,237)
Pre-provision operating profit 39,556 38,704 41,670 46,113 51,060
Provisions (24,645) (15,952) (15,243) (14,266) (13,122)
Loan recovery income 3,702 4,417 5,000 5,000 5,000
Operating profit 18,613 27,170 31,427 36,846 42,938
Non-operating profit (40) (13) 0 0 0
Exceptional items 0 0 0 0 0
Pre-tax profit 18,573 27,157 31,427 36,846 42,938
Income tax (3,923) (5,714) (6,285) (7,369) (8,588)
Minority interests (844) (803) (827) (869) (912)
Reported net profit 13,807 20,640 24,314 28,608 33,438
Balance Sheet
Cash 22,907 24,269 28,177 30,821 33,723
Current account with BI 52,485 50,188 60,991 66,434 72,403
Placements at BI & other banks 83,977 86,931 91,277 95,841 100,633
Short-term investments 61,606 62,161 57,354 53,027 49,133
Government bonds 98,933 103,411 103,411 103,411 103,411
Gross loans 662,013 729,548 814,896 917,207 1,032,455
Loan provisions (32,945) (34,116) (35,348) (39,615) (42,736)
Other assets 89,730 102,309 111,087 120,852 131,738
Total Assets 1,038,706 1,124,701 1,231,845 1,347,979 1,480,760
Customer deposits 762,501 815,807 890,353 972,087 1,061,736
Deposits from other banks 9,675 8,795 9,074 9,382 9,720
Securities and borrowings 48,477 56,332 59,068 62,078 65,389
Other liabilities 64,683 73,762 81,819 81,931 87,579
Total Liabilities 885,337 954,695 1,040,314 1,125,478 1,224,424
Share capital 28,983 28,983 28,983 28,983 28,983
Reserves and others 24,540 26,378 23,261 25,261 25,261
Retained earnings 96,931 111,358 135,671 164,280 197,718
Shareholders' equity 150,454 166,719 187,915 218,523 251,961
Minority interest 2,916 3,287 3,616 3,978 4,375
Total Liabilities & Equity 1,038,706 1,124,701 1,231,845 1,347,979 1,480,760
5
Refer to Important disclosures in the last page of this report
Year To 31 Dec 2016A 2017A 2018F 2019F 2020F
Growth Ratios (% yoy)
Gross loans 11.2 10.2 11.7 12.6 12.6
Total assets 14.1 8.3 9.5 9.4 9.9
Customer deposits 12.7 7.0 9.1 9.2 9.2
Net interest income 14.2 1.0 4.6 10.1 10.1
Non-interest income 3.6 12.6 11.2 7.6 7.8
Total operating income (29.3) 46.0 15.7 17.2 16.5
Operating expense 8.7 12.0 5.2 7.8 7.8
PPOP 13.2 (2.2) 7.7 10.7 10.7
Net profit (32.1) 49.5 17.8 17.7 16.9
Profitability Ratios
ROAA (%) 1.44 1.94 2.06 2.22 2.36
ROAE (%) 10.5 13.4 13.7 14.1 14.2
NIM (%) 6.28 5.71 5.34 5.39 5.40
Net credit cost (bps) 349.4 172.3 132.6 107.0 83.3
Cost/income (%) 44.1 47.5 46.9 46.3 45.6
LDR (%) 86.8 89.4 91.5 94.4 97.2
CAR (%) 20.8 19.1 18.9 18.7 18.6
NPL ratio (%) 4.0 3.5 3.0 2.9 2.6
Provisions/NPL (%) 124.6 134.8 145.9 150.6 156.7
Head Office
PT INDO PREMIER SEKURITAS
Wisma GKBI 7/F Suite 718
Jl. Jend. Sudirman No.28
Jakarta 10210 - Indonesia
p +62.21.5793.1168
f +62.21.5793.1167
INVESTMENT RATINGS
BUY : Expected total return of 10% or more within a 12-month period HOLD : Expected total return between -10% and 10% within a 12-month period SELL : Expected total return of -10% or worse within a 12-month period
ANALYSTS CERTIFICATION.
The views expressed in this research report accurately reflect the analyst;s personal views about any and all of the subject securities or issuers; and no part of the research analyst's compensation was, is, or will be, directly or indirectly, related to the specific recommendations or views expressed in the report.
DISCLAIMERS