PROPOSAL OF PERIODIC INVENTORY REVIEW POLICY FOR
IRREGULAR DEMAND IN A CASE STUDY OF PT ABC DURI-RIAU
1Mutia Permatasari, 2Ari Yanuar Ridwan, 3Budi Santosa
1,2,3 Program Studi Teknik Industri, Fakultas Rekayasa Industri, Telkom University 1[email protected], 2[email protected], 3[email protected]
Abstract:
PT ABC is one of the big companies engaged in services. Has two types of business, namely drilling services for mining and trading services which is a trading business that supplies the logistics needs of a company. PT ABC has three offices, namely head office located in Sidoarjo temple area, branch office of Pekanbaru and Jakarta. In the inventory terms, this company has been dealing with irregular demand which is lumpy. In 2016, the stock reached 60,774 units when demand is 13,175 units and make the high total inventory cost as much as $10,690.51 per year.. The model that is suggested for this problem is Periodic Review System under normal distribution data over lead time was performed in one of PT ABC’s central warehouse in Duri, Riau. By using the Periodic Review System as the proposal policy to reduce the overstock that kind is used according to the ABC analysis of each item, the percentages of reduction is up to and could save the total inventory cost up about 92.24% or equals to USD($) 9,861.35.
Keywords: Irregular Demand, Lumpy, ADI-CV, Normal Distribution, Periodic Review (T,r,R), Periodic Review (T,R), Overstock.
1. Introduction
Inventory is the stock of materials stored for use to facilitate production activities or quality goods, in-process goods, and finished goods. It is generally known that inventory is an asset for a company that has an important role in the production process at the factory divided into several types such as raw material inventory for input in the production process, auxiliary materials or supplies as auxiliary in the implementation of the process production, work in process, spare part inventories as components to replace other damaged and finished goods as a ready product to be marketed to consumers (Bahagia, 2006).
The objective in a company or organization of having inventory is to manage the goods supply in facing demand uncertainty. An excessive amount of inventory (overstock) will cause wastage, it also leads to storage cost and great care in maintaining goods. Then as well as if the amount of inventory is too small, it will cause inventory
“stock out” that results in the company to fail in fulfilling customer demand. Therefore, the inventory control is important so that needs of goods can be met optimally with least risk possibility.
PT ABC is an Indonesian company that provides drilling services, integrated drilling fluids engineering and oilfield chemicals supply for oil and gas exploration. This company has contracted with some big oil and gas company in order to support the oil and gas exploration. It has some warehouse warehouses at Sidoarjo – East Java, Duri – Riau, Jambi – Sumatra and Madura – East Java. One of the active warehouse as this research object is located in Duri.
Figure 1 Comparison between Stock and Demand
The Figure 1 shows that the material kept in inventory warehouse more than the customer needs. It indicates the occurrence of excess inventory in the warehouse with a percentage difference between the amount of stock and demand can be seen on Figure 2. Big difference number of stock and demand has caused by the demand pattern that identified as intermittent demand. This pattern then classified in to lumpy demand.
Figure 2 Comparisons of Stock and Demand per Unit
From the Figure 2 can be seen that every material in inventory of PT ABC have faced overstock problem which is caused by the irregular demand. The company has fear of not fulfilling costumers demand. Then, it leads to have the excessive amount of material to be maintained and kept in the warehouse.
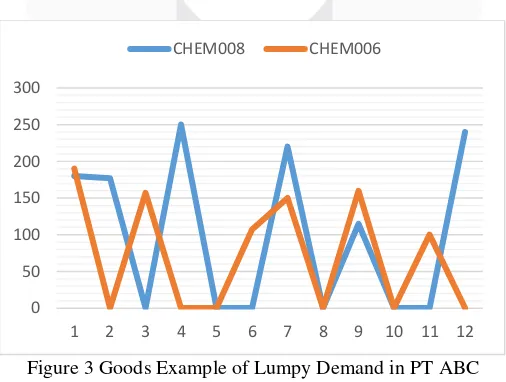
Figure 3 Goods Example of Lumpy Demand in PT ABC
Irregular demand is identified when the demand pattern is showing the fluctuation in some periods. Lumpy demand is the condition when the demand in some periods contains zero and have significant number difference. This condition is illustrated by two types units in PT ABC in Figure 3. This condition caused by the specific goods that PT ABC provides for its customers which is chemical for gas and oil exploration support and there is still no inventory policy to stock the goods in warehouse. The company provides the goods for limited customers, it is the main cause of why there are several items that categorized as lumpy demand.
0 1000 2000 3000 4000 5000 6000 7000
1 2 3 4 5 6 7 8 9 10 11 12
Stock Demand
0% 20% 40% 60% 80% 100%
1 2 3 4 5 6 7 8 9 10 11 12 13 14 15 16
Stock Demand
0 50 100 150 200 250 300
1 2 3 4 5 6 7 8 9 10 11 12
Based on the problems experienced by PT ABC that there is overstock then it leads to the swelling costs in the inventory while the cost incurred for the demand is smaller. Good inventory management also considers several things to reduce costs for the procurement process such as ordering cost, holding cost, and stock out cost (Bahagia, 2006). It is required by PT ABC to minimize the problems by doing good inventory planning. To improve the management of inventory control system in PT ABC, it is necessary to optimize the maximum inventory and minimum supply in order to minimize inventory cost in the right period of time to reorder the goods. Therefore, considering the lumpy demand of material that inventory control will be conducted using Periodic Review System that aims to minimize the overstock and inventory cost incurred by the company and as an alternative proposed inventory plan in the future.
The system of inventory policy is found that there are two most suitable policies such as Periodic Review System (T,r,R) and Periodic Review System (T,R). in order to find the most optimal solution for a better condition in PT ABC, this research will so evaluate and selection among the chosen methods. Furthermore, the results will be compared to find out which is the better solution to be proposed in PT ABC.
2. Study Literature 2.1 Inventory
The state of the inventory of goods in the activities of human life can not be avoided either in private activities, household, social, office, or business. Things that distinguish among others is the type of goods needed, the intensity of use, and management system. (Bahagia, 2006)
2.2 Irregular Demand
The intermittent nature of demand can be traced to four underlying features (Ghobbar & Friend, 2002):
1. Slow moving demand with no great variation in inter demand intervals and quantities for each requirement. 2. Strictly intermittent demand with no extreme variations quantity but with demand absent in many time
periods.
3. Erratic demand is highly erratic in scale rather than per unit time period.
4. Lumpy demand is random with zero demand in many time periods but significant demands if other demand values can vary greatly.
2.3 ADI-CV
ADI (Average Inter-Demand Interval) and CV (Coefficient of Variation) derives the characteristics of intermittent demand. ADI measures the average number of time periods between two successive demands and CV represents the standard deviation of period requirements divided by the average period requirements. (Regattieri, Gamberi, Gamberini, & Manzini, 2005)
𝐶𝑉 = √∑ (𝜀𝑛𝑖=1 𝜀𝑟𝑖− 𝜀𝑎)/𝑛 𝑎
Notation:
n: the number of periods
ɛri: the item demand in period i
ɛa: the average item demand for all periods
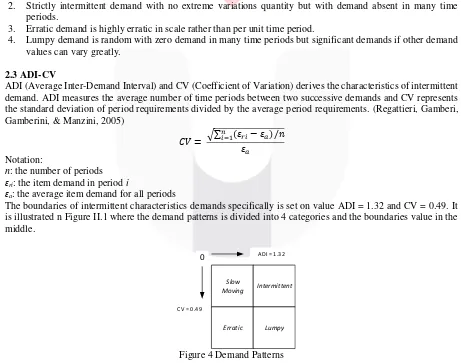
The boundaries of intermittent characteristics demands specifically is set on value ADI = 1.32 and CV = 0.49. It is illustrated n Figure II.1 where the demand patterns is divided into 4 categories and the boundaries value in the middle.
Slow
Moving Intermittent
Erratic Lumpy
0 ADI = 1.32
CV = 0.49
Figure 4 Demand Patterns 2.3 ABC Analysis
1. A Category (80-20) consists of material that consume 80% out of the total funds for inventory and the number of materials is about 20% out of the total number materials.
2. B Category (15-30) consists of material that consume 15% out of the total funds for inventory (not include the A category) and the number of materials is about 30% out of the total number materials.
3. C Category (5-50) consists of material that consume 5% out of the total funds for inventory (not include the A and B category) and the number of materials is about 50% out of the total number materials. 4. To make the pareto diagram and to classify the material based on the category, the step are as follows: 5. Calculate the absorption of funds for every item per year (Mi), by multiplying the number of usage for
every item per year (Di) with the price for every item (Pi), systematically can be stated as:
𝑀𝑖 = 𝐷𝑖𝑥𝑃𝑖
6. Calculate the total absorption of finds for every item.
𝑀𝑖 =
∑
𝑀𝑖7. Calculate the absorption of funds percentage for every time (Pi).
𝑃𝑖 = 𝑀𝑖
𝑀𝑥100%
8. Calculate the percentage for every item.
𝐼𝑖 = 1
𝑁𝑥100%
N : number of item type
9. Sort the absorption of funds from the largest value to the lowest.
10. Calculate the cumulative percentage of the absorption of funds and the cumulative percentage of the item type based on the sortation done in step 5.
11. Determine the item category. 2.4 Periodic Review (T,r,R)
This method is similar with continues review (s,S) but with replenishment time. In determining the value of the point of reorder point (r*)), it can be searched iteratively by Hadley-Within method as the following (Bahagia, 2006):
1. Calculate initial q01* value equal to q0w* value with Wilson formula
𝑞01∗= 𝑞0𝑤= √2𝐴𝐷ℎ
2. Based on the value of q*01 obtained will be sought the amount of possible inventory deficiency α which will then be able to calculate the value of r*1 by using the equation:
𝛼 =ℎ. 𝑞01 ∗𝐶
𝑢𝐷 ∗
After getting the value of α, next is to find the value of Zα, where the value can be searched through the normal table. Then next look for value using equation:
𝑟𝑖 ∗= 𝐷𝐿 + 𝑍𝛼𝑆√𝐿
3. It is known that the obtained values can be calculated q02* based on the equation:
𝑞02 ∗= √2𝐷[𝐴 + 𝐶𝑢∫ (𝑋 − 𝑅1 ∗)𝑓(𝑥)𝑑𝑥 ∞
𝑟1∗ ]
ℎ
Where,
∫ (𝑧 − 𝑟𝑖 ∗)𝑓(𝑥)𝑑𝑥 = 𝑆𝐿[𝑓(𝑍𝛼) − 𝑍𝛼Ѱ(Zα)] = 𝑁 ∞
𝑟𝑖∗
4. Recalculate the value of α and r2* value using the equation:
𝛼 =ℎ𝑞𝐶 02
𝑢𝐷
After getting the value of α, next is to find the value of, where the value can be searched through the
normal table. Then then look for the value of r2* by using the equation:
𝑟2∗ = DL + Zα. S√L
5. Compare the value r1* and r2*, if the relative price r2* is equal to the iteration r1* is completed r*= r2* and q0*= q02* will be obtained. Otherwise return to step 3 by replacing the value r*= r2* and q0*= q02*. Based on calculations using the Hadley-Within model, the following inventory policy is obtained:
2. Safety stock (ss):
ss = Zα.S√𝐿
3. Service level :
η = 1 - 𝑵𝑸 x 100% 4. Total Inventory Cost :
OT = Op + Os + Ok
To determine the periodic review as follows
𝑇 =𝑄𝐷𝑜∗
Notations:
D : Total data of demand per year S : Standard deviation of demand L : Lead Time
A : Order cost per unit ($) h : Holding cost per unit ($) Cu : Shortage cost per unit ($)
α : Possible shortage of inventory
Zα : Normal deviation
f(Zα) : Ordinate
Ѱ(Zα) : Partial Expectations
N : Total shortage of inventory per cycle ss : Safety stock or safety stock
R : Reorder point q0n * : Order lot size
q : Period between time of booking E : Maximum inventory level
η : Service level or Service level Op : Order cost ($)
Os : Holding cost ($) Ok : Cost deficiency ($) 2.5 Periodic Review System (T,R)
The system (T, R) with backorder, in this case customers wait until shortage goods to fulfill the demand arrive in the warehouse. (Bahagia, 2006).
The model formulation:
𝑂𝑇 = 𝑂𝑝+ 𝑂𝑠+ 𝑂𝑘
𝑂𝑇 =𝐴𝑇 + ℎ (𝑅 − 𝐷𝐿+𝐷𝑇2 ) +𝐶𝑇 ∫ (𝑧 − 𝑅𝑢 ∞
𝑅 )𝑓(𝑧)𝑑𝑧
From the total inventory cost (OT) can be seen the two decision variable that will be determined is T and R. In order to find the T,R, and ss using Hadley-Within Method as follows:
1. Calculates T0,
𝑇0= √𝐷ℎ2𝐴
2. Calculates 𝛼 dan R using,
𝛼 =𝑇ℎ𝐶 𝑢
When the demand is normal distributed, R value in whole (T+L) periods and is stated as:
𝑅 = 𝐷(𝑇 + 𝐿) + 𝑍𝛼√𝑇 + 𝐿
3. Calculates the total inventory cost.
4. Repeat the step 2 by changing 𝑇0= 𝑇0+ ∆𝑇0
a. If the new (OT)0 result is greater than the initial (OT)0, the iteration of the addition of T0 is stopped. Then, tested with a reduction iteration (𝑇0= 𝑇0− ∆𝑇0) until a value of T = T0 is found that gives a minimum total cost value.
b. If the new (OT)0 result is smaller than the initial (OT)0, the iteration of the addition of 𝑇0= 𝑇0+ ∆𝑇0 is continued and stops if the new (OT)0 is larger than the calculated (OT)0. The price of T0 which gives the smallest total cost (OT) is the optimal time interval T.
3. Research Methodology
Goods Demand
Demand Distribution Test
per goods
Inventory Policy for PT ABC Order Cost
Holding Cost Shortage Cost
Lead Time Determination of Inventory
Policy and Total Inventory Cost
Electricity Cost
Operator Cost
Facility Cost
Facility Cost
Operator Cost
Electricity Cost
Administration Cost
Figure 5 Research Conceptual Model 5. Method Selection Analysis
The method Periodic Review (R,s,S) may reduce the total inventory cost significantly and solve the cost problem. (Arismawati, Ridwan, & Santosa, 2015) The use of Hadley-Within method that seems as the optimum solution to reduce the overstock as in the case of previous research (Nurrahma, Ridwan A., & Santosa, 2016). Then, in this research also classify the goods using ABC, according to (Utami, Ridwan, & Santosa, 2016) that this analysis is giving the optimum solution to see the item priority.
Another reasons of this research to use Periodic Review System (T,r,R) and Periodic Review System (T,R) as the method to find optimum solutions are:
1. Data of PT ABC is probabilistic pattern and normal distribution. 2. The size of ordered goods are vary and not constant.
3. The price is constant in every order. 4. The goods is independent.
5. Lead time constant and same for every goods.
6. According to (Wang & Xia, 2015) the data with lumpy demand suitable to be solved using Periodic Review System Policy. The periodic review method offers the policy that has specific time interval to order goods. This condition will give high service level for the demand that is lumpy if compared to continuous review policy because, the lumpy demand is the condition where there are several periods with no demand. 6. Study
This research is using the data of PT ABC which recorded from January until December 2016. The input data are demand, item price, lead time, holding cost, order cost, and shortage cost.
5.1 Data Process
5.1.1 Demand Distribution
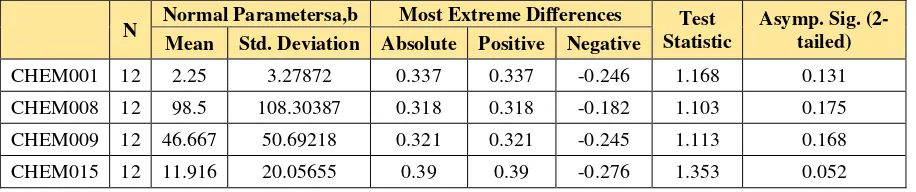
Goods demand on PT ABC data is needed to have distribution test to check whether if it’s normal, uniform, exponential, or Poisson distribution pattern. In PT ABC case, the data is not normally distributed normality test using Kormogolov-Smirnov is done. There are hypothesis for the normality test which are:
H0 : The data is normally distributed H1 : The data is not normally distributed
The normality hypothesis of H0 is accepted when Sig.(2-tailed) > 0.05 or the hypothesis is denied. Table 1 Demand Distribution Test (4 SKUs Sample)
N Normal Parametersa,b Most Extreme Differences Test Statistic
Asymp. Sig. (2-tailed) Mean Std. Deviation Absolute Positive Negative
CHEM001 12 2.25 3.27872 0.337 0.337 -0.246 1.168 0.131
CHEM008 12 98.5 108.30387 0.318 0.318 -0.182 1.103 0.175
CHEM009 12 46.667 50.69218 0.321 0.321 -0.245 1.113 0.168
5.1.2 ADI-CV
The calculation is done, and the results is shown in Table 2:
Table 2 Demand Pattern Classification Using ADI-CV (4 SKUs Sample) Code Continuous / Intermittent Demand Characteristic
CHEM001 Intermittent Lumpy
CHEM003 Intermittent Lumpy
CHEM006 Intermittent Lumpy
CHEM007 Intermittent Lumpy
From the calculation, it is obtained that CHEM001, CHEM003, CHEM006, and CHEM007 have been categorized as intermittent and has lumpy characteristics. The characteristic is determined when the values of ADI and CV have fulfill the condition. A demand pattern is categorized as irregular (intermittent) when ADI <1.32 and for lumpy is when CV is above value of 0.49.
5.1.3 ABC Analysis
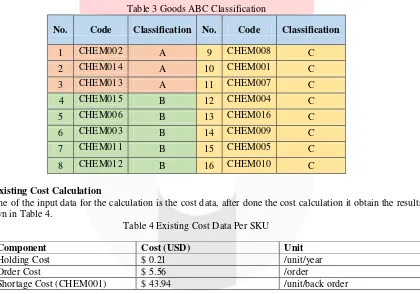
The classification using ABC analysis is done to classified which goods are in class A, B, and C of the inventory financial sides. The results of ABC analysis is shown in Table 3:
Table 3 Goods ABC Classification
No. Code Classification No. Code Classification
1 CHEM002 A 9 CHEM008 C
2 CHEM014 A 10 CHEM001 C
3 CHEM013 A 11 CHEM007 C
4 CHEM015 B 12 CHEM004 C
5 CHEM006 B 13 CHEM016 C
6 CHEM003 B 14 CHEM009 C
7 CHEM011 B 15 CHEM005 C
8 CHEM012 B 16 CHEM010 C
5.1.4 Existing Cost Calculation
One of the input data for the calculation is the cost data, after done the cost calculation it obtain the results as shown in Table 4.
Table 4 Existing Cost Data Per SKU
Component Cost (USD) Unit
Holding Cost $ 0.21 /unit/year
Order Cost $ 5.56 /order
Shortage Cost (CHEM001) $ 43.94 /unit/back order
Therefore, the total inventory cost in a year is $10,690.51 and the detailed summary is in Table 5. The calculation is done based on the given data by PT ABC DURI-RIAU.
Table 5 Existing Total Inventory Cost Summary Description Total Cost
5.2 Comparison Results
The calculation for every goods using each Periodic Review System policy is done. Then, it is necessary to compare for which policies have the better solution for PT ABC problem.
Figure 6 Comparisons of Existing and Inventory Policies Total Inventory Cost
From the comparison in Figure 6, the total inventory cost shown that both policy has smaller value than existing condition that is described in Figure V.4. The total shows that periodic review (T,R) has the most minimum total inventory cost than periodic review (T,r,R). Each policy has reduced 92.78% and 91.95% for periodic review (T,R) and periodic review (T,r,R) which means that total inventory cost reduced from $10,690.51 to $860.18 and $772.35.
5.3 Proposed Inventory Policy
The results for each periodic review policy is showing that Periodic Review (T,R) is the better solution for PT ABC Problem that can reduce more total inventory cost. Although the results refers to only one policy, there is another consideration for the chosen method to be proposed in order for PT ABC get the problem solving. As stated by (Silver, Pyke, & Peterson, 2017), the periodic review (T,r,R) is suitable for A category items while periodic review (T,R) is suitable for B and C category items.
5.4 Results
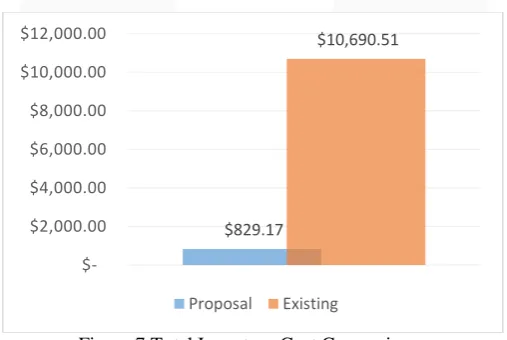
From the calculation, the proposed inventory policy using periodic review (T,r,R) and periodic review (T,R) has reduced the stock total inventory cost, is the summation of the holding cost, order cost and the shortage cost. Figure shows the comparison of the total inventory cost for the existing and proposed condition.
Figure 7 Total Inventory Cost Comparisons
The proposed inventory policy reduces the cost by 92.24% from $10,690.51 to $829.17. The reduced cost is caused by the quantity of the goods kept in the warehouse is smaller than the existing condition. Furthermore, the quantity of the goods that is purchased is smaller because in the proposed inventory policy, the maximum inventory level and the reorder point is determined so PT ABC only done the replenishment if the inventory level has reached or below the reorder point and only replenished it up to the maximum inventory level.
The difference component cost of the proposed policy to existing condition that this policy occurs the increasing of shortage cost. It is described as a comparisons graphic in Figure 7.
$860.18
$10,690.51
$772.35
$-$2,000.00 $4,000.00 $6,000.00 $8,000.00 $10,000.00 $12,000.00
(T,r,R)
Existing
(T,R)
$829.17
$10,690.51
$-$2,000.00 $4,000.00 $6,000.00 $8,000.00 $10,000.00 $12,000.00
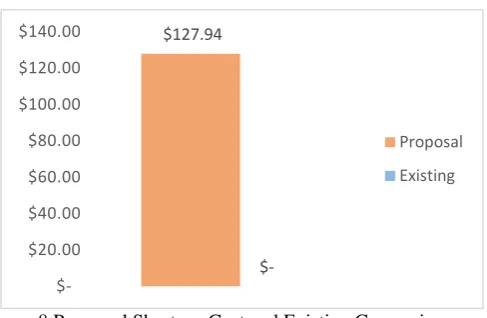
Figure 8 Proposed Shortage Cost and Existing Comparisons
The proposed inventory policy has given a higher shortage cost than the existing condition. It can be seen the proposed inventory policy increased from $0 to $127.94. Shortage cost means there is time when the stock quantity cannot fulfill the demand in time interval of PT ABC than existing condition because, the periodic review only done the ordering goods in specific time interval so that it would has the probabilistic of having shortage.
7. Conclusion
1. According to the analysis results of this research, determination of inventory policy for goods in PT ABC using periodic review (T,r,R) and periodic review (T,R) can be concluded are as follows:
2. Irregular demand and not yet optimal inventory policy has led to overstock inventory in PT ABC, this also cause the high inventory cost due to many goods that have to be kept and control.
3. Using ADI-CV calculation it can be seen that the demand pattern is irregular which is categorized as lumpy demand on total 16 SKUs.
4. Comparing both of Periodic Review (T,r,R) and Periodic Review (T,R) the method that can compress the overstock is Periodic review (T,R) because, it does not determine the specific reorder point.
5. Using ABC analysis, the result shows there are 3 items classified as A category, 5 items as B category and 8 items as C category. As the consideration to ABC analysis then, it is used for determination of method, which are periodic review (T,r,R) for A category and periodic review (T,R) for category B and C.
6. Using the periodic review (T,r,R) for category A and periodic review (T,R) for category B and C. Therefore, it leads to total inventory cost reduction as much as 92.24% from $10,690.51 to $829.17. 8. References
Arismawati, P., Ridwan, A. Y., & Santosa, B. (2015). Perencanaan Kebijakan Persediaan Untuk Meminimasi Total Biaya Persediaan Dengan Pendekatan Metode Periodic Review (R,s,S) Pada Part Aksesoris. e-Proceeding of Engineering: Vol 2, 4877.
Babai, M. Z., Syntetos, A. A., & Teunter, R. (2010). On the empirical performance of (T,s,S) heuristics. European Journal of Operational Research, 466-472.
Bahagia, S. N. (2006). Sistem Inventori. Bandung: Penerbit ITB.
Ghobbar, A., & Friend, C. (2002). Source of Intermittent Demand For Aircraft Sarepart Within Airline Operations. Journal of Air Transport Management, 221-231.
Nurrahma, D. A., Ridwan A., Y., & Santosa, B. (2016). Usulan Perencanaan Kebijakan Persediaan Vaksin Menggunakan Metode Continuous Review (s,S) untuk Mengurangi Overstock di Dinas Kesehatan Kota XYZ. Jurnal Rekayasa Sistem & Industri: Vol 3 No 02.
Regattieri, A., Gamberi, M., Gamberini, R., & Manzini, R. (2005). Managing Lumpy Demand For Aircraft Spare Parts. Air Transport Management, 426-431.
Silver, E. A., Pyke, D. F., & Peterson, R. (2017). Inventory Management and Production Management in Supply Chains (4th Edition). Boca Raton: CRC Press.
Utami, V., Ridwan, A. Y., & Santosa, B. (2016). Usulan Perencanaan Persediaan Produk Kategori Teh Celup Dengan Metode Continuous Review (s,S) dan Continuous Review (s,Q) System Untuk Mengurangi Lost Sales di Gudang PT XYZ Bandung. e-Proceeding of Engineering: Vol 3, No. 2, 2460.
$127.94
$-$20.00 $40.00 $60.00 $80.00 $100.00 $120.00 $140.00
Proposal