Vol. 18 No. 1 April 2011 Abstract
Low crested structures, including submerged breakwaters, may be provided to protect the beach from wave attack. These structures can be built parallel to the shoreline and the crest is set up at or below water levels. It function is to protect the beach from wave action by reducing or by acting as a barrier to the waves. Wave transmission on structures has been subject for flume tests by many researchers and come up with several 2D wave transmission formulas. Oblique wave attack rarely involve on the formula since only a few tests conducted on 3D model. Using 3D test data conducted by Seabrook (1997), wave-structure interaction relation in 3D effect was modeled and transmission formula for low crested structures was developed. The interaction of wave-structure in the 3D modeling is more complex. The complex, three dimensional wave-structure interactions include diffraction of the wave. Results show the relative crest height, relative wave height and crest width are the most important parameters. The model was developed by statistical analysis method, includes parameters that are considered to be representing physical processes such as water depth fluctuation, hence is related to wave breaking, wave overtopping, dissipation by surface friction, and transmission through the breakwater.
Keywords: Wave transmission, oblique waves, low crested structures.
Abstrak
Pemecah gelombang ambang rendah, termasuk pemecah gelombang tenggelam, dapat dipergunakan sebagai pelindung pantai dari serangan gelombang. Stuktur dengan ambang lebar ini dibangun sejajar pantai dengan puncak berada pada muka air atau sedikit di bawahnya. Fungsi utama dari bangunan ini adalah melindungi pantai dari gelombang dengan cara mereduksi energi gelombang datang atau sebagai penghalang gelombang. Bangunan ini berfungsi dengan baik dengan meredam sebagian energi gelombang. Transmisi gelombang pada pemecah gelombang ambang rendah tumpukan batu sudah banyak diteliti dan menghasilkan beberapa formula yang dihasilkan dari tes 2 dimensi. Gelombang yang datang menyudut terhadap struktur tidak diperhitungkan karena sangat terbatasnya penelitian transmisi gelombang dalam kondisi 3D. Menggunakan data 3D dari Seabrook (1997), analisis dilakukan untuk interaksi gelombang-struktur dan formula empiris transmisi gelom-bang diturunkan. Interaksi gelomgelom-bang-struktur dalam model 3D lebih komleks dari model 2D. Kekompleksan dalam model 3D termasuk adanya proses difraksi pada ujung-ujung pemecah gelombang, Hasil penelitian menunjukkan bahwa tinggi puncak relatif, tinggi gelombang relatif, dan lebar puncak merupakan parameter yang sangat berpengaruh terhadap proses transmisi Rumus empiris diturunkan berdasarkan analisis statistik. Rumus transmisi gelombang memasukkan parameter-parameter yang merepresentasikan proses-proses fisik seperti fluktuasi muka air, yang berkorelasi dengan gelombang pecah, overtopping gelombang, disipasi akibat gesekan permukaan, dan transmisi gelombang melalui bangunan.
Kata-kata Kunci: Transmisi gelombang, gelombang serong, pemecah gelombang ambang rendah.
Design Formulae of Wave Transmission due to Oblique Waves
at Low Crested Structures
I Gusti Bagus Siladharma
Department of Civil Engineering, Faculty of Engineering, Udayana University, Bukit Jimbaran - Bali Email: [email protected]
Jurnal Teoretis dan Terapan Bidang Rekayasa Sipil Jurnal Teoretis dan Terapan Bidang Rekayasa Sipil
1. Introduction
In recent years a number of low-crested structures, including submerged structures, have been built. These structures with a wide crest can be built parallel to the shoreline and the crest is set up below or a little above the water level. The primary function of this structure
and overtopping of the structures will cause wave transmission. There is a decrease in the transmitted energy because of reflection and dissipation of some of the transmitted wave energy.
Numerous studies on stability and wave transformation at low crested structures or obstacles have been con-ducted in the past. As regards wave transformation, early studies involved regular waves at submerged structures (Dick and Brebner, 1968; Dattatri et al., 1978). Also, Petti and Ruol (1991, 1992), Liberatore and Petti (1992), and Driscoll et al., (1992) have inves-tigated submerged structures using irregular waves. Beji and Battjes (1993) investigated the propagation of irregular waves over a submerged obstacle. Losada and Giménez-Curto (1981), and Ahrens and Titus (1985) have described run-up and run-down phenomena on various smooth and rough slopes due to regular and irregular waves. Results show that run-up on smooth slopes is mostly influenced by the surf similarity parameter; while on a rough permeable slope run-up is influenced by friction and permeability of the armour layer.
The behaviour of many types of structures in transmis-sion and reflection was examined by many researchers in different ways; bring many results and expressions (e.g. Dick and Brebner 1968, Dattatri et al,. 1978, Abdul Khader and Rai 1980, Seelig 1980, Alssop 1983, van der Meer 1991, van der Meer and Daemen 1994 and d’Angremond et al., 1996). Seabrook and Hall (1998) tested rubblemound submerged breakwaters with variation in the relative freeboard and the relative crest width within a wide range. Most of the results suggested that water depth and structure geometry are the most significant parameters affecting wave trans-mission. Wave characteristics (wave height and period) and structure permeability was also found to affect wave transmission.
Mostly the above studies were conducted using 2D test model. Effect of 3D model has been rarely involved on the existing formula. In some implementations, low crested structures are not parallel to the coast, therefore wave attack is not perpendicular to the structures
model for wave transmission at low crested breakwa-ters under wave action based on three-dimensional test data conducted by Seabrook (1997). The procedure adopted here was to carry out the regression analysis on a number of primary parameters in order to assess their relative effects on wave transmission. In cases when the primary variables could not represent the relation-ship well, a number of secondary parameters were then derived on the basis of the initial analysis. The primary parameters are the dimensionless parameters derived using dimensional analysis such as the relative crest
height, hc/Hi, the relative crest width, B/Hi, the wave
steepness, Hi/Lo, etc. The secondary parameters are
combination of primary parameters that are assumed to
be important in these processes. Therefore, the development of the design equations undertaken by
assuming the wave transmission is due to the primary parameters and their combinations.
The development of the models considered here use both linear and non-linear forms of equations. A linear model was firstly used in order to determine the rela-tionship between dependent and independent variables. In cases where wave transmission could not be described using the linear model, a non-linear model was used in order to evaluate the relative importance and relationship (direct or inverse) between independ-ent and the dependindepend-ent variables.
2. Brief Description of the 3D Testing by
Seabrook (1997)
The tests were undertaken in the wave basin at Queen’s University Coastal Engineering Research Laboratory, Kingston, Ontario, Canada. The basin is approximately 30m x 35m x 1.2m and equipped with a wave generator that is capable of generating regular and irregular waves. The model was constructed on the flat floor of the basin and a concrete beach was developed at the slope of 1:10 to dissipate wave energy and to minimize the reflection from the testing area. The breakwaters
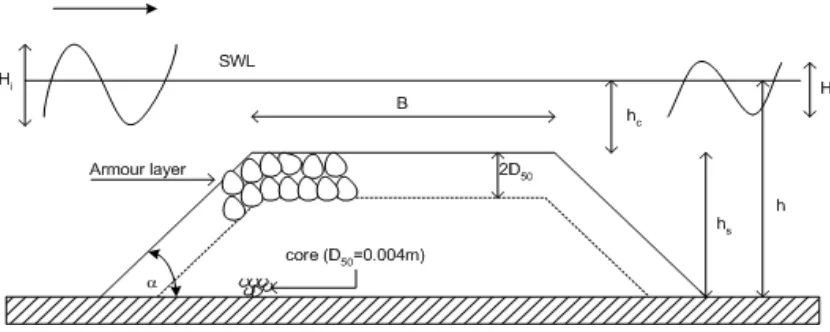
were constructed from stones with D50c = 0.004m for
the core and two layers of armour with D50a = 0.037m.
Three different crest widths were modeled during the tests. A typical cross-section of the breakwater models
Vol. 18 No. 1 April 2011
Figure 1. Cross-section of the breakwater model (not to scale)
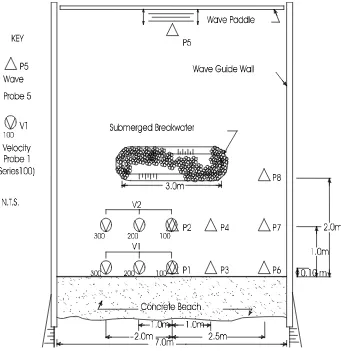
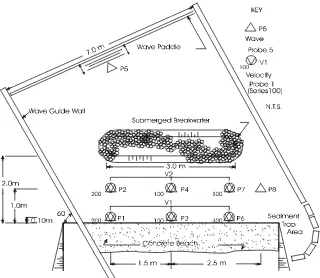
The breakwaters were tested with incident waves at 90° and 60° to the shoreline. In order to minimize the effect of disturbances outside the testing area, waves guides were constructed perpendicular to the wave paddle, from the paddle to the beach. Eight wave probes and two velocity probes were used to measure the wave conditions. One probe was located offshore of the breakwater to define the incident waves and others were located behind the breakwater to define the wave transmission and effect of diffraction. No measure-ments were taken for reflected waves.
Irregular waves were used for all of the wave trains tested. The target waves were generated from a
JON-SWAP spectrum with Philips constant aP = 0.0081
(Philips, 1958) and peak enhancement factor g = 3.3. The heights of targeted waves varied from 0.032m to 0.095m and the wave periods ranged from 0.95sec. to 1.98sec. All data sampling was undertaken using the GEDAP data acquisition system and was analyzed using the GEDAP data analysis package. Detail discus-sion of the GEDAP can be found in Miles (1989). The transmission coefficients were defined at each probe location based on the transmitted significant wave heights. The wave probe located offshore was used to define the incident wave height. A summary of the experiments including the range of specific
dimension-less variables is summarized in Table 1 and the
config-uration of the 3D testing as shown in Figures 2 and 3.
Detail description about this experiment can be found in Seabrook (1997).
3. Diffraction Phenomenon
Theoretical analysis of diffraction of sea waves by breakwaters has been presented by many researchers (e.g. Penney and Price, 1952; Dean and Dalrymple, 1984; Goda, 1985). Even for a relatively simple problem, a calculation of diffraction is quite complicat-ed. Penney and Price investigated the diffraction pro-cess of a long straight breakwater for incident waves from different directions. The problem has been solved
by assuming that the height of the waves is small com-pared with their wavelength, so that the small ampli-tude wave theory may be applied. The solution can be used for uniform water depth and perfectly reflecting structure. For being incident normally, the solution yields the wave crest pattern in the x,y plane and the distribution of the wave height throughout the affected area. When the incident waves approach at an angle to the breakwater, the wave pattern is in polar coordinates (r,j) instead of (x,y) where r is radial distance from the
end and j is an angle from the breakwater (Figure 4).
When waves approaching a structure at a finite length, diffracted waves will occur at each end of the structure. The wave patterns can be developed by combining the results for semi-infinite structure diffraction at each end (Sorensen, 1993). Behind the structure, the height of waves will decrease and along the lines where the wave crests from each end meet, the highest waves will occur as a result of the summation of the heights of the two component waves from the individual diffraction. The effect of diffraction is usually characterized by a diffraction coefficient, Kd, where Kd = Hd/Hi, Hd is the
diffracted height at a point of interest and Hi is the
inci-dent wave height. Diffracted height at the point of in-terest is affected by the radial distance, r, the angle, j,
and the incident wave direction, jo.
3.1 Effect of wave direction
The effect of wave direction in the transmission pro-cess was observed using the data from probe 2 for wave direction of 90º and probe 4 of wave direction of 60º. The two probes were placed at the same position relative to the breakwater and at same distance from
the breakwater. Figure 5 shows the plot of
transmis-sion coefficients, Kt, against the relative crest height,
hc/Hi, for both probes 2 and 4. Plot shows that
The slope angle cot a 1.5
The permeability of the core P permeable
The grading of material D50a/D50c 9.25
* Note: negative hc/Hi ratios indicate submerged conditions
Vol. 18 No. 1 April 2011 L
Hd
Point of interest Incident wave
direction
Breakwater
Incident wave Hi
r
Wave crests
Shadow zone Wave zone
Figure 4. Wave diffraction behind a breakwater for oblique incidence of waves Figure 3. 3D Testing set-up at waves direction of 60º
0.0 1.0 2.0 3.0 4.0 5.0 6.0 7.0
hc/Hi
Figure 5. Effect of incident wave direction (probes 2 and 4 at the same location and distance to
the breakwater)
3.2 Effect of angle of location from the breakwater
In order to evaluate the effect of angle of location of
a point with reference to the breakwater, Figure 6 is
plotted. Transmission coefficients calculated from
probes 2 and 4 both for jo = 90º wave direction are
plot-ted against hc/Hi. Probes 2 and 4 were located on the
centerline of the breakwater at distances of 1m and 2m from the toe of the breakwater, respectively. A general trend can be observed that for higher values of the angle (probe 4), higher transmitted waves occur; agreeing with the theoretical results where for higher value of an angle yields to higher diffraction coefficients as well as
transmission coefficients. Examining Figure 7 where
transmission coefficients from probes 1 and 2 at 90º waves direction are plotted, results in higher transmis-sion for greater angle, j. Again, this confirms the diffraction theory where for greater j, the diffraction coefficient increases, hence higher transmission.
0.0 0.2 0.4 0.6 0.8 1.0 1.2 1.4
0.0 1.0 2.0 3.0 4.0 5.0 6.0 7.0
hc/Hi
Kt
Probe 2
Probe 4
0.5<r/Lp<1.0
Figure 6. Effect of angle from the breakwater to the point of interest at normally incident waves (probes 2 and 4 at the same distance to the breakwater)
0.0 1.0 2.0 3.0 4.0 5.0 6.0 7.0
hc/Hi
Figure 7. Effect of angle from the breakwater to the point of interest at normally incident waves (probes 1 and 2 at the center line of the breakwater)
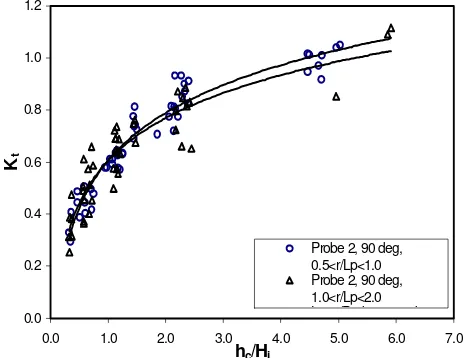
3.3 Effect of relative radial distance, r/Lp
Radial distance of a point of interest on leeward side of
breakwater is a square root of x2 and y2, where x is
distance in x direction and y is distance in y direction from the end of breakwater. In this region the diffracted waves tend to decrease for larger distance x and y since obvious fact that the reduction becomes more effective
farther away the end. Figure 8 shows the plot of the
transmission coefficients from probe 2 at 90º for two
different range of relative radial distance, r/Lp. It shows
that the transmission coefficients for higher values of r/
Lp are slightly lower than lower values of r/Lp. For a
given jo and j values, decreasing wave periods resulting
in larger values of r/Lp and decreasing of diffracted
waves as noted above.
0.0 0.2 0.4 0.6 0.8 1.0 1.2
0.0 1.0 2.0 3.0 4.0 5.0 6.0 7.0
hc/Hi
Kt
Probe 2, 90 deg, 0.5<r/Lp<1.0 Probe 2, 90 deg, 1.0<r/Lp<2.0 L (P b 2 90 d
Figure 8. Effect of relative radial distance from the tip of breakwater to the point of interest at normally
Vol. 18 No. 1 April 2011
4.
Development of Wave Transmission
Model
4.1 General consideration
The considerations herein that were used in developing a relationship in this investigation include a possible range of application in the field. Some of the mecha-nisms and variables involved in the wave transfor-mation, in this case wave transmission processes are water depth, wave breaking over the crest, wave over-topping, dissipation by friction, and penetration through the structures. The wave transmission process-es across the breakwater can thus be dprocess-escribed by the following dimensionless variables (detail discussion about development of the model can be found in Siladharma, 2001):
1. The relative crest height, hc/Hi, or hc/D50a: It
charac-terizes the role of water depth. These parameters are found to be the most important factors affecting the wave transmission mechanism over low crested breakwaters. A decrease in water depth will lead to wave breaking over the crest of the structure, there-by reducing transmission.
2. The relative wave height, Hi/D50a: Wave
transmis-sion increases as the wave height decreases.
3. An internal flow parameter, B2/LpD50a: The
effec-tive flow through the structure increases as the crest width decreases. Also, bigger diameters of armour stone lead to increased void volume thus increasing the flow within the structure.
4. Friction over the surface of the structure: This is seen to be an important parameter affecting wave transmission on a rubble mound breakwater. The
parameter Hihc/BD50a reflects the role of surface
friction.
4.2 Development of the Model
The development of the model was carried out using statistical analysis. Firstly, a correlation in the data was established by plotting the transmission coefficients against dimensional and dimensionless variables. Parameters that were found to be significantly influ-encing the transmission process were then used to de-velop the model. The diffraction process seems to be significantly affecting the transmission of waves in 3D tests besides other processes appear in 2D tests (see Seabrook and Hall, 1998). Therefore diffraction pro-cess that usually occurs in 3D tests was added. It was
evaluated that the incident wave direction, jo, and
length, Lp, radial distance, r, from the tip of the
break-water and angle, j, from the breakbreak-water to the point of interest are all significant in influencing the diffraction process.
It was noted the 3D testing produced sometimes trans-mission coefficients greater than 1.0. Even though this
situation is possible at site specific locations under directional spectral transformation and complex reflec-tion and diffracreflec-tion condireflec-tions, it is likely that 3D test-ing apparatus and analysis procedures have introduced
some error into the measured Kt values (Seabrook,
1997), therefore, any Kt value greater than one was
removed from the data set before developing the model.
Regression analysis was performed within the data sets to find the fitted parameters for predicting the values of
Kt. The resulting alternative design equation of the
regression analysis for Kt is
where Kt is the transmission coefficient, h is the water depth, hc is the depth of submergence or freeboard, hs is the structure height, Hi is the incident wave height, B is the crest width, Lp is the local wave length, D50a is the nominal diameter of armour units, r is radial distance from the tip of the breakwater to the point of interest, j is the angle from the breakwater to the point of interest and jo is the incident wave direction.
It should be noted that several other forms and combi-nations of variables were tested with no significant im-provement in predicting Kt for the range of observa-tions.
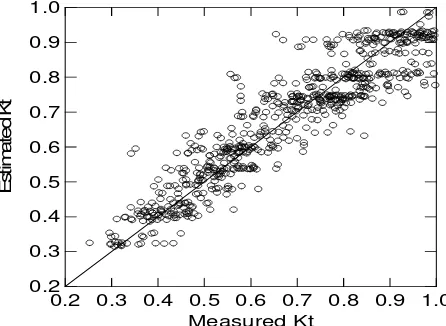
Figure 9 shows a relatively good fit between estimated and measured values and provides adequate answers for
Kt, with the squared correlation coefficient (R2) equal to
0.854 and standard error of estimate (s) being 0.07. The equation shows physical process as related to depth
of submergence, hc/Hi, hence is related to wave
break-ing, the relative crest width, B/Hi, friction by structural
roughness and length, Hihc/BD50a, the internal flow
resistance parameter, B2/LpD50a, and the diffraction
process that is represented by the last term in the above equation.
the crest width, Lp is the local wave length, D50a is the
nominal diameter of armour units, r is radial distance from the tip of the breakwater to the point of interest, j is the angle from the breakwater to the point of interest
and jo is the incident wave direction.
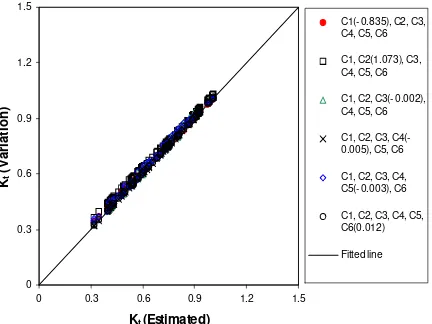
The value selected for hc/Hi was between 0.169 and
3.125, B/Hi between 1.95 and 37.5, Hihc/BD50 between
0.02 and 1.57, B2/LpD50 between 0.29 and 20.62, and
the diffraction term between 0.54 and 1.49. Result
shows that coefficient C2 is the most sensitive having
a minimum variation in the response of about 2.2% and maximum variation of about 4.8%, with the average value being 3.3%. The performance of 3D equation to
predict Kt was also evaluated using 2D data. Figure 11
shows that the 3D equation predicts relatively well Kt
values in the range of 0.4 Kt 0.8.
5. Conclusion
1. The above equation is developed based on the 3D test data for irregular waves. The wave transmission equation includes parameters that are considered to be representing physical processes such as water depth fluctuation, wave overtopping, dissipation due to surface friction, and transmission through the breakwater. The use of the models should be re-stricted to the range of the variables tested. Applica-tion outside this range of variables may result in incorrect estimates.
2. A proposed equation developed to predict Kt based
on 3D data is in a good agreement when comparing
with 2D test data, but seems unable to predict Kt
when the water level at or below the crest level. It should be noted that the equation is derived using 3D testing results conducted for submerged condi-tion; therefore the use of the equation should be for the same condition. However, since the equation is developed using a wide range of variables and rele-vant physical processes, the models may be used for preliminary designs.
6. Acknowledgement
The author would like to thank Stuart Seabrook, Queen’s University, ON, Canada, for making available the valuable datasets.
References
Abdul Khader, M.H. and Rai, S.P., 1980, A Study of
Submerged Breakwaters. Journal of Hydraulic
Research, 18, 2: 113-121.
Ahrens, J.P. and Titus, M.F., 1985, Wave Run-up
Formulas for Smooth Slopes. J. of Waterway,
Port, Coastal, and Ocean Eng., ASCE, Vol. 111, No. 1, pp. 128-133.
Ahrens, J.P., 1984, Reef Type Breakwaters. Proc. of
the 19th Coastal Eng. Conf.,Houston, Texas, pp. 2648-2662.
Allsop, N.W.H., 1983, Low Crest Breakwater, Studies
in Random Waves, Proc. of Coastal Structures
’83, Arlington-Virginia, ASCE, pp. 94-107. Figure 10. Sensitivity of Kt to variation of +95%
confidence interval in regression coeffients
t
Figure 11. Comparison between 3D equation and 2D data for submerged condition
0 0.2 0.4 0.6 0.8 1
0 0.2 0.4 0.6 0.8 1
Kt ba se d on 2-D da ta
E
s
timated
K
t
(3-D E
q
Vol. 18 No. 1 April 2011
Beji, S. and Battjes, J.A., 1993, Experimental
Investi-gation of Wave PropaInvesti-gation Over a Bar, Coastal Engineering, 19, pp.151-162.
d’Angremond, K., van der Meer, J.W., and de Jong,
R.J., 1996,Wave Transmission at Low Crested
Structures, Proc. 25th Int. Conf on Coastal
Engineering, pp. 3305-3318
Dattatri, J., Raman, H. and Shankar, N.J, 1978,
Performance Characteristics of Submerged
Breakwater. Proc. of the 16th Conference of
Coastal Engineering, Hamburg, Germany, pp.2153-2171.
Dean, R.G. and Dalrymple, R.A., 1984, Water Wave
Mechanics for Engineers and Scientists,
Prentice-Hall, Englewood Cliffs, N.J.
Dick, T.M. and Brebner, A., 1968, Solid and
Permea-ble Submerged Breakwaters, Proc. of the 11th
Coastal Engineering Conf., London, England, pp. 1141-1149.
Driscoll, A.M., Dalrymple, R.A. and Grilli, S.T., 1992, Harmonic Generation and Transmission Past
a Submerged Rectangular Obstacle. Proc. of the
23rd Coastal Eng. Conf.,Venice, Italy, pp.1142-1152.
Goda, Y, 1985, Random Seas and Design of Maritime
Structures, U. Tokyo Press.
Liberatore, G. and Petti, M., 1992, Wave Transfor-mations Over a Submerged Bar: Experiments
and Theoretical Interpretations, Proc. of the 23rd
Coastal Engineering Conf., Venice, Italy, pp. 447-459.
Losada, M., Kobayashi, Nobuhisa, and Martin, F.L. 1992, Armor Stability on Submerged
Breakwa-ters. J. of Waterway, Port, Coastal, and Ocean
Eng., Vol. 118, No. 2, pp. 207-212.
Losada, M.A. and Giménez-Curto, L.A, 1981, Flow
Characteristics on Rough Permeable Slopes Under Wave Action, Coastal Engineering, 4, pp. 187-206.
Miles, M.D., 1989, User Guide for GEDAP Version
2.0 Wave Generation Software, Technical Memorandum LM-HY-034, National Research Council of Canada, Ottawa.
Penney, W.G. and Price, A.T., 1952, The Diffraction
Theory of Sea Waves and the Shelter Afforded by Breakwaters, Philos. Trans. R. Soc. London, Series A, 244, pp.236-253.
Petti, M. and Ruol, P., 1991. Experimental Study on the Behaviour of Submerged Detached
Break-waters. Proc. of 3rd Coastal and Port
Engineering in Developing Countries, pp. 167-179.
Petti, M. and Ruol, P., 1992. Laboratory Tests on The Interaction Between Nonlinear Long
Waves and Submerged Breakwaters. Proc. of
the 23rd Conference Coastal Engineering, Venice, Italy, pp.792-803.
Philips, O.M., 1958, The Equilibrium Range in the
Spectrum of Wind-Generated Waves,
J. of Fluid Mechanics, Vol. 4, pp.426-434.
Seabrook, S.R. and Hall, K.R., 1998, Wave Transmis-sion at Submerged Rubblemound Breakwaters,
Proc. of the 26th Coastal Engineering Conf., Copenhagen, Denmark, pp. 2000-2013.
Seabrook, S.R., 1997, Investigation of the Performance
of Submerged Rubblemound Breakwaters, MSc. thesis, Queen’s University, Kingston, Canada.
Siladharma, IGB., 2001, A Study of Transmission,
Reflection and Stability of Low Crested Rubble Mound Breakwaters under Waves Action, Dalhousie University, Halifax, NS, Canada
Seelig, W.N., 1980, Two-dimensional Tests of Wave
Transmission and Reflection Characteristics of Laboratory Breakwaters, Technical Report, No. 80-1, CERC, Vicksburg, Miss.
Sorensen, R.M., 1993, Basic Wave Mechanics for
Coastal and Ocean Engineers, Wiley, New York.
Van der Meer, J.W. and F.R. Daemen, 1994, Stability and Wave Transmission at Low Crested Rubble
Mound Structures, J. of Waterway, Port,
Coastal, and Ocean Eng., ASCE, Vol. 121, No. 1, pp. 1-19.
Van der Meer, J.W., 1991, Stability and Transmission
at Low Crested Structure, Delft Hydraulics Publication No. 453.
Wiegel, R.L., 1962, Diffraction of Waves by a
Semi-infinite Breakwater, J. of Hydraulic Div. ASCE,