This content has been downloaded from IOPscience. Please scroll down to see the full text.
Download details:
IP Address: 114.125.35.35
This content was downloaded on 28/06/2017 at 08:34
Please note that terms and conditions apply.
Morphometric analysis of relative tectonic activity in the
Baturagung Mountain, Central Java, Indonesia
Rahmi Mulyasari1, Budi Brahmantyo1 and Supartoyo2
1
Faculty of Earth Science and Technology, Bandung Technology Institute (ITB), Bandung, Indonesia
2
Center for Vulcanology and Geological Hazard Mitigation, Geological Agency, Bandung, Indonesia
Email: [email protected]
Abstract. Special Region of Yogyakarta and Klaten district, Central Java is one of areas in Indonesia that is prone to earthquake caused by subduction in Indian Ocean and active fault in land. The earthquake sources from active fault probable from Opak and other faults located in Baturagung Mountain. Active faults controlling landform development in tectonically active regions, and it has significantly affected fluvial systems and mountain – front landscapes in the Baturagung Mountain. To assess tectonic activities in the area used quantitative analysis (morphometric). Morphometric analysis consists of 5 parameters geomorphic indices: drainage basin asymmetry (AF), hypsometric curve and integral (Hc and Hi), stream length gradient (SL) index, basin shape index (Bs), and mountain-front sinuosity (Smf). These indices were combined to yield the relative tectonic activity index (RTAI) using geographic information systems (GIS). The result found that RTAI in the study area are divided into three classes: Class 2 (high 0.6% of the watershed area (1.32 km2)); Class 3 (moderate 58.9% (122.1 km2)); and Class 4 (low 40.4% (83.75 km2)). All of morphometric analysis generally indicates this area more influenced by tectonics than erosion. The results are consistent with geomorphological observations.
Keywords: Baturagung Mountain; geomorphic indices; morphometric; active fault.
1. Introduction
Tectonic geomorphology is defined as the study of landforms produced by tectonic processes, or the application of geomorphic principles to the solution of tectonic problems [1]. The quantitative measurement of landscape is based on the calculation of geomorphic indices using topographic maps, aerial photographs and field work. The results of several indices can be combined in order to highlight tectonic activity and to provide an assessment of a relative degree of tectonic activity in an area [1].
Baturagung Mountain is located in Central Java area. This area is one of areas in Indonesia vulnerable to earthquake from subduction zone in Indian Ocean and active fault in land. One of the destructive earthquake sources is from active fault. Destructive earthquake events occurred in this area caused by active fault on 1867, 2006 and 2010 [2].
Opak fault in SE – NW direction inferred as a source of earthquake in this area. In addition there are other faults located in mountain – front zone North of Baturagung which is expected to contribute to the southern Klaten damage [3]. In general, faults that caused earthquake is located in Baturagung Mountain. Therefore, the analysis of this area was related to Baturagung Mountain.
2. Data and Method
Data used in this study are Shuttle Radar Topography Mission digital elevation model (SRTM DEM) data with spatial resolution of 30 m which is available freely from the USGS website [4], geological map (Yogyakarta and Surakarta – Giritontro sheets) data from geological research and development centre [5,6], and topographical map data from geospatial information agency [7]. All of the data were used to calculated geomorphic indices in morphometric analysis.
Morphometry is defined as quantitative measurement of landscape shape. At the simplest level, landforms can be characterized in terms of their size, elevation (maximum, minimum or average), and
slope. Quantitative measurements allow geomorphologists to objectively compare different landforms and to calculate less straightforward parameters that may be useful for identifying a particular characteristic of an area such as level of tectonic activity [1].
This study applied morphometric analysis in Baturagung Mountain to evaluate relative tectonic activity rates. Considering the diversity of the morphotectonic features [1], we analyzed five geomorphic indices: drainage basin asymmetry (AF), hypsometric curve and integral (Hc and Hi), stream length gradient index (SL), basin shape index (Bs), and mountain – front sinuosity (Smf). All of parameter values computed in a single index as relative tectonic activity index (RTAI) [8] to characterize relative tectonic activity. Morphometric analysis used spatial tools geographic information systems (GIS) arcGIS 10 software and Microsoft Excel. This kind of methodology has been used to analyze various active areas such as Sarvestan area, Iran [8], Cimandiri Fault, Indonesia [9] and Lembang Fault, Indonesia [10]. The results from morphometric analyses were also validated in field based on geomorphological observations.
3. Result and Discussion
3.1. Morphometric analyses
Morphometric analyses were used to identify relative rates of active tectonics in study area. Five geomorphic indices parameters were analysed, including drainage basin asymmetry (AF), hypsometric integral (Hi), stream length gradient index (SL), basin shape index (Bs), and mountain-front sinuosity (Smf) [1,8]. Result of geomorphic indices values were classified into three classes tectonic activity: Class 1 (more active), Class 2 (active) and Class 3 (less active) (Table 1) [8]. Most of these indices are obtained for river basins. Two major rivers flow in study area (Dengkeng River and Oyo River) were subdivided into 65 subbasins.
Table 1. Relative tectonic activity index (RTAI) based on morphometric parameters [8].
No. Morphometric
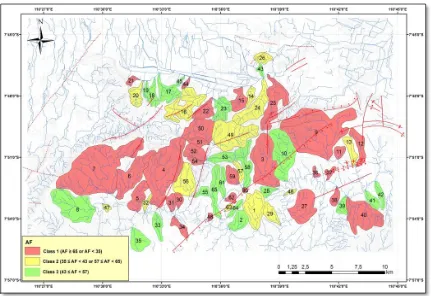
The drainage basin asymmetry (AF) can be used to evaluate tectonic tilting at the scale of a drainage basin [1]. AF defined as (1):
AF = 100 (Ar/At) (1)
were grouped into three classes: 1 (AF≥65 or AF<35), 2 (35≤AF<43 or 57≤AF<65), and 3 (43≤AF<57) [8] (Figure 1; Table 2). Class 1 and 2 of AF dominantly located at faults zone (Figure 1).
Figure 1. Map of AF analyses. Colour red, yellow, and green area indicate class 1, class 2, and class 3.
3.1.2. Hypsometric curve and integral (Hc and Hi)
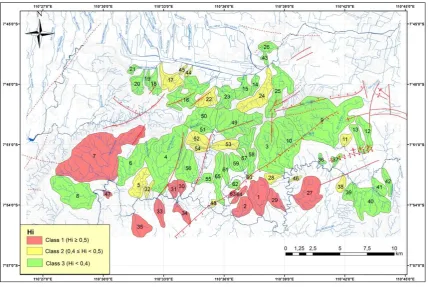
The hypsometric integral (Hi) describes the relative distributions of elevations in a given area of a landscape particularly a drainage basin. The index is defined as the relative area below the hypsometric curve and thus expresses the volume of a basin that has not been eroded. A simple equation to approximately calculate the index is (2):
Hi= (average.elev. – min.elev.) / (max.elev – min.elev) (2)
Figure 2. Map of Hi results. Colour red, yellow, and green area indicate young, mature, and old stages.
Figure 3. Hypsometric curves of three subbasins.
3.1.3. Stream length gradient index (SL)
SL correlates to stream power. SL index is sensitively to change in channel slope by tectonic activity, rock resistance, and topography. SL index defined as (3):
SL = (ΔH/ΔL) L (3)
ΔH/ΔL is the channel slope and L is the total channel length from the watershed divide to midpoint
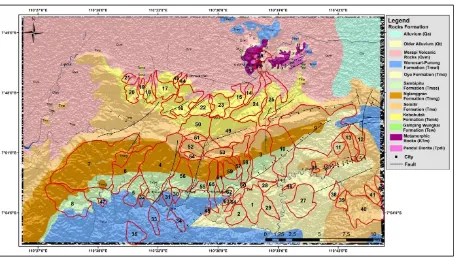
that valley profile steeply, deep incision, and possible as a fault zone and represent tectonic activity [1]. Lithology in study area is related to rock resistance which showed in geological map (Figure 4).
Figure 4. Geological map of study area.
SL is calculated along rivers using a digital elevation model (extracted from a digitized 1:25000 topographic map) and GIS (Figure 5 and 6) to compute its value for each subbasin. The value ranges from 16.70 to 995.85. The values were classified into three categories: Class 1 (SL≥500), Class 2 (300≤SL<500) and Class 3 (SL<300) [1]. The result of the classification is shown in Table 2. Calculation of SL at subbasins show high additional value with steep topography that flowed by the stream. The high changing of SL value occurred because of structural zone not because of lithological changing.
Figure 6. Longitudinal river profiles and measured SL values for three subbasins in the study area.
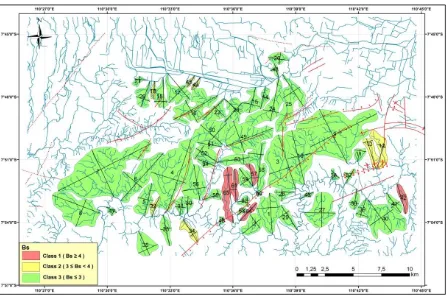
The horizontal projection of a basin may be described by the basin shape index or the elongation ratio, Bs defined as (4):
Bs = Bl / Bw (4)
Bl is the length of a basin measured from the highest point and Bw is the widest point. Relatively
young drainage basins in tectonically active areas tend to be elongated in shape, normal to the topographic slope of mountain [1].
Bs was computed using DEM and classified into three classes: 1 (Bs≥4), 2 (3≤Bs<4) and 3 (Bs≤3) [4]. Bs ranges from 0.44 (subbasin 36) to 6.31 (subbasin 65). The result of the classification is shown in (Figure 7; Table 2). Generally, based on Bs analysis, study area dominated by class 3, presence of class 1 and class 2 were influenced by tectonic activity at subbasin.
Figure 7. Basin shape index. Colour red, yellow, and green area indicate class 1, class 2, and class 3.
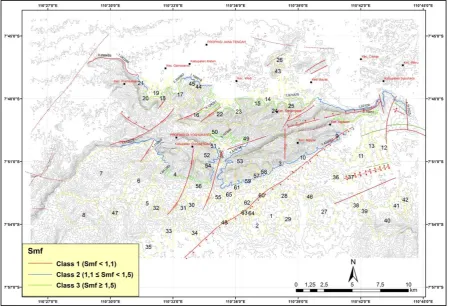
3.1.5. Mountain – front sinuosity (Smf)
Mountain-front sinuosity is defined as a topographic transition zone between mountains and plain [11]. Smf is define as (5):
Smf = Lmf/Ls (5)
The values of Smf was calculated for 17 mountain front (Figure 8; Table 2) using Smf and Ls values measured from SRTM image, and divided into three classes: 1 (Smf<1.1), 2 (1,1≤Smf<1.5),
and 3 (Smf≥1.5). Smf values ranges from 0.99 to 4.12. Generally, class 1 and class 2 of Smf occurred with structural zone in study area.
Figure 8. Smf index. Colour red, blue, and green indicate class 1, class 2, and class 3.
3.2. Spatial distribution of index values
Five morphometric parameters and lineament have been calculated to analyze the activity of Baturagung Mountain. The result found that AF is far from value 50 indicates the presence of tectonic tilting, hypsometric curve shows that this area belongs to young-mature topography, SL more than 300
indicating of active tectonic, Bs ≥ 4 indicating elongated shape of basin related to active tectonic, and Smf value is less than 1.5 indicating straight of mountain-front sinuosity as a lineament fault zone.
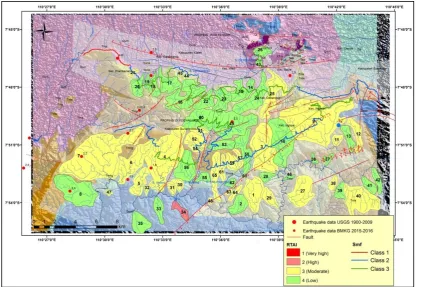
This study tried to evaluate tectonic activity in Baturagung area by using some of geomorphological parameters. The average of the five parameter measured geomorphic indices (RTAI) was used to evaluate the distribution of relative tectonic activity in the study area [8]. The values of the index were divided into four classes to define the degree of active tectonics: 1 – very high (1.0≤RTAI<1.5); 2 – high (1.5≤RTAI<2.0); 3 – moderate (2.0≤RTAI<2.5); and 4 – low (2.5≤RTAI) [8].
Figure 9. Relative tectonic activity index (RTAI) map. Colour pink, yellow, and green area indicate class 2, class 3, and class 4.
4. Conclusions
The result found that RTAI in the study area are divided into three classes: Class 2 (high 0.6% of the watershed area (1.32 km2)); Class 3 (moderate 58.9% (122.1 km2)); and Class 4 (low 40.4% (83.75 km2)). All of morphometric analysis generally indicates this area is more influenced by tectonics than erosion. The results are consistent with geomorphological observations (Figure 10). Class 3 is with more steep hills than Class 4.
Figure 10. Geomorphological observations; Class 4 (A) and Class 3 (B).
5. References
[1] Keller EA and Pinter N 2002 Active Tectonics: Earthquakes, Uplift and Landscapes (New Jersey: Prentice Hall) p 338
[2]Supartoyo, Surono and Putranto ET 2014 Katalog Gempabumi Merusak di Indonesia Tahun 1612 – 2014 (Bandung: Pusat Vulkanologi dan Mitigasi Bencana Geologi, Badan Geologi, Departemen Energi dan Sumber Daya Mineral) p 133
[3]Supartoyo, Hidayati S and Subandriyo 2016 Opak fault inferred from morphotectonic analysis (preliminary result) Proceedings of International Conference (Jogja Earthquake in Reflection 2016) pp 28-35
[4]United State Geological Survey (USGS): Shuttle Radar Topography Mission (SRTM) 30 M, http://earthexplorer.usgs.gov/ (Retrieved June 20, 2016)
[5]Rahardjo W, Sukandarrumidi and Rosidi HMD 1995 Geological Map of Indonesia Quadrangle: Yogyakarta, Jawa, Scale 1: 100000 (Bandung: Geological Research and Development Centre) [6]Surono, Toha B, and Sudarno I 1992 Geological Map of Indonesia Quadrangle: Surakarta –
Giritontro, Jawa Scale 1: 100.000 (Bandung: Geological Research and Development Centre) [7]Badan Informasi Geospasial (BIG): Peta Rupa Bumi Indonesia (RBI), Scale 1:25000,
http://tanahair.indonesia.go.id/ (Retrieved June 20, 2016)
[8]Dehbozorgi M, Poukermani M, Arian M, Matkan AA, Motamedi A and Hosseiniasi A 2010 Quantitative analysis of relative tectonic activity in The Sarvestan Area, Central Zagros, Iran
Geomorphology 03284 pp 1 – 13
[9]Supartoyo 2008 Tektonik aktif Sesar Cimandiri, Kabupaten Sukabumi, Provinsi Jawa Barat Thesis
Institut Teknologi Bandung (unpublished)
[10]Hidayat E 2009 Analisis morfotektonik Sesar Lembang Thesis Institut Teknologi Bandung (unpublished)
[11]Bull WB 2007 Tectonic Geomorphology of Mountain: A New Approach for Paleoseismology
![Table 1. Relative tectonic activity index (RTAI) based on morphometric parameters [8]](https://thumb-ap.123doks.com/thumbv2/123dok/3992882.1936302/3.595.85.514.526.635/table-relative-tectonic-activity-index-rtai-morphometric-parameters.webp)