M – 6
RECOVERY OF THREE-PARAMETER LOGISTIC AND MULTIPLE-CHOICE
ITEM CHARACTERISTIC CURVE: A SIMULATION STUDY IN
MATHEMATICS TESTING
Abadyo
State University of Malang, Indonesia
Abstract
This simulation study investigated the recovery item and person parameters of three-parameter logistic and multiple-choice models for mathematics testing in selected-response format test. A potential problem with such the study is the accuracy of simultaneous estimation of item and person parameters in item response theory.
Item responses were simulated using three-parameter logistic and multiple-choice models. Samples of 400, 1000, and 3000 simulated examinees and tests lengths of 20, 40, and 60 were generated. The response patterns according to models was run in PARSCALE. The root mean squared error between recovered and actual item characteristic curves served as the principal measure of estimation accuracy for items. The data were analyzed using the fixed effect MANOVA on RMSE ability, RMSE item parameters estimate to identify the significant main effects.
The result of the study indicate that the differences of the perfomance between three-parameter logistic and multiple-choice models on the format test analysis in mathematics subject are significant at the level of = .05. Each model which generated ability estimation and item parameter is significantly different. Multiple-choice model provided higher accurate estimation than three-parameter logistic model. In addition, the test information given by multiple-choice model is three times higher than three-parameter logistic model although it could not offer a solid conclusion related to the sample size on each test length which gives the optimal score of test information.
Key words: parameter recovery, mathematics testing, simulation study
INTRODUCTION
Today the use of item response theory (IRT) to estimate the ability of the person and item parameters can be done simultaneously. The software that supports this work include PARSCALE and MULTILOG. Several techniques for estimating the parameters in the software are the maximum likelihood procedure (Baker and Kim, 2004, pp. 23 , 63 ) ; logistic regression (Reynolds, Perkins and Brutten, 1994, pp.1-13 ); and Bayesian estimation procedure( Mislevey, 1986, pp. 177-195 ; Baker and Kim, 2004, pp. 303-305) .
items are scored using 3PLM is L(xk, ai , bi, ci ) =
parameters and f is the item response function of 3PLM.
All estimation procedures have similarities and differences that make them more or less favored by researchers in accordance with the situation. CML procedure does not require assumptions about the distribution of the population that must be satisfied, but this procedure requires the use of sufficient statistics and therefore CML can't be used for any type of item analysis. JML procedure depends on prior knowledge of the abilities and therefore may not be able to provide consistent estimates on the number of examinees ability in the data set, while the MML procedure maximizes the log likelihood equations and this is an alternative for joint estimation method for ability and item parameters. MML treat examinees parameters as
nuisance or incidental parameters and excludes from the likelihood function by assuming that the parameters of the examinees were drawn at random from a abilities population whose distribution according to the density function g () (Master and Wright, 1997, pp. 101-121). MML procedure has several advantages compared with the maximum likelihood procedures other. One of the advantages of this procedure can be used on all models of the IRT and efficient for all l test length (Si, 2002, p. 39 ). Estimated of item standard error in the MML is a good estimate of the expected sampling variance. Therefore, this MML can provide a good estimate for the complete scores of the examinees and not lose information even though the test length altered by adding or reducing items.
Nonetheless, this MML also has some drawbacks or limitations. First, using the MML estimation requires complex calculations and sophisticated. Second, the distribution of ability must be assumed. If distribution of ability previously unknown, then it is assumed normal. Actually, ability distribution can be estimated from the data. So it should not be forced to assume a normal distribution of ability , because it seems the effect of this assumption is not maximal. MML estimation procedure ( Bock and Aitkin, 1981, pp. 443-459 ) .
In this study, the procedure for estimating the ability and test items parameters is MML. Some literature recommends the use of this MML between other maximum likelihood methods, because the combination of Bayesian MAP and EAP estimation in MML can be used to estimate the parameters both in scoring and calibration items. The software used to estimate these parameters is PARSCALE ( Muraki and Bock, 1996, pp. 257). PARSCALE can be used to analyze all scoring models both dichotomous and polytomous. Dichotomous models are treated as a special case of certain polytomous models.
interpret data (EPAS, 2008, p. 28).
One of the goals of the mathematics test is to assess the ability of the examinees in the transfer of quantitative reasoning and problem solving skills from one context to another . Therefore, this mathematics test gives a wide range of questions to ensure that the examinees continuously be challenged with new situations. Items in this mathematics test includes four levels of cognitive, namely knowledge and skills, direct application, understanding of concepts, and the integration of conceptual understanding .
Cognitive development in mathematical thinking and the ability to provide mathematical proof is based on the basic aspects of the human being, namely perception, action and the use of language and symbolism that enables us to develop advanced concepts that make sense are growing into the sophisticated knowledge structure. It is based on what is called the sensory -motor language of mathematics (Tall, et al ., 2012, p.1).
Based on the description of cognitive development in mathematical thinking it would require a mathematics test that can capture the characteristic response pattern of the mathematical cognitive abilities. The format of the conventional multiple-choice items were generally scored as dichotomous using 1PLM, 2PLM, or 3PLM, in the field of mathematics can also be suspended in polytomous using multiple-choice models (MCM). The rationale that the multiple-choice items that can be scored in polytomous is the each option able to describe the stages of partial knowledge to the option (key) which describes the knowledge or ability to perfect. In addition, the MCM is derived from the nominal models. So, even though the options were not explicitly indicate partial knowledge tiered, MCM is still able to work well for analyzing multiple-choice items .
This study for evaluating estimates of item and person parameters. Hulin, Lissak, and Drasgow (1982, p. 250) examined recovery of the item characteristic curve (ICC) for the two- and three-parameter logistic models. According to them that an ICC computed from estimated item pameters could be very close to the ICC computed from actual item parameters. They found that estimates of ability and item parameters were less accurate in small sample size when item responses were generated by three-parameter logistic model. The present study examines recovery of ICC for thre-parameter logistic and item category characteristic curve (ICCC) for multiple-choice models.
Studying the recovery of item parameters in IRT corresponds to studying the recovery of regression equation coefficient. The examination of recovery of both the ICC and ICCC coresponds to investigating the mean square error prediction in multiple regrssion. In most applications of IRT, the main interest lies in both the ICC and ICCC. Item parameters are only a convenient means for summarizing both the ICC and ICCC. It is possible that both an ICC and ICCC computed from estimated item parameters could be very closed to the ICC or ICCC computed from actual item parameters despite large errors of estimation for the parameters. If this is true, estimation accuracy should be studied by comparing recovered and actual ICCs or ICCCs.
RESEARCH METHOD
This research is a simulation study. The goal of this study was to examine the recovery of both the ability and item parameters under various conditions in the fixed effects factorial 3 x 3 x 2 design. The first factor consists of three types of test length, or number of test items, equaled 20, 40, or 60; longer tests typically provide more reliable measurement and therefore more accurate calibration. The second factor consists of three types of sample sizes. The sample sizes used were 400; 1,000; and 3,000 examinees; again, higher numbers are expected to provide more accurate calibration. The third factor consists of two types of IRT models.
Generation of Item Responses
Simulation data generated using MS Excel 2007 software based on National Exam response data on mathematics lesson for junior high schools in Yogyakarta 2003. Generation of the data was carried out by researcher himself with the following steps.
Firstly, test the unidimensional assumption by using exploratory factor analysis (EFA) on the set of National Exam items for junior high schools in Yogyakarta 2003 on mathematics lesson. Initially, 40 items that do not meet the assumption of unidimensional. Once the data is reduced repeatedly, obtained a set of items (33 items) that meet unidimensional assumption that as indicated by the scree plot in Figure 1 below.
Figure 1. Scree plot of the results of the EFA on 33 items of National Exam items for junior high schools in Yogyakarta 2003 on mathematics lesson .
Secondly, based on the results of the first step generated ability using PARSCALE 4.1 program and the ability is assumed as actual ability (actual theta). Theta distribution normality was tested by using MINITAB 16 and the results show that theta distribution is not normal . After editing the data, it turns out there are quite a lot of outliers that causes asymmetric distribution. By reducing some of the values including the extreme value and then test the normality of the distribution of the ability repeatedly then finally obtained a normal distribution with a mean of 0.1466 and 0.8803 standard deviations of the ability of 2323 examinees. This is shown by the results of Anderson-Darling normality test in Figure 2.
Thirdly, a random sample size of 400, 1000, and 3000 are taken from a normal
distribution of the ability using a random sampling with replacement technique by MINITAB program 16. These samples contain response data that has been generated using MS Excel 2007 in the second step. This data is the result of scoring by using 3PLM and MCM according to the test length variations that have been mentioned before.
The variables were controlled in this simulation study are 3PLM and MCM scoring models, simulation sample size, and the test length. Response variables in this simulation study is the accuracy of parameter estimation item described by root mean square error (RMSE), test information function (TIF), and the standard error of estimate (SE() and SE(PAR)).
The RMSE has the advantage of being in the same metric as the item parameters. It is examinees' answers and replicated five times so that there are 90 data sets are given extension PRN. The number of replications used in simulation studies of IRT models in the past varied from as few as 5 to as many as 100 replications (Kamata, 1998). Therefore, this study employed 5 replications for each combinations of conditions based on suggestions from these Monte Carlo studies. Each data set is run in PARSCALE 4.1 by using the syntax that has been developed previously. The output of each combination of design is theta estimates and item parameter estimates (slope, location, guessing parameters estimates). Accuracy of this parameter estimation was evaluated using the criteria of the root mean squared error method (RMSE) and the standard error index.
RESULT AND DISCUSSION
Two-way fixed effects MANOVA employed on the RMSE () and RMSE (PAR) on the main effects of models, samples , and test length to answer the research question, the effect of 3PLM and MCM to: (1) the accuracy of ability and item parameters; (2) optimization of Test Information Function (TIF); and (3) a decrease in the estimated standard error. Only the main effects are examined its significance, because the interaction of its incorporation into the testing error statistics for each cell of all the combinations of factors that contains only one datum (Bastari , 2000, p.31 ). The effect size of the significant factors were evaluated using values of partial eta square ( 2 ) and the criteria of Cohen (1988 ) which states that if the value 2 = 0.1 ; 0.25; 0.4, the effect of these factors will be small, medium, and large respectively. The MANOVA in the study employed the significance level = 0.05.
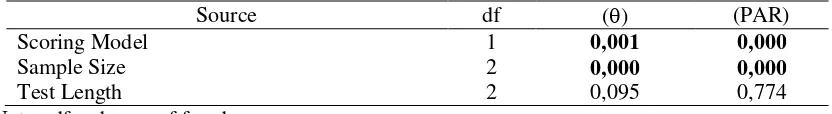
The results of MANOVA showed that the Pillai’s Trace and the Wilks’ Lambda statistical scores were significant except for the test length and these results were presented in the Table 1. The results of MANOVA showed the p-values for the main effects with RMSE as
the dependent variable for (θ) and (PAR). It had been apparent in the Table 1 that all of the main
effects, except the test length, had significant F value. On the other hand, for RMSE (θ) the scoring model factor and the sample size had 2 values respectively as follows: 0,213; 0,480. Thesevalues implied that the sample size was the only factor that had large influence while the scoring model had moderate influence. For RMSE (PAR) the 2 scores were respectively as follows: 0,474; 0,730. Therefore, the sample size and the scoring model were the factors that had large influence.
Table 1. p values from the Results of MANOVA for RMSE
In order to ease the interpretation toward the results of MANOVA, the researchers performed a graphic analysis from the plots that stated the comparison between the results of
RMSE (θ) marginal mean estimates and those of RMSE (PAR) marginal mean estimates in terms of the 3PLM scoring model and the MCM scoring model according to the sample size and the test length. Figure 3 and 4 depicted the results of RMSE (θ).
Figure 3. RMSE (θ) Marginal Mean Estimates Figure 4. RMSE (θ) Marginal Mean Estimates according to the Sample Size according to the Test Length
Overall, from Figure 3 and 4 it had been apparent that the scores of RMSE (θ) marginal
mean estimates in terms of MCM scoring model were smaller than those of 3PLM scoring model. The finding implied that the scoring model of MCM provided high accuracy in
estimating the RMSE (θ) marginal mean estimates than that of 3PLM. Furthermore, it had also
been apparent that the larger the sample size and the longer the test length, the smaller the
scores of RMSE (θ) marginal mean estimates would be. The finding implied that the larger the sample size and the longer the test length more accurate would be in estimating the RMSE (θ) marginal mean estimates. Figure 5 and 6 depicted the results of RMSE (PAR).
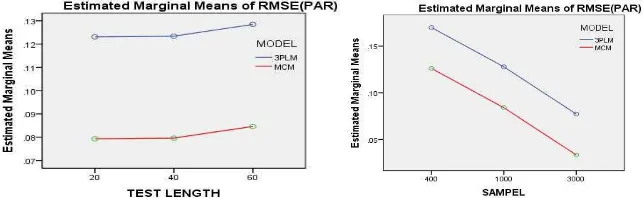
Similar to Figure 3 and 4, in overall from Figure 5 and 6 it had been apparent that the scores of RMSE (PAR) marginal mean estimates in terms of MCM were smaller than those of 3PLM. The finding implied that the MCM provided higher accuracy in estimating the RMSE (PAR) marginal mean estimates than the 3PLM/GRM combination. However, for the test length, the estimation accuracy were reversed namely the smaller the sample size the more accurate the result would be.
Figure 5. RMSE (PAR) Marginal Mean Estimates Figure 6. RMSE (PAR) Marginal Mean
Estimates according to the Sample Size according to the Test Length
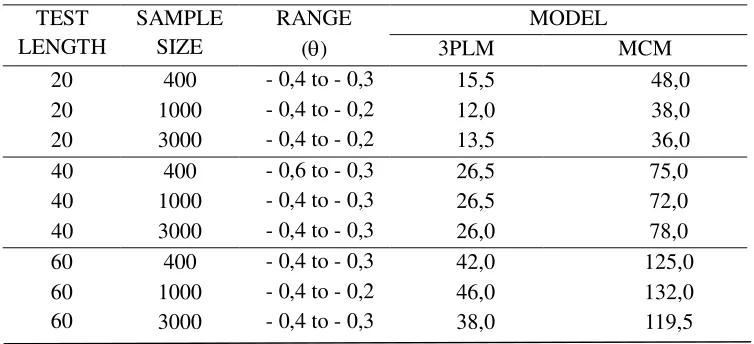
the comparison showed that the TIF optimal values given by 3PLM method were almost one-third from those of MCM method.
The other research question was related to the estimates’ standard error derivation. Similar to the first research question, in order to answer the research questionthe researchers performed fixed effect MANOVA on the RMSE-S.E (θ) and the RMSE-S.E(PAR). Table 3 contained the p-values of MANOVA on the RMSE-S.E. for (θ) and (PAR).
The results of MANOVA in the RMSE.S-E were similar to those of MANOVA in the
RMSE for (θ) and (PAR) with the significant Pillai’s Trace and Wilks’ Lambda values, except for the test length. It had been apparent in Table 3 that all of the main effects, except the test length, had significant F values. Meanwhile, for the RMSE-S.E (θ) the scoring model and the sample size had 2 values respectively as follows: 0,102; 0,530. These values implied that the sample size was the only factor that had big influence while the scoring model test item was the factor that had small influence. For the RMSE-S-E (PAR) 2 values respectively as follows: 0,340; 0,517. Therefore, the sample size was the only factor that had big infuence while the scoring model was the factor that had moderate and small influence.
The results of graphic analysis for RMSE.S-E (θ) were similar to those of RMSE (θ) and there had been consistency that the larger the sample size, and the longer the test length the more accurate the estimates would be. Similarly, for the graphic analysis of RMSE.S-E (PAR) there had been consistency with the graphic analysis of RMSE (PAR) namely the shorter the test length the more accurate the estimates would be toward the RMSE-S.E marginal mean estimates.
Table 2. The Comparison of Optimal Values in the Total Test Information from the Scoring model of 3PLM and the Scoring model of MCM
TEST
Table 3. p-values from the Results of MANOVA for RMSE-S.E
Source df () (PAR)
CONCLUSION AND SUGGESTION Conclusions
Based on the explanation on the results of the study, the researchers would like to draw the following conclusions.
First, the scoring model provides significant effect or influence in the level = 0,05 toward the examinees' ability (θ) estimates accuracy. The scoring of MCM model is more accurate than that of 3PLM model in estimating the ability. The larger sample size and the longer test length, the more accurate the ability (θ) estimates will be.
Second, the MCM scoring model has more accurate estimates on the item parameter than that of 3PLM model and the larger sample size more accurate the estimate results; however, the finding does not apply to the test length. By means of RMSE criteria, the estimates generated by both models will be more accurate if the M-C test item and the test length are smaller and shorter. In addition, the factors which have big influence are the scoring model and the sample size. On the other hand, the test length does not have significant F value in the level = 0,05.
Third, in general the researchers would like to state that the scoring model of MCM has provided the test information value three times higher than that of 3PLM. In addition, for all of the test length the position of maximum test information value leads to the ability (θ) marginal estimates distribution. However, the researchers are unable to draw a “solid” conclusion regarding the sample size in each test length that provided the optimum test information value.
Fourth, the ability (θ) estimates standard deviation error as well as the test parameter decrease under the estimation by means of MCM in comparison to that of 3PLM. This finding implies that the MCM scoring model is more accurate in estimating the ability (θ) and the test item parameter than the 3PLM is.
Suggestions
The test developers, especially the ones who are responsible for the National Examination and the State University Admission Test, should consider the use scoring model of MCM for multiple-choice item in order to attain as much information as possible regarding the examinees’ ability. In relation to the matter, there should be considerations as well toward the wide-scale scoring implementation for the essay test items.
Then, the future researchers who would like to follow up the study are recommended to: (a) develop the scoring model composition for mixed item format, for example the 3PLM/GRM combination, the MCM/GPCM combination and alike; (b) the numbers of response category in the study are made similar and there are four categories, therefore it is still possible that these categories might be developed into five categories or might be made different among the combined models because the researchers have not found the effects of the increase or the decrease on the model or even the unsimilarity of the response categories between the combined models; and (c) the criteria on the robustness test on the model during the unidimensionality assumption is violated because the data initiation for the IRT model combinations is assumed to be dimensional.
REFERENCES
Baker, F. B., & Kim, S. H. (2004). Item response theory: Parameter estimation
techniques. (2nd ed.). New York: Marcel Dekker.
common proficiency scale. (Doctor dissertation, University of Massachusetts Amherst, 2000). UMI Microform9960735.
Bock, R. D., & Aitken, M. (1981). Marginal maximum likelihood estmation of item parameters: Application of an EM algorithm. Psychometrika, 46, 443-459.
Educational Planning and Assessment System (EPAS) College Readiness Standards and Program of StudiesStandards Alignment Introduction.(2008). Test:
Mathematics. pdf ebooks. Downloaded at November 10 , 2011, from
http://www.education.ky.gov/
Hulin, C. L., Lissak, R. I., & Drasgow, F. (1982). Recovery of two- and three-parameter logistic item characteristic curve: A monte carlo study. Applied psychological measurement, 6, 249-260.
Kamata, A. (1998). Some generalizations of the Rasch model: An application of
the hierarchical generalized linear model. A dissertation for Ph.D. Michigan State University.
Masters, G. N. (1982). A Rasch model for partial credit scoring. Psychometrika, 47, 149-174.
Masters, G. N. & Wright B. D. (1997). The partial credit model. In W. J. van der Linden & R. K. Hambleton (Eds.), Handbook of modern item response theory. (pp. 101-121). New York, NY: Springer-Verlag.
Mislevy, R. J. (1986). Bayes modal estimation in item response models.
Psychometrika, 51, 177-195.
Muraki, E. & Bock R. D. (1996). PARSCALE: IRT based test scoring and item
analysis for graded open-ended exercises and performance tasks (third ed.).
Chicago, IL: Scientific Software International.
Reynolds, T., Perkins, K., & Brutten, S. (1994). A comparative item analysis study of a language testing instrument. Applied Psychological Measurement, 11,1-13. Si, C. B. (2002). Ability estimation under different item parameterization and scoring
models. Unpublished doctoral dissertation, University of North Texas.
Downloaded at Juni18, 2011, from http://digital.library.unt.edu/ark: /67531/metadc3116/m1/1/high_res_d/dissertation.pdf
Tall, D. O., et al. (2012). Cognitive development of proof. In ICMI 19: Proof and Proving in
http://homepages.warwick.ac.uk/staff/David.Tall/pdfs /chapter1_about_this_book.pdf