* Partly presented at the 124th JSAM Kansai Branch Annual Meeting at Okayama University in August 2010 and at SPIE Defense Security and Sensing 2011 at Orlando Florida USA in April 2011
*1 JSAM Member, Corresponding author, Graduate School of Agriculture, Kyoto University, Sakyo-ku, Kyoto 606-8502, Japan ; [email protected]
*2 JSAM Member, Graduate School of Agriculture, Kyoto University, Sakyo-ku, Kyoto 606-8502, Japan
*3 Tokyo R&D Center, Panasonic Corporation, Saedo-cho, Tsuzuki-ku, Yokohama City Kanagawa, 224-8539, Japan
I Introduction
Quantitative analysis of sugar in solution is not only important in fermentation and brewing processes but also in the manufacture of soft drinks. High Pressure Liquid Chromatography (HPLC) method can measure accurately sugar components like glucose, fructose and sucrose (Shaw, 1988). However it is difficult to apply to production line measurement. Recently the use of a spectroscopic-based method for sugar determination is becoming popular. Among the available spectroscopic methods, visible-near infrared (Vis-NIR) spectroscopy and mid-infrared (MIR) spectroscopy have been well established, with advance development of instrumentation and a broad range of its application, including the food industry (Lanza & Li, 1984; Kemsley et al., 1992; Giangiacomo & Dull, 1986; Sivakesava & Irudayaraj, 2000). Both the NIR and MIR spectroscopic methods are faster than HPLC, no or little sample preparation is necessary and they are more suitable for process control applications.
In MIR spectroscopy, the use of attenuated total reflectance (ATR) method together with chemometric method for analysis of sugars in solution or powder samples have been well reported (Wilson & Tapp, 1999). De Lene Mirouze et al. (1993) used principal component regression (PCR) and partial
least squares (PLS) regression to determine glucose concentration in glucose syrup. Quantitative analysis of glucose and other sugars (maltose, maltotriose, and maltodextrines) using PLS regression was also reported by Bellon-Maurel et al. (1995a; 1995b). Dupuy et al. (1993) also used PLS regression to quantify the glucose concentration in powdered sugar.
In the terahertz (THz) region, Hirori et al. (2004) showed the possibility of using the ATR method in the THz region to study distilled liquid water. Later Jepsen et al. (2007) used terahertz reflectance time-domain spectroscopy (THz-TDS) in the low frequency range (0.1-1.0 THz) to show the potential of this region for the determination of sugar (sucrose) concentration. However the use of ATR-THz spectroscopy especially in the low and high frequency (0.6 to 13.5 THz) together with chemometric method for measuring glucose concentration has not yet been reported. This region, especially in low frequency (0.3- 6 THz, or 10-200 cm-1) has rich information with intramolecular and intermolecular vibrational modes of biological molecules (Laman et al., 2008). While NIR and MIR spectroscopy utilize electromagnetic waves which correspond to stretching or bending motions of individual bonds in the molecule, in contrast, in far infrared or the THz region electromagnetic waves correspond to motions
A Quantitative Study for Determination of Glucose Concentration Using
Attenuated Total Reflectance Terahertz (ATR-THz) Spectroscopy
*
Diding SUHANDY
*1, Tetsuhito SUZUKI
*2, Yuichi OGAWA
*2, Naoshi KONDO
*2,
Hirotaka NAITO
*2, Takeshi ISHIHARA
*3, Yuichiro TAKEMOTO
*3, Weijie LIU
*3Abstract
In this work, a quantitative study for glucose concentration determination was conducted using ATR-THz spectroscopy. Glucose solutions with different concentrations were prepared and their absorbance spectra between wavenumber 19.285 cm-1 and 451.261 cm-1 were acquired using a terahertz-based Fourier transform spectrometer.
The spectra of glucose solutions in different concentrations were compared and discussed. The results showed that increasing glucose concentration caused decreasing absorbance. Calibration models for glucose determination were developed using partial least squares (PLS) regression for original and pre-processing spectra. The calibration model using Savitzky-Golay second derivative spectra gave satisfactory results. The use of ATR-THz spectroscopy combined with an appropriate chemometric method has potential for a rapid determination of glucose concentrations in aqueous solution.
of the entire structure (Laman et al., 2008).
THz waves had not been studied practically for a long time because of the difficulty of generating and detecting THz waves compared with the better-established technologies of optics and electronics. However, the recent development of THz devices has opened the possibility to apply THz waves in many fields (Mantsch & Naumann, 2010). THz spectroscopy is the study of interactions between matter and electromagnetic waves in the terahertz spectral region from 300 GHz (λ = 1 mm) to 10 THz (λ = 30 μm) (Dexheimer, 2007). The THz region is located between microwave and far infrared waves. THz waves have properties of both sides of the electromagnetic spectrum. Like microwaves, THz wave can be transmitted through a wide variety of substances such as paper, cloth, ceramics, plastics, and wood. Like infrared, THz wave can easily be propagated through space and reflected using THz optical devices.
Since water has strong absorption in the THz region, attenuated total reflectance (ATR) method was used as sample presentation to obtain spectroscopic information of glucose in solution. In this study, we will show the potential of using ATR-THz spectroscopy coupled with appropriate chemometric methods as an analytical method for the determination of glucose concentrations in aqueous solutions especially in monocomponent solutions.
II Materials and Methods
1. Materials
Fifty samples of various glucose concentrations were prepared by dissolving appropriate amounts of glucose powder (Grade: Guaranteed Reagent (GR); Nacalai Tesque, Inc., Kyoto, Japan) in distilled water. The ranges of concentrations were from 0.5 to 30% (mass percent, w/w). For each sample, 300 μL of glucose solution were used for spectral acquisition. The samples were then divided randomly into two sets, calibration and validation sample sets. The calibration sample set was used to develop a calibration model. The developed calibration model was validated using the validation sample set (known as external validation). The characteristics of the two samples are explained in Table 1.
Table 1 Properties of calibration and validation sample sets used for glucose concentration determination
Items Calibration set Validation set
Number of samples 30 20
Maximum value 26.85 27.26
Minimum value 0.73 1.34
Mean 14.65 12.78
Standard deviation (SD) 7.73 7.93
Units %(w/w) %(w/w)
2. Spectral acquisition method
Spectra of glucose solutions were acquired using a terahertz-based Fourier Transform spectrometer (FARIS-1S, JASCO Co., Tokyo, Japan). This spectrometer was equipped with a high pressure mercury lamp as light source and a pyroelectric sensor made from deuterated L-alanine triglycine sulfate (DLATGS) as detector. The whole system was vacuumed and all spectra measurements were conducted under 150 Pa of air pressure. The spectrum of air was used as a reference and was repeated for every five samples. Each spectrum was acquired using 16 cm-1 of resolution and 200 scans for averaging both the sample and the reference. Using this parameter, the interval for each spectral acquisition is 3.857 cm-1. During THz spectral measurement, the temperature and the related humidity were kept around 25°C and 70% respectively. The software Spectral Manager for Windows (JASCO Spectral Manager, JASCO co., Tokyo, Japan) was used to control the spectral acquisition. The absorbance spectra of samples were acquired three times for each sample and its average value was used for ATR correction. The corrected ATR absorbance values then were imported to The Unscrambler® version 9.8 (CAMO, Oslo, Norway), a statistical software for multivariate analysis.
Fig. 1. The schematic diagram of spectral measurement using ATR-THz spectroscopy
3. Attenuated total reflectance (ATR) in THz region
In the past the transmission method of infrared spectroscopy was very popular and widely used. However, since water has strong absorbance in the THz region, it is difficult to obtain a good spectrum of a solution sample using the transmission method. Instead of using the transmission method, for our sample solutions we used the ATR method. Here, the main part of ATR is a silicon ATR prism that has a higher refractive index than the sample (Figure 1). THz waves generated from the high-pressure mercury lamp go to the silicon prism and generate evanescent waves. Evanescent waves then penetrate the sample. The penetration depth of our ATR system can be calculated using the following equation
θ
To Detector Silicon ATR prism
sample
THz wave (20-450 cm-1)
n1
n2
θ =45°
Sample in contact with evanescent wave n1= Refractive index of Silicon
(Nishikida et al., 1996; Buffeteau et al., 1996).
n
andn
2are the refractive indexes of the silicon prism and glucose solution, respectively.Our ATR system has effective wavenumber 20-450 cm-1 or
wavelength 22-500μm. For this, our ATR penetration depth is from 1.42 to 43.48 μm.
4. Spectral analysis
The average spectra from 3 replicates were processed using different pre-processing methods. Spectral pre-processing is required to remove any irrelevant information such as noise and scattering effect. Recently many pre-processing method are available in the commercial chemometric analysis tools. Some pre-processing was used, including smoothing (moving average and Savitzky-Golay smoothing), multiplicative scatter correction (MSC), standard normal variate (SNV), Norris derivative and Savitzky-Golay first and second derivative. The averaging technique is used to reduce the number of wavelengths or to smooth the spectrum of glucose solutions. It is also used to optimize the signal-to-noise ratio (Cen & He, 2007). The MSC technique was useful to correct any additive and multiplicative effects included in the spectra (Gomez et al., 2006). The derivation of spectra is used to remove the shift baseline and superposed peak (Swierenga et al., 1999). Calculation of derived spectra based on Savitky-Golay is very popular to improve calibration models. Principal component analysis (PCA) was performed before developing the calibration model to determine any relevant and interpretable structure in the data and to detect outliers (Naes et al., 2002; Adams, 1995). PCA searches for directions of maximum variability in sample grouping and uses them as new axes called principal components (PC) that can be used as new variables, instead of the original data, in further calculations (Blanco & Villarroya, 2002). PCA results showed that there were no outliers detected in calibration and validation data sets.
Partial Least Squares (PLS) regression was used to develop the calibration model for original and pre-processing spectra. PLS finds the directions of greatest variability by considering not only spectral data but also glucose concentration data, with new axes, called PLS factors (F) (Blanco & Villarroya, 2002). A low number of factors were desirable in order to
avoid inclusion of any signal noise in the developed model (Xiaobo et al., 2007). All of these analyses were performed using The Unscrambler® version 9.8 (CAMO, Oslo, Norway), a statistical software for multivariate analysis. A student’s t-test was performed using Statistical Package for the Social Science (SPSS) version 11.0 for Windows in order to evaluate the significance level of the developed model.
The quality of the calibration model was evaluated using the following statistical parameters: coefficient of determination between predicted and measured glucose concentration (R2), standard error of calibration (SEC), standard error of prediction (SEP), bias between actual and predicted glucose concentration and ratio prediction to deviation (RPD) value (RPD = SDvalidation set/SEP) (Brereton,
2000). A value of R2indicates the percentage of the variance in the Y variable (glucose concentration) that is accounted for by the X variable (spectral data). As mentioned by Saeys et al. (2005), a calibration model with R2 value greater than 0.91 is
considered to be an excellent calibration, while an R2value between 0.82 and 0.90 results in good prediction (Williams, 2003).
A small difference between SEC and SEP value was also important to avoid ‘over-fitting’ in the calibration model (Gomez et al., 2006). The calibration model should have as high as possible RPD value. The RPD value is desired to be larger than 3 for an acceptable calibration (Williams, 2007). An RPD value less than 1.5 indicates incorrect predictions and the calibration model cannot be used for further prediction (Saeys et al., 2005).
III Results and Discussions
1. Typical ATR spectra of glucose solution in THz region
lowering is that the increasing of glucose concentration was followed by decreasing the amount of free water in glucose solution due to intermolecular hydrogen-bonding interactions (Arikawa et al., 2008). Additionally, the spectral differences displayed in Figure 2 mainly depends on the differences of the volumetric fractions of water in the aqueous solution between the three samples.
Fig. 2. Typical ATR spectra of glucose solution with different concentration in terahertz region
2. Developing the calibration model for glucose concentration determination
Using the PLS regression method the calibration and validation was performed for original and pre-processing spectra (Table 2). Calibration model using the PLS method should have low number of factors (F) to optimize the prediction model and to avoid over-fitting. Furthermore, the best calibration model can be characterized as follows. These are high coefficient of determination (R2), low standard error of calibration (SEC), low standard error of prediction (SEP) and low bias. The ratio of standard error of prediction to standard deviation (RPD) value was the other important parameter used for evaluating the performance of the calibration model. For a good prediction model, a high RPD value is required (Williams, 1987).
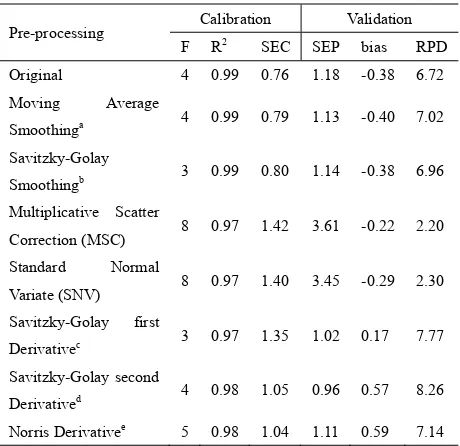
The calibration model with the original spectra resulted in a high coefficient of determination (R2=0.99). The pre-processing of spectra was effective in improving the calibration model, except for MSC and SNV spectra. For smoothing spectra, the calibration model was improved by moving average and Savitzky-Golay. Using derivative spectra, all pre-processing including first, second Savitzky-Golay and Norris derivative significantly improved the quality of the calibration model as the SEPs were decreased. The best calibration model was for Savitzky-Golay second derivative spectra which had the lowest SEP and highest RPD value
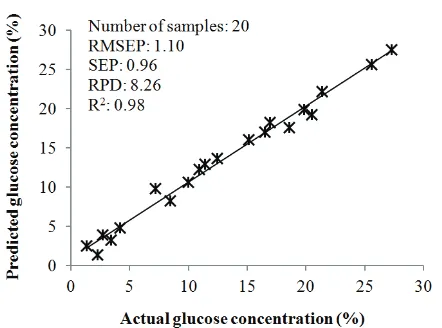
(Table 2). This calibration model was comparable to that reported by Sivakesava & Irudayaraj (2000) for individual glucose concentration determination in mid infrared region with R2 = 0.99 and SEC = 0.5~0.7%. The scatter plot between actual and predicted glucose concentration in the best calibration model is presented in Figure 3.
Table 2. Calibration and validation results using different pre-processing spectra
Pre-processing Calibration Validation
F R2 SEC SEP bias RPD
Original 4 0.99 0.76 1.18 -0.38 6.72
Moving Average
Smoothinga 4 0.99 0.79 1.13 -0.40 7.02
Savitzky-Golay
Smoothingb 3 0.99 0.80 1.14 -0.38 6.96
Multiplicative Scatter
Correction (MSC) 8 0.97 1.42 3.61 -0.22 2.20 Standard Normal
Variate (SNV) 8 0.97 1.40 3.45 -0.29 2.30
Savitzky-Golay first
Derivativec 3 0.97 1.35 1.02 0.17 7.77
Savitzky-Golay second
Derivatived 4 0.98 1.05 0.96 0.57 8.26
Norris Derivativee 5 0.98 1.04 1.11 0.59 7.14 a
Number of segments: 11
b Number of segments:3, polynomial order: 2
c Left and right averaging: 26.999 cm-1, polynomial order: 2 d Left and right averaging: 61.712 cm-1, polynomial order: 2 e Number of segments:9
Fig. 3. Scatter plot between actual and predicted glucose concentration of the best calibration model
concentration in the THz region. For this purpose, the regression coefficient in the best calibration model for glucose was plotted against the wavenumber as demonstrated in Figure 4. For glucose, high positive coefficients were found at wavenumber 115.708 and 150.42 cm-1. High negative coefficients were found at wavenumber 250.701 and 312.412 cm-1. The wavenumber of 150.42 and 250.701 cm-1 should be associated with shifting of the water absorbance as was demonstrated in Figure 1. The wavenumber of 115.708 and 312.412 cm-1 could be associated with glucose. It is clear that regression coefficient in low frequency (20-200 cm-1) is 2 times higher than that in high frequency (200-400 cm-1) which indicated that the influence of intermolecular hydrogen-bonding is higher than that of the intramolecular vibration mode. From this result, glucose concentration determination in the THz region is mainly driven by intermolecular mode arising from hydrogen-bonding interaction between water and glucose which is different in mechanism comparing to the mid infrared region.
Fig. 4. Regression coefficient plot for glucose concentration calibration in wavenumber range of 20-450 cm-1
3. Validation of calibration model
The validation of original and pre-processing calibration models resulted in low SEP except for MSC and SNV spectra (Table 2). The performance of the validation using the best calibration model of Savitzky-Golay second derivative spectra was excellent, since it had the lowest SEP and highest RPD value. Scatter plot of validation result between actual and predicted values using the best calibration model is presented in Figure 5. By a 95% confidence paired t-test, there were no significant differences between measured and predicted glucose concentration. This result showed that a calibration model for determination of glucose concentration using ATR-THz spectroscopy was successfully developed and was well validated.
Fig. 5. Scatter plot between actual and predicted glucose concentration in validation step
IV Summary and Conclusions
ATR-THz spectroscopy provides an easy, direct and reliable method to obtain glucose solution spectra in the THz region. The potential use of ATR-THz spectroscopy together with appropriate chemometric techniques for glucose concentration determination has been demonstrated. The calibration model for glucose concentration determination was developed and was well validated. The best calibration model using Savitzky-Golay second derivative spectra resulted in lowest SEP and very high of RPD value. The role of intermolecular of hydrogen bonding in glucose concentration determination in terahertz region was also clarified. This promising result can be applied for rapid analysis of glucose concentration in monocomponent solutions. This method has advantage over other spectroscopy methods since THz waves can penetrate various materials such as paper, cloth and woods. To apply THz spectroscopy in food analysis, in more complex solutions, we need further investigation. For example, the presence of other sugars such as fructose and sucrose can influence intermolecular of hydrogen bonding inside solutions. These can be investigated by developing calibration models in multicomponent (binary and tertiary) solutions.
V Acknowledgement
The authors express their gratitude to Dr. Malcolm Fitz-Earle, Emeritus Professor at Capilano University, Canada for his valuable help in revision of the manuscript.
References
Adams, M. J. 1995. Chemometrics in analytical spectroscopy. RSC, Analytical spectroscopy monographs, The Royal Society of Chemistry, Cambridge, UK.
hydration state in solution using terahertz time-domain attenuated total reflection spectroscopy. Chemical Physics Letters,457: 12−17. Bellon-Maurel, V., C. Vallat, and D. Goffinet. 1995a. Quantitative
analysis of individual sugars during starch hydrolysis by FT-IR/ATR spectrometry. Part I: Multivariate calibration study--repeatibility and reproducibility. Applied Spectroscopy, 49(5): 556−562.
Bellon-Maurel, V., C. Vallat, and D. Goffinet. 1995b. Quantitative analysis of individual sugars during starch hydrolysis by FT-IR/ATR spectrometry. Part II: Influence of external factors and wavelength parameters.Applied Spectroscopy, 49(5): 563−568. Blanco, M. and I. Villarroya. 2002. NIR spectroscopy: a rapid
response analytical tool. Trends in Analytical Chemistry, 21: 240−250. Brereton, R.G. 2000. Introduction to multivariate calibration in
analytical chemistry. Analyst, 125: 2125−2154.
Buffeteau, T., B. Desbat, and D. Eyquem. 1996. Attenuated total reflection Fourier transform infrared microspectroscopy: Theory and application to polymer samples. Vibrational Spectroscopy, 11: 29−36. Cen, H., and Y. He. 2007. Theory and application of near infrared
reflectance spectroscopy in determination of food quality. Trends in Food Science & Technology, 18: 72−83.
De Lene Mirouze, F., J.C. Boulou, N. Dupuy, M. Meurens, J.P. Huvenne, and P. Legrand. 1993. Quantitative analysis of glucose syrups by ATR/FT-IR spectroscopy. Applied Spectroscopy, 47(8): 1187−1191. Dexheimer, S.L. (Ed.). 2007. Terahertz spectroscopy: principles and
applications. CRC Press, New York.
Dupuy, N., M. Meurens, B. Sombret, P. Legrand, and J.P. Huvenne. 1993. Multivariate determination of sugar powders by attenuated total reflectance infrared-spectroscopy. Applied Spectroscopy, 47(4): 452−457.
Giangiacomo, R., and G.B. Dull. 1986. Near Infrared spectrophotometric determination of individual sugars in aqueous mixtures. Journal of Food Science, 51(3): 679−683.
Gomez, A.H., Y. He, and A.G. Pereira. 2006. Non-destructive measurement of acidity, soluble solids and firmness of Satsuma mandarin using Vis/NIR-spectroscopy techniques. Journal of Food Engineering, 77: 313−319.
Heyden, M., E. Brundermann, U. Heugen, G. Niehues, D.M. Leitner, and M. Havenith. 2008. Long-range influence of carbohydrates on the salvation dynamics of water−answers from terahertz absorption measurements and molecular modeling simulations. Journal of American Chemical Society, 130: 5773−5779.
Hirori, H., K.Yamashita, M. Nagai, and K. Tanaka. 2004. Attenuated total reflection spectroscopy in time domain using terahertz coherent pulses. Japanese Journal of Applied Physics, 43(10A):1287−1289.
Jepsen, P.U., U. Moller, and H. Merbold. 2007. Investigation of aqueous alcohol and sugar solutions with reflection terahertz time-domain spectroscopy. Optics Express, 15 (22): 14717−14737.
Kemsley, E.K., L. Zhuo, M.K. Hammouri, and R.H. Wilson. 1992. Quantitative analysis of sugar solutions using infrared spectroscopy. Food Chemistry, 44: 299−304.
Laman, N., S.S. Harsha, D. Grischkowsky, and J.S. Melinger. 2008. High-resolution waveguide THz spectroscopy of biological molecules. Biophysical Journal, 94:1010−1020.
Lanza, E. and B.W. Li. 1984. Application for near infrared spectroscopy for predicting the sugar content of fruit juices. Journal of Food Science, 49: 995−998.
Mantsch, H.H., and D. Naumann. 2010. Terahertz spectroscopy: The renaissance of far infrared spectroscopy. Journal of Molecular Structure: 964, 1−4.
Naes, T., T. Isaksson, T. Fearn, and T. Davies. 2002. A user-friendly guide to multivariate calibration and classification. NIR Publications, Chichester, UK.
Nishikida, K., E. Nishio., and W. Hannah. 1996. Selected applications of modern FT-IR techniques. Gordon and Breach, New York, USA. Ogawa Y., L. Cheng, S. Hayashi, and K. Fukunaga. 2009. Attenuated
total reflection spectra of aqueous glycine in the terahertz region. IEICE Electronic Express, 6(2): 117−121.
Saeys, W., A.M. Mouazen, and H. Ramon. 2005. Potential for onsite and online analysis of pig manure using visible and near infrared reflectance spectroscopy. Biosystems Engineering, 91(4): 393−402. Shaw, P. E. 1988. Handbook of sugar separations in food by HPLC.
CRC Press, Boca Raton, FLA.
Sivakesava, S., and J. Irudayaraj. 2000. Determination of sugars in aqueous mixtures using mid-infrared spectroscopy. Applied Engineering in Agriculture, 16(5): 543−550.
Swierenga, H., A.P. De Weijer, R.J. Van Wijk, and L.M.C. Buydens. 1999. Strategy for constructing robust multivariate calibration models. Chemometrics and Intelligent Laboratory Systems, 49: 1−17. Williams, P. 2003. Near-infrared Technology-Getting the Best Out of
Light. PDK Grain. Nanaimo, Canada.
Williams, P. 2007. Grains and seeds. In Near-Infrared Spectroscopy in Food Science and Technology, ed. Y. Ozaki, W.F. McClure and A.A. Christy, ch. 7, 165‐217. Hoboken, N.J.: John Wiley & Sons, Inc. Williams, P.C. 1987. Variables affecting near infrared reflectance
spectroscopic analysis. In Williams, P. Norris, K. (Eds.), Near-infrared technology in the agriculture and food industries” (pp. 143−167). Am. Soc. of Cereal Chemists Inc., St. Paul Minn. Wilson, R.H., and H.S. Tapp. 1999. Mid-infrared spectroscopy for
food analysis: recent new applications and relevant developments in sample presentation methods. Trends in Analytical Chemistry. 18(2): 85−93.
Xiaobo, Z., Z. Jiewen, H. Xingyi, and L. Yanxiao. 2007. Use of FT-NIR spectrometry in non-invasive measurements of soluble solid contents (SSC) of “Fuji” apple based on different PLS models. Chemometrics and Intelligent Laboratory System, 87: 43−51.