Available online at http://ijasc.pasca.unand.ac.id
International Journal of Agricultural Sciences
Graduate Program Universitas Andalas
Journal homepage: http://ijasc.pasca.unand.ac.id
* Corresponding author
E-mail address: [email protected]
CO2 Emission Estimation from Transportation Usage and
Cyclingconsideration in the Context of Green Campus, Naresuan
University, Thailand
Taweesak Taekratok
aand Supansa Luansak
b*
a
Faculty of Engineering, Naresuan University, Thailand
bRoad Safety Research Unit,Faculty of Engineering, Naresuan University, Thailand
ARTICLE INFO
Article history:
Received 12 June 2017
Received in revised form 9 January 2018
Accepted 20 January 2018
Keywords:
CO2 estimation
University and green sustainable Climate change
Green transportation
ABSTRACT
Naresuan University was ranked 4th out of 22 Universities of Thailand by the Green Metric World University Ranking of Indonesia in 2016. In the conceptual of green university, this study aim to find out how much the transportation usage especially motorbike sub-sector release CO2 emission, to estimate travel cost patterns of students within the university and the satisfaction level of students, faculties, and employees with the incentive to follow the green transportation policy in being switched from motorbike usage into cycling. The questionnaires were interviewed for 654 samples by 5% of total students from year 1 to 3.The result of study found that about 89% of students ride motorbike to school and its average per student per 3 times travel a day. The source of motorbike is the most release CO2 emission about 514.75 Kilo carbon/hour followed by car about 85.05 kilo carbon/hour. Lastly, the major reason can force people switching the mode of transportation with the satisfaction is to creating a shadow over the bike path. This result of study can encourage the university develop and plan the green campus in the context of sustainable for future.
1. Introduction
Mobility is an essential human need. Human survival and societal interaction depend on the ability to move people, and goods. Efficient mobility systems are essential facilitators of economic development. Cities could not exist and global trade could not occur without systems to transport people land goods cheaply and efficiently (WBCSD, 2002). Transport today plays a crucial
and growing role in world energy use and emissions of GHGs. In 2004, transport energy use amounted to 26% of total world energy use and the transport sector was responsible for about 23% of
world energy – related GHG emissions
(IEA,2006b). As well as, Thailand was reported to
release the Co2 emission according to
the climate change issued, the fourth Assessment report of the Intergovernmental Panelon Climate Change (IPCC) forecasts that a post-industrial temperature rise is very unlikely to stay below 1.5
oC and likely to rise above 2oC (IPCC, 2007c). A
change in temperature of over 2 oC is considered to
be at a ‘dangerous’ level, meaning it may
destabilize the climate system (Hansen and Schellnhuber, 2006). As of world transportation sector accounted for 14.3% of greenhouse gas (GHG) emissions in 2005, electricity and heat accounted for 24.9% and industry 14.7%, but ahead of agricultural, land use change, and wasted (EPA,2005). To encourage the mitigation plan on the cause of climate change specifically in transportation, Naresuan University was attempted to force students, faculties, and employees to choose the vehicle types is bicycle instead of motorcycle and car by the rule of order from the top of management role. Without the implement and study plan, people denied to follow of using the bicycle inside the campus. This research study will provide what the reason why students, faculties, and employees selected of using their own vehicle according to travel from their home/dormitory-work-home/dormitory. To be encourages people in green vehicle mind shall be development in both short and long term plan management.
To meet with the hypothesis of this research study that expected to send a reminding message to policy maker of university to be resolved the less parking, public transportation and increasing of
climate change issued self-awareness. The
objectives of this paper is to study the travel demand model over all the travel system such as side walk, bicycle lane, motorcycle lane, and electrical bus inside the campus. As well as, monitoring the factors can potentially support people consideration of using bicycle inside the
campus. To estimate the Co2 emission of how much
does the emission will release and increase greenery of people mind according to climate change issued.
The Statement of Problem
Naresuan University campus has already
ranked in 4th out of 22 Universities of Thailand in
the context of friendly to the environment. It was
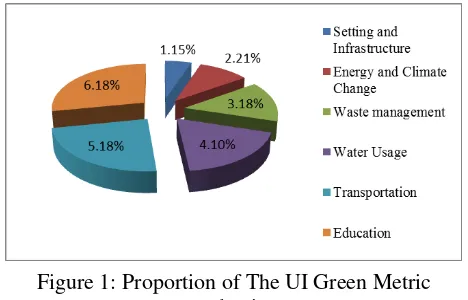
ranked by the Green Metric World University Ranking of Indonesia. The measurement to judge the green campus consists of 6 criteria as follow: Setting and Infrastructure (location and structure infrastructure), Energy and Climate Change (energy management and weather), Waste management, Water Usage (water management), Transportation, and Education and the proportion presented in figure 1 below.
Figure 1: Proportion of The UI Green Metric evaluation
Source: (Naresuan University, 2016)
The university paid attention to these indicators and being successful in improving the campus environment to be clean and green. However, move toward through next proceed, university still need
to clarify the meaning for “Sustainability Term”.
Even though the university succeed in the top 5 ranked as it mentioned, many students, staffs, and faculties still not being clear understood and contradict to this successful green campus specifically in transportation sector.
Rationale of this study
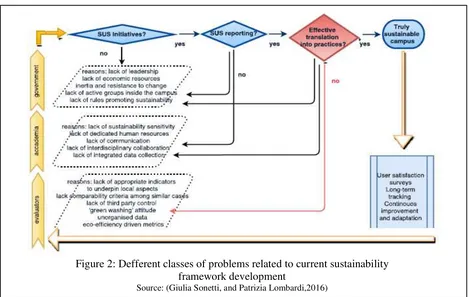
presents that there are many factors on the unreal sustainability term of green campus practices.
Firstly, the left yellow box is to indicate the responsibility for the implementation of solutions involved with the absence of sustainability (SUS)
initiatives. The second box is SUS reporting.
Third box is effectived translation into practices? and its report in such inefficacy in reporting such initiatives in terms of practical outcomes. In the light blue rectangle is on the right-hand side, the
procedure is needed to demonstrate “truly
sustainable campus” as it present the detailed in the
blue ellipse. To interpret this effect of the CSA framework in to practice, the evaluation gap has a function
as a bridge and it is presented by the red rhombus step. The weaknesses point can be break down into
two main level are following: the macro-level is the inability to compare different campuses; the micro
– level is the inefficacy of some indicators in
representing actual sustainability performance as it result coming from the red arrow.
Certainly, there is no right or wrong to agree or disagree toward the boxes and the categories of problems outline in the diagram below. The potential result could be no correlation between sustainability and reporting activities, in contrast some may considered into both of synonymous. There are many question has been raising up in what sustainability is and why. As well as, the data
used for ranking is just as a signal of “institutional
performativity”.
Figure 2: Defferent classes of problems related to current sustainability
framework development
Source: (Giulia Sonetti, and Patrizia Lombardi,2016)
University and Green Sustainable Definition
The definition of sustainable is to ensure that it meets the need of the present
without compromising the ability of future generations to meet their own needs. The WCED
go on to say “The concept of sustainable
development does imply limits – not absolute limits
but limitations imposed by the present state of
technology and social organization on
environmental resources and by the ability of the biosphere to absorb the effects of human activities. But technology and social organization can both be manage and improved to make way for a new era of economic growth (UNEP, 2013).
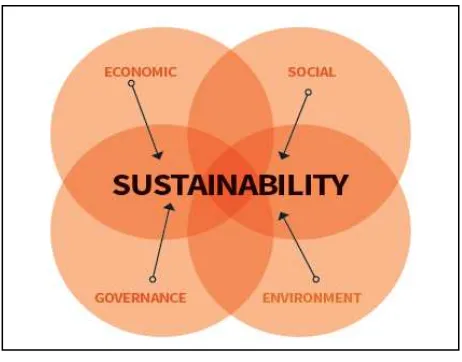
The four sustainable issued are generally
recognize for distinct “capitals” which are
producing economy: economics, social, governance, and environment as it present in figure 3: To achieve the environmental sustainablility goal, a framework or process is needed. As well the criteria have to be met with the steps in the process
toward “sustainability”. Therefore, sustainable
development can be define whereby human strive toward sustainability. The combination between human and natural systems are need to be enable adaptation to change indefinitely following.
Basicaly develop for qualitative, improvement
but not accually focusing on quantitative growth.
Maintain and raise the natural capital stocks,
which cannot sustainably be substituted by other forms of capital.
Connect social equity in development present
quality of life for future development plan
Reconise the cultural diversity and cultural as a
central to adaptive process of realizing sustainability.
Figure 3: The quadruple bottom line Source: (United Nations Environment Programme, 2013)
The University was adopted green transportation polity
The non-motorized and car transport policy as
it called “Active Transport” was adopted to active
in some part of Naresuan University campus. It essentially refers to walking and cycling as it related with the infrastructure, policies, and education as it mentioned earlier as one part of the indicators of the UI Green Metric. The university provided 500 bicycles and it was available for whoever walking passing by in the cycle parking.
These modes had been greatly promoted recently last year in a short period of time. Suddenly, most of student, faculties, and staffs protested to stop this policy. They preferred to ride their own motorbike as it used to be. This can be a one example that the university failed because of no scenario on the
“truly sustainability green campus”. This lesson
and learn can indicated that to achieve the environmental sustainability goal, a framework or process is needed.
Objectives, Scope and Limitation
The overall objectives is to estimate the CO2
emission in the transportation sector specially motorbike sub-sector where it is the highest
proportion of usage and finding what’s the major
that force people changed the mode of
transportation from driving or motorbike to cycling.
In addition, how was the amount of CO2 emission
release to atmosphere involving with the
transportation sector ranking inside university campus.
The scope and limitation in this study are; (1) The boundary of this study in only scoping inside the university campus (2) The sample of questionnaires was conducted for 650 students from year 1 to 3 who travels around in the campus only.
Condition of Research Location
Naresuan University located in Lower North part of Thailand is called Phitsanulok Province. The province is located away from Bangkok about 350 kms. The university land area is approximately 1,300 Rais and provides cutting-edge programs for 22 faculties and colleges. In order to provide the academic knowledge, research, and study in many
varity major areas, Thereare such a huge amount of
students attending in the university right now. Off course, the university has to provide facilities such as building, equipment, furniture, where it group in to the setting and infrastructure. Moreover, students
have also to travel from their home/dormitory –
class – home/dormitory, while faculties and staffs
regional to destination by driving or ride
motorbikes, all vehicles are released Co2 emission
by consumed gas. These activities lead many problems inside the campus such as insufficient of parking lot and electricity buses, pollution, traffic, and travel delay according to traffic congestion. This study is set the scope and limitation to seek the transportation sector only.
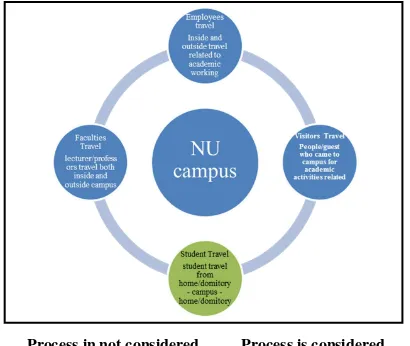
Activities considered for Co2 emission inventory
The travel activities taken into consideration for estimation are presented in Figure 4 below. The activites have been categorize by selecting the the Bilan Carbone tool as a reference. Travel in term of students/faculties/staffs refers to home/dormitory-campus/office-home-dormitory. The activities data are listed below.
Employees travel data shall be cover inside
and outside the university. That’s mean all
activities related to university and
academic should be accounted for the data.
Visitors travel data mean people who travel
for their purpose to the campus. The activities can assume that travel by the distance depend on the vehicle used.
Students and faculties rely on to the
inventory where can assume the data from the distance and type of vehicle.
The employees travel, faculties travel, and visitors travel are not taken into account as this data is not included in the scope and limitation. In addition, the data is too difficult to collect and estimate in the given timeframe.
Process in not considered Process is considered
Figure 4: Travel Inventory
2. Methodology
The Co2 emission estimation
For the Co2 emission estimation on the transportation sector is based calculation follow with equation below
Where;
Carbon Dioxide result to activity i
inside community c
Emission Factor used for activity i
Emission factors were used that depend on the area where this study followed with Thailand Green House Gasses Organization (TGO).
Data Collection
Primary data collection refers to the 654 questionnaires were sample interviewed students from year 1 to 3. The major questions consists of
gender, level education, income, type of
transportation, cost of fuel for transportation, time
travelling from start point – destination, and
satisfaction to change mode of transportation to cycling. Secondary data refers to the past research case, article, journal, and other.
3. Results
According to the questionnaires were answered by students for 654 samples, it consists of gender, level education, income, type of transportation, cost of fuel for transportation, time.
travelling from starting point – destination, and
satisfaction to change mode of transportation to cycling. The data was interpreted and present through the figure and table following below.
3.1. Sample Profile
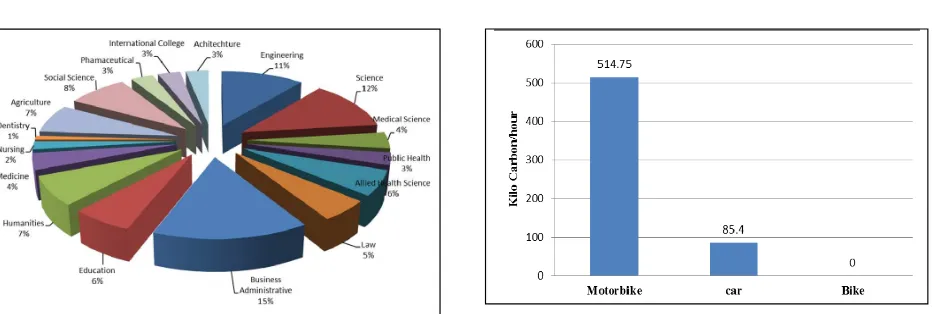
Figure 5: Proportion of questionnaires
In addition, the proportion of transportation usage found that students ride the motorbike the most for 89 per cent, while, driving, cycling, and electricity bus service for 5,4, and 2 per cent respectively. This data can interpret that the source of motorbike is the most popular using inside the campus.
3.2. Carbon Dioxide Estimation
The total CO2 emission as a result of
transportation usage inside the Naresuan University campus in this study is about 600.15 kilo carbon/hour. Motorbike sub-sector is a majority of emission contributor accounted for 514.75 kilo carbon/hour. The car sub-sector held in the second place for 85.4 kilo carbon/hour and cycling is r zero emission contributor. This data can conclude that motorbike is the highest caused of pollution into the atmosphere as the result presented in figure6
In addition, the total CO2 emission share in
averaged by percentage has found that the majority of emission releasing is Motorbike sub-sector for almost one hundred per cent about 86 per cent. The next average share are car and bike about 14, and 0 per cent respectively as it is shown in figure 7 below.
These data can conclude that the fuel burning that caused the Greenhouse Gasses release to the atmosphere is come from the motorbike the most
where its released the source of CO2 emission.
Figure 6: Result of Carbon Dioxide emission
Figure 7: Transportation Usage Break Down in percentage
3.3. Number of Student Travel per day
The total of average number of student travel per day is 34,942 rounds. The highest vehicles used belonging to motorbike for 30,205 round and it followed with cycling, car, and electricity bus service for 1,974, 1,450, and 1,320 round/day respectively as it is shown in figure 8.
Moreover, the result of number of student travel per day break down in percentage show that students have more frequently been traveled the most by motorbike for 86 per cent. The next transportation types was traveled by cycling, car, and electricity bus service about 6, 4, and 4 per cent respectively.
When student have to attend the class, extra
curriculum activities, and other purposes, student’s
than the other car and motorbike. The average use of these service are higher than motorbike and car usage.
Figure 8:Average of number travelling per day
Figure 9: Proportion of number travelling per day
3.4. Cost of Fuel Consumption on Student travel
Because using the electricity bus service, and cycling released zero emission and no cost of travelling, this result will be presented the cost of student travelling due to fuel consumption used on the car and motorbike. The comparing of cost travelling due to fuel consumption has found that cost of consumption used of car is higher than the motorbike. The unexpected number found that the students year 1 spend money on car and motorbike usage the most and the student from year 3, and 2 are behind. The highest cost of consumption used in year 1 by using car and motorbike are about 558.05, and 153.48 Bath per month respectively. Following with the student year 3 are around 434.79 and 152.81 Baht per month. The students from year 2 spend about 440.44, and 150.32 Baht per month. The total average on cost of fuel used by car and motorbike are about 463.52 and 152.20 Baht per month. The data is presented in figure 10.
This result can conclude that the cost of fuel consumption per month does not impact on the student much as they can effort. Thus, this is the one reason why students prefer to ride motorbike to school still rather than switched to other mode of vehicle.
Figure 10: Cost of travelling per month
3.5. Factors to satisfy student in changing mode
of transport to Cycling
According to the datas were collected by questionnaires, results had already computed on the measurement of satisfactory average score. The definition of score point is presented in table 1.
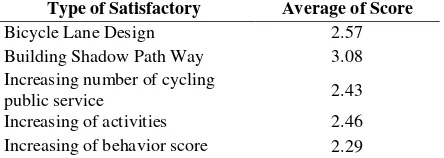
Table 2 presents the result of factors to satisfy student in changing mode of transport to cycling. Studens mostly satisfy of changing mode of transport if the university build the shadow path way. The followed satisfaction is university need to build the bicycle lane for cycling, as well as increase the activities, increasing number of cycling public service, and increasing of behavior score respectively.
Table 1: Definition of average score
Definition Average of Score
Very good 2.57
Good 3.08
Fair 2.43
Less 2.46
Poor t 2.29
Table 2: Average of factors reinforce to cycling usage
Type of Satisfactory Average of Score
Bicycle Lane Design 2.57
Building Shadow Path Way 3.08
Increasing number of cycling
public service 2.43
Increasing of activities 2.46
4. Discussion, Recommendation, dan Conclusion
According to the questionnaires sample were computed for 654, the most first three students answer the questionnaire belong to faculty of Agricultural, Science and Engineering. Motorbike is the highest popular vehicle usage inside campus where the total average number of student travel per day is 34,942 rounds. The motorcycles were ridden by students in the purpose of study, activities, and contact with administration around 30,205 per day round. The next vehicle usage are cycling, car, and electricity bus service about 1,974, 1,450, and 1,320 per day round respectively.
When students travel life cycle by using both
This travel life cycle by using both own vehicle and public electricity bus services, the Carbon Dioxide emission can only released due to motorbike and car only. The source of emission released in order to the fuel used burning by the
vehicles. The total CO2 emission as a result of
transportation usage inside the Naresuan University campus in this study is about 600.15 kilo carbon/hour where the motorbike sub-sector is a majority of emission contributor accounted for 514.75 kilo carbon/hour. The car released for 85.4 kilo carbon/hour, in contrast cycling release zero emission.
The factors can encourage students changing mode of transportation from their own vehicle into cycling is the university needed to build shadow path on the street and walk side. As well as, design the bicycle lane is the second placed to bring the student satisfy of changing mode of transportation and followed with increasing of activities, increasing number of cycling public service, and
increasing of behavior score respectively.
In term of the result of Naresuan University
campus has already ranked in 4th out of 22
universities of Thailand in the context of friendly to the environment. It was ranked by the Green Metric
World University Ranking of Indonesia. The contradiction between the results of transportation sector as it is one of criteria on the UI Green Metric Evaluation ranking. The result of transportation sector is 5.18 per cent and it was the second percentage out of 6 criteria. Although the result held in the second place, the total of Carbon Dioxide emission released for 600.15 kilo
carbon/hour. The number of CO2 emission releasing
is still quite high and the emission shall be reduced by green vehicle policy. Moreover, increasing the number cycling and electricity bus service shall be considered.
On the other hand, the green vehicle policy is needed the framework plan in order to be sustain in such a long term development.
Recommendation for Further Study
To develop the Green University Campus for qualitative, improvement but not acctually focusing
on quantitative growth (United Nations
Environment Programme).
To maintain the cultural diversity and cultural as a central to adaptive process of realizing sustainability especially in the adoptive the green vehicle policy with students, faculties, and staffs.
Implementation plan and framework is needed to be done before start. The Green Vehicle policy can potential adopt to use with the students from year 1 because of proportion of motorbike usage had shown the most.
The other option to mitigate the emission is to increasing number of electricity bus service and bicycle to meet with the students usage demand.
According to this study, the results can conclude as it following below;
a. The most popular vehicle used is motorbike
because it more convenient and faster. The reason why students prefer to use the motorbike can also realted with the result of cost of fuel consumption use is not
expensive as compare with car’s fuel
b. The average number travel per day relate to the students from year 1 that they have more courses work to attend than the others.
c. Students may decide to change the mode of
transportation to cycling. This result can conclude that the weather is too hot and they prefer the shadow path either from tree or bicycle lane with roof if possible.
References
ADEME (2009). Bilan Carbone ®: Companies
Local Authorities-Regions, Methodology
Guide, Version 6, objectives and accounting
principles, the French Agency for
Environment and Energy Management
(ADEME), France.
Analysis, Travel Demand. “บทที 3 การวิเคราะห์
ความต ้ องการเดินทาง (Travel Demand
Analysis).” 77–121. Print.
Broaddus, Andrea. “eScholarship Provides Open
Access, Scholarly Publishing Services to the University of California and Delivers a Dynamic Research Platform to Scholars
Worldwide.” Berkeley Planning Journal 26.1
(2013): 217–220. Web.
Buttazzoni, Marco, and Kathryn Zyla. “Lessons
Learned from Yale University Inventory :
GHG Emissions from Transportation.” n. pag.
Print.
Ilyama, M. Kariuki, P., Kristjanson, P., Kaitibie, S.,
Maitima, J. “Transport and Its Infrastructure.”
Journal of International Development 20
(2008): 380–397. Web.
Pleerux, Narong. “Mapping of Carbon Dioxide Emission from Human Activities : A Case
Study of Saensuk Municipality , Mueng
District , Chon Buri Province.” 17.6 (2012):
895–910. Print.
Sonetti, Giulia, Patrizia Lombardi, and Lorenzo
Chelleri. “True Green and Sustainable University Campuses? Toward a Clusters
Approach.” Sustainability (Switzerland) 8.1
(2016): 1–23. Web.
Thailand Greenhouse Gas Management
Organization (Public Organization). Emission Factor.
United Nations Environment Programme. Greening