Determining the Characteristics
of Trips Generated on Southern Bali
using Category Analysis
I Wayan Suweda1, Achmad Wicaksono2, and Indrasurya Budisatria Mochtar3
AbstractSouthern Bali, a tourism center of Indonesia, has been rapidly developed. Unfortunately, the development is not followed simultaneously by the development of adequate transportation network, as a result, traffic congestion are inevitably occurred along every urban road in the district. Therefore integrated development and regional transport planning therefore, is urgently required. In this study, trip generation is determined using Category Analysis. It is Figured out from the household based interview that Denpasar Barat zones are found to have the largest trip generation while Pecatu zones are found to be the smallest. Most of the household trips generated use private vehicles (94.95%) and the rest uses public transport. This also indicates that public transport services in Southern Bali still need to be developed.
Keywordscategory analysis, household-based, trip generation
AbstrakPembangunan Bali Selatan sebagai pusat pariwisata Indonesia berjalan cepat. Namun, ini tidak diimbangi pengembangan jaringan transportasi yang memadai, sehingga sering terjadi kemacetan hampir pada semua jaringan jalan perkotaan. Kebutuhan merencanakan “Pembangunan dan Transportasi Wilayah” secara terintegrasi sudah sangat mendesak. Dalam penelitian ini, tahapan penentuan bangkitan perjalanan mengaplikasikan metode Analisis Kategori. Berdasarkan hasil wawancara berbasis rumah tangga, diketahui zona Denpasar Barat memiliki bangkitan perjalanan terbesar, sementara yang terkecil zona Pecatu. Hampir semua bangkitan perjalanan rumah tangga menggunakan kendaraan pribadi (94,95%) dan sisanya transportasi umum. Hal ini juga menunjukkkan bahwa peningkatan pelayanan Angkutan Publik masih berpeluang besar untuk dikembangkan di Bali Selatan.
Kata Kuncianalisis kategori, berbasis rumah tangga, bangkitan perjalanan
I.INTRODUCTION8
evelopments of urban areas and the centers of activity per se cause various forms of land conversion of natural lands into built areas that may be vertically, horizontally or a combination thereof. The development is closely associated with geographic boundaries, the trend of community economic development and also local government policies. The increased intensity of built-areas inevitably increases the trip production and attraction from/to the region. Transportation analysis on built areas is very important, because its trip generation causes various forms of congestions, which are becoming more frequent.
On the other hand, several influential transport factors also need to be considered, such as road-class and its quality, existing traffic conditions, side frictions due to the development of road frontage areas, the level of accessibility and the applied transportation system. It could be argued that both “land-use and transport systems” must support each other in an integrated development planning.
Similarly, in Southern of Bali, the need to plan integrated system "Regional Land-use Development and Transport network" is very urgent. This is because of the existence of Southern Bali as a center of tourism
I Wayan Suweda is with Departement of Civil Engineering, FT, Universitas Udayana, Badung, Bali, Indonesia, 80364, E-mail: [email protected].
Achmad Wicaksonois with Department of Civil Engineering, FT, 65145, University of Brawijaya, Malang, Indonesia. E-mail: [email protected].
Indrasurya Budisatria Mochtar is with Departement of Civil Engineering, ITS, Surabaya, 60111, Indonesia. E-mail: [email protected].
activities in Indonesia, as well as the frequent occurrence of congestion in nearly all urban road network. In various studies on the interaction of Land Uses (LU) and Transportation (Network) systems, "Model 4 stages transport planning" is often applied to solving traffic problems, because of its simplicity and ability to describe the various interactions between the characteristics of transport and spatial development in the study area [1]. In four- stages urban model, trip generation is the first stage followed by trip distribution, modal split and traffic assignment. In this study, it will be investigated merely trip generation using Category Analysis. This household-based model is easily applied, especially for wide areas, without interruption of weather problems. In addition, this model uses only descriptive statistic calculations.
The position of trip generation model within the classical four- stages models and their influential factors is shown in Figure 1. Trip generation is a key stage in “the classical 4 stages of transportation planning” and its purpose is to estimate the number of trips generated from a land-use activity zone. Trip generation seeks to define the numbers of trips which start (origin) at one zone and finish (destination) at another [2]. This estimation answers the question of how many trips are likely to be made from each zone to every other zone.
Factors that affect zonal trip generation could be: (a) personal trip production, based on per-capita income, car ownership, household structure, family size, value of land, residential density and accessibility; or (b) personal trip attraction, based on roofed space of industrial, commercial and other services [3]. On the other hand, in disaggregated planning studies, the
analysis of trip generation focuses on the behavior of individual units instead of collective zones.
In specific cases, other factors also affect zonal generated trips in relating to price which is called conditions of demand. These will determine the demand for a product at any given price i.e. the price of other goods and services, taste and fashion, the distribution of income and population [4]. Moreover, in industrial areas, the freight generated trips are still significant, especially in terms of their contribution to congestion. Its amount of 20% of all journeys depends on the important industrial variables including numbers of employees, total amount of sales, roofed area of the firm and total floor space [3]. In terms of trip generation, if factors of socio-economic communities can be predicted, then the trips generated can also be predicted for certain transportation system conditions [5]. Based on an experience, it is also found that travel-based models were easier to be estimated on the household-based, both with multivariable regression and analysis of category, with variables such as income, household size, number of employees, ownership of vehicles, distance to the center city and social status [6]. Briefly, the analysis of category maybe based on the merely cross-classification of income, vehicle ownership and household structure [7].
Based on the previous experience, it is suggested that the questionnaire method is the most appropriate method to obtain the trip generation over a wide area. This is caused by a relatively small error, representative and not affected by weather [8]. Similarly, studies show that the passages of the households in developing countries show a great interest to share travel among household members, so that household-based data become very important [10]. Household based model has also been considered as a standard practice to reduce the statistical problems.
With respect to theory of planning, some techniques for Evaluating trip generation can be divided into 3 (three) broad classes according to their modeling concepts [9]. These are:
(1) Simplified techniques,
(2) The Urban Transportation Modeling System (UTMS), and
(3) Individual choice models.
Theory of Category Analysis is one of the Urban Transportation Modeling System (UTMS) used to predict the number of trips generated for different trip-purposes within a zone. In summary in the category analysis, the model can be described as follows:
Zonal Trip Generation (TG) = function of (trip
generation variables) (1)
On the other hand, Model Category Analysis has three main drawbacks, as indicated [8], namely:
(a) the model is less flexible with change in household structure;
(b) it is difficult to get the best category and there is no test to the quality of the results obtained; and (c) the data required is relatively large.
Thus, this method cannot explain the results obtained. For prediction, this model also requires input data on a regular basis and extrapolation variables may be done with different consideration on the categorization of the household.
II.METHOD
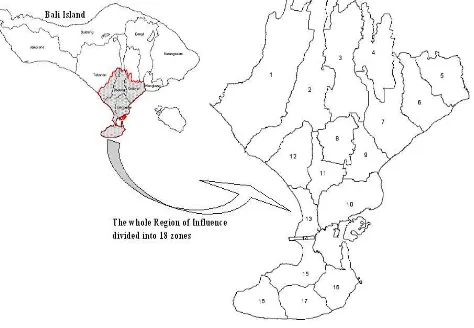
In this study, the characteristics of population trip generation in Southern Bali were investigated using the household-based survey. Study area was divided into 18 zones that are separated by administrative boundaries, as shown in Figure 2.
With regard to the Household interview performed, the Household is defined as a person or a group of person, including servants and visitors who live together and become one unit kitchen (catering). The purpose of Household-based surveys is solely to get the data characteristics of the family including daily trip generation. Subsequently, this questionnaire is used to obtain zonal trip generation for the existing development scenario in 2010 for the whole regional areas in Southern Bali.
Based on the research objectives, two categories of data should be collected in this interview include: a. Household characteristics, including: the number of
members in family (family size), the number of vehicle ownership (car ownership) and expenditures as a representative of the family income, and
b. Information about a journey undertaken (the trips have been made) by the average family per day, trip-purposes and trip origin-destination.
The advantages of Household interview are the percentage of the sample household, the total number of household trips on each zone and all modes performed could be predicted. On the other hand, the trip origin-destinations in the zone or within the sub-region or outside the study area could also be known by certainty.
In order to apply the formula of zonal trip generation, the number of households in each trip category is
required and also the level of “Trip Rate” on each
classification variable that was applied in the Category Analysis. Figure 3 describes three variables used, such as family size, family income and vehicle ownership, which in turn each variable can be divided into three classes so that the overall household can be classified into 27 categories of households.
Formula of Zonal Trip Generation (TG) = f (trip generation variables: family size, vehicle ownership and family income) could be replaced with the following
III.RESULTS AND DISCUSSIONS
people/km2 for the built-up areas of 214.14 km2. Gross household] in 2004 to 4.10 in 2008. This number varies between the lowest 3.42 [person/household] in Pecatu zone and the highest 4.91 [person/household] in Sukawati zone.
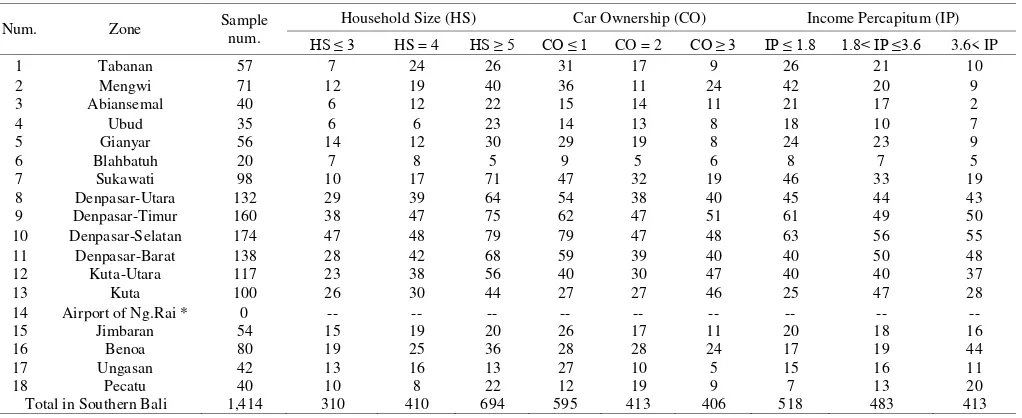
The results of household interview showed the number of members in household, vehicle ownership, income for each household and the characteristics of trips taken. Households are classified into several categories using a trial and error method. This is based on the existing household characteristics and Category Analysis requirements. The requirements stated that the number of Households in each category should be relatively balanced. If so,
- Household Size (HS) or Number of Family Members in the household is classified into three classes consisting household members less than 4 people, equal to 4 people and more than 4 people.
- Car Ownership (CO) is classified into three classes, consisting households with and without one vehicle, with two vehicles and with more than two motor vehicles. - Revenue/income per capita per year (IP) is also divided into three classes consisting household income less than Rp. 1.8 million, between Rp. 1.8 million to Rp. 3.6 million and above Rp. 3.6 million.
Based on the number of population in the study area, the number of households sample in accordance with the requirement of minimum sample [11], should be 1% or 3.752 samples. But in the implementation of the survey, the total samples collected were 1,414 household-based samples. So, by using the formula of [12] such as that given in the Traffic Appraisal Manual (TAM):
n = P P N
Several important points may be explained by using the tendency of household characteristics observed in 2010. The size of the average household in the Southern Bali is 49.1% consisting of 4 persons or more. One third (29.0%) of the total households has exactly four members, which is the family-size recommended by the government of Indonesia, while the rest (21.9%) of households consist of 3 persons or less.
Another aspect obtained was the use of public transport that is not so popular, especially when compared with another personal mode (the ownership of vehicles per household). 42.1% of households have less than two
motor-vehicles. Furthermore, 29.2% of the households have two vehicles and the remaining (28.7%) of total households owned 3 or more motor vehicles. From these data, it can be said that almost 60% of the households have two or more motor vehicles.
In terms of revenue, 36.6% of the households has an income per capita per year less than Rp.1.8 million. The relatively same percentage (34.2%) of households has an annual per capita income ranges between Rp. 1.8 million to Rp. 3.6 million and the remainder (29.2%) of the households receives more than Rp. 3.6 million per capita per year.
Other point is that 11.4% of the total households still live under the poverty line according to the recommended standard of the World Bank, which is set at Rp.1.0 million per capita per year. In addition, the data obtained also illustrate that the households in Denpasar and Kuta have not shown a higher income compared with the other zones, although there is much more concentrated infrastructure development in Denpasar and Kuta.
Considering that method, each household classification represents all variable-characteristics that are used to describe the number of trips generated by households in the zone. Furthermore, using Equation 2, the characteristic of total trips generated for each zone can be determined as shown in Table 2.
Based on the results above, the zone of Denpasar Barat has the largest zonal trip generation i.e. 233.395 person-trips/day while the smallest is in the zone of Pecatu 2.418 person-trips/day. Several important points that should be highlighted in the daily commute of households is that the domestic industry zones (Mengwi and Sukawati) which have a relatively small trips, because most of their inhabitants usually work in their own zones/houses. Meanwhile, the zones producing daily commuters to and from Denpasar (e.g.: Abiansemal and Tabanan zones) have higher trips generated. However, a great journey is generally performed by residents who live in urban areas (Denpasar and Kuta), where the accessibility and various kinds of entertainment are more easily obtained. Pecatu zone, which is the most natural and undeveloped zone compared to the other zones, has a quite high daily commuter. The reason is probably due to people who have to move from their zone to fulfill and satisfy their daily needs.
Data of trip-modes resulting from the interview showed that the composition of individual modes is very high and nearly 50% of trips uses mode of motorcycles. The detail calculation of the overall composition of trip modes in the region of Southern Bali was shown in Table 3.
of the best alternatives to divert 'drastic increase' of the volume of private vehicles. This policy could solve some problems in traffic congestion and could improve the efficiency of the transportation system.
These data composition of Trip-Modes in the study areas however, did not necessarily reflect the modal-split on a particular road segment in the Southern Bali. This is because the distribution of modes of travel on a specific road segment accumulated from many trip-modes factors, such as level of service of public transport, private vehicle ownership, trip-distance and the road-geographical position relative to the origin-destination of journey in Southern Bali.
In the meantime, the high proportion of private vehicle ownerships reflected the low level of public transport services, for example, high fare, inaccessible, and unreliable (in terms of time and schedule). In addition, a motorcycle is very easy to own for middle and low income people due to the low credit requirements. Consequently, motorcycle ownerships are very high in Southern Bali.
IV.CONCLUSION
Denpasar Barat and Pecatu zones have the largest and the lowest zonal generated trips respectively. In addition, the famous domestic industry zones, i.e. Mengwi and Sukawati have the lowest level of trips compared to other zones. This indicates that the generated trips in this zone are relatively lower compared to those zones of major tourist destinations, i.e, Ubud, Gianyar and Benoa. Pecatu zone however, which is the most barren areas, natural and undeveloped has an individual high daily trip rate. This is because people in that region are not able to fulfill their lives in their own zone and have to work in other zones. In contrast, zones with daily commuting workers to and from Denpasar (such as Abiansemal and Tabanan zones) produce the highest level of travel.
Meanwhile, public transport has a very small role in the community. Bali local government should give more attention to promote and develop the public transport systems and put a higher priority to cope with traffic congestion to enhance transportation efficiency.
Figure 1. The position of trip generation in the modeling of “Four-Phase Transport Planning” and its influential factors
Figure 3. Category “i” in 27 categories of household
TABLE 1.
CATEGORIZATION AND DISTRIBUTION OF HOUSEHOLD-SAMPLE IN 18ZONES OF SOUTHERN BALI
Num. Zone Sample
num.
Household Size (HS) Car Ownership (CO) Income Percapitum (IP)
HS ≤ 3 HS = 4 HS ≥ 5 CO ≤ 1 CO = 2 CO ≥ 3 IP ≤ 1.8 1.8< IP ≤3.6 3.6< IP
1 Tabanan 57 7 24 26 31 17 9 26 21 10
2 Mengwi 71 12 19 40 36 11 24 42 20 9
3 Abiansemal 40 6 12 22 15 14 11 21 17 2
4 Ubud 35 6 6 23 14 13 8 18 10 7
5 Gianyar 56 14 12 30 29 19 8 24 23 9
6 Blahbatuh 20 7 8 5 9 5 6 8 7 5
7 Sukawati 98 10 17 71 47 32 19 46 33 19
8 Denpasar-Utara 132 29 39 64 54 38 40 45 44 43
9 Denpasar-Timur 160 38 47 75 62 47 51 61 49 50
10 Denpasar-Selatan 174 47 48 79 79 47 48 63 56 55
11 Denpasar-Barat 138 28 42 68 59 39 40 40 50 48
12 Kuta-Utara 117 23 38 56 40 30 47 40 40 37
13 Kuta 100 26 30 44 27 27 46 25 47 28
14 Airport of Ng.Rai * 0 -- -- -- -- -- -- -- -- --
15 Jimbaran 54 15 19 20 26 17 11 20 18 16
16 Benoa 80 19 25 36 28 28 24 17 19 44
17 Ungasan 42 13 16 13 27 10 5 15 16 11
18 Pecatu 40 10 8 22 12 19 9 7 13 20
TABLE 2.
THE CHARACTERISTICS OF TRIPS GENERATED IN SOUTHERN BALI
Num. Zone
Characteristics of Trips Generated in 2010
Population No. of Min Sample Sample Trips Generated (Person-trips/day)
(People) Household (Black,1981) Collected Sample Zone Trips/person
1 Tabanan 148,783 38,973 390 57 191.072 130,641 0.88
2 Mengwi 110,903 25,763 258 71 55.018 19,964 0.18
3 Abiansemal 83,139 23,023 230 40 298.660 171,898 2.07
4 Ubud 63,578 16,174 162 35 116.324 53,755 0.85
5 Gianyar 47,242 11,954 120 56 96.499 20,599 0.44
6 Blahbatuh 56,059 12,537 125 20 57.729 36,187 0.65
7 Sukawati 94,246 19,182 192 98 68.995 13,505 0.14
8 Denpasar-Utara 159,558 39,658 397 132 585.539 175,920 1.10 9 Denpasar-Timur 137,530 36,924 369 160 719.844 166,123 1.21 10 Denpasar-Selatan 194,355 53,774 538 174 575.664 177,906 0.92 11 Denpasar-Barat 194,061 53,266 533 138 604.671 233,395 1.20 12 Kuta-Utara 61,440 15,275 153 117 507.678 66,281 1.08
13 Kuta 35,686 8,542 85 100 429.832 36,714 1.03
14 Airport of Ng.Rai * -- -- - - -
15 Jimbaran 30,774 7,854 79 54 170.756 24,836 0.81
16 Benoa 27,390 6,746 67 80 172.082 14,510 0.53
17 Ungasan 14,870 3,421 34 42 31.472 2,563 0.17
18 Pecatu 7,194 2,102 21 40 46.019 2,418 0.34
Total In Southern Bali 1,466,807 375,167 3,752 1,414 4,727.854 1,347,216 0.80
TABLE 3.
DISTRIBUTION OF TRIP-MODES IN SOUTHERN BALI
No Zone
Trip Generation
Pedestrian Bicycle Motor cycle
Private
Car Pick-up Truck
Public Transport Total
(Psn-trips/day) Taxi Minibus Bus (%)
1 Tabanan 130,641 18.063 1.047 53.665 11.780 1.313 1.109 0.000 2.356 10.733 100 2 Mengwi 19,964 36.826 9.206 38.730 8.572 0.000 0.000 0.000 1.587 5.079 100 3 Abiansemal 171,898 28.045 9.915 45.326 3.399 3.788 3.200 0.000 5.666 0.850 100 4 Ubud 53,755 49.630 2.963 33.704 10.740 0.000 0.000 0.741 0.741 1.481 100 5 Gianyar 20,599 31.292 6.803 48.299 8.844 0.948 0.801 0.000 0.340 2.721 100 6 Blahbatuh 36,187 27.679 21.428 27.679 7.143 2.985 2.521 0.000 0.000 10.714 100 7 Sukawati 13,505 12.959 9.287 58.315 13.823 1.444 1.220 0.432 2.592 0.000 100 8 Dps-Utara 175,920 19.990 2.522 50.087 21.431 0.627 0.530 0.470 1.259 3.115 100 9 Dps-Timur 166,123 21.145 2.831 46.868 24.337 0.504 0.425 0.361 1.265 2.289 100 10 Dps-Selatan 177,906 18.502 7.401 49.312 17.728 0.240 0.202 0.861 1.291 4.475 100 11 Dps-Barat 233,395 18.997 2.257 52.853 18.934 0.734 0.620 0.564 1.254 3.824 100 12 Kuta-Utara 66,281 19.499 2.832 57.189 15.033 0.971 0.820 0.436 2.397 0.871 100 13 Kuta 36,714 24.462 4.436 54.704 15.726 0.150 0.127 0.403 0.000 0.000 100
14 Airport *) -- -- -- -- -- -- -- -- -- -- --
15 Jimbaran 24,836 20.249 19.938 43.302 12.773 0.000 0.000 0.000 3.115 0.623 100 16 Benoa 14,510 19.740 1.735 47.506 26.247 1.208 1.021 0.868 1.735 0.000 100 17 Ungasan 2,563 15.923 0.000 63.694 11.465 0.710 0.600 2.548 5.096 0.000 100
18 Pecatu 2,418 21.212 2.597 58.009 9.957 4.100 3.464 0.000 0.866 0.000 100
Total in South of
REFERENCES
[1] N. Oppenheim, Urban Travel Demand Modeling: From individual choices to general equilibrium, A Wiley-Interscience Publication John Wiley and Sons, inc., Toronto, 1995.
[2] M. A. P. Taylor, W. Young, and P. W. Bonsall, Understanding Traffic System: Data, analysis and presentation, Second Edition, Athenaeum Press Ltd., Gateshead, Tyne and Wear, England, 2000. [3] J. de D. Ortuzar dan L. G. Willumsen, Modeling Transport,
Second edition, John Wiley and Sons Ltd., Chichester, 1994. [4] G. J.Bell, D.A. Blackledgeband, and P.J. Bowen, The Economics
and Planning of Transport, Heinemenn, London, 1983.
[5] R. J. Salter, Highway Traffic Analysis and Design, Second edition, Macmillan Education Ltd., London, 1976.
[6] Government of Bali Province, Rencana Tata Ruang Wilayah Provinsi Bali tahun 2009-2029, Peraturan Daerah Provinsi Bali Nomor 16 Tahun 2009, Denpasar, Bali, 2009.
[7] K. J. Button, Transport Economics, Heinemenn, London, 1982. [8] A. Daly, “Improved Methods for Trip Generation,” in Transport
planning methods vol. II, in Proceeding of seminar F, Brunell University, England, 1997.
[9] TRRL/Transport and Road Research Laboratory, Research on Road Traffic, Her Majesty’s Stationery Office (HMSO), London, 1965.
[10] Dissanayake, Dilum, and T. Morikawa, “A Combined RP/SP Nested Logit Model of Vehicle Ownership, Mode Choice and Trip Chaining to Investigate Household Travel Behavior in Developing Countries,”TRB 2003 Annual Meeting CD-ROM, Nagoya, 2003. [11] M. D. Meyer and E. J. Miller, Urban Transport Planning,
McGraw-Hill Book Company, New York, 1984.