KINERJA KEUANGAN
DISERTASI
Oleh:
N U R O F I K 01/1037/PS Ilmu Akuntansi
PROGRAM DOKTOR ILMU AKUNTANSI FAKULTAS EKONOMIKA DAN BISNIS
UNIVERSITAS GADJAH MADA YOGYAKARTA
KINERJA KEUANGAN
Disertasi untuk memperoleh derajad Doktor dalam Ilmu Akuntansi
pada Fakultas Ekonomika dan Bisnis Universitas Gadjah Mada
Dipertahankan di hadapan
Dewan Penguji Program Doktor Ilmu Akuntansi Fakultas Ekonomika dan Bisnis,
Universitas Gadjah Mada, pada tanggal: _____________
Oleh: N U R O F I K
Lahir di:
SUMMARY
1. Introduction
One of the contemporary issues in the business world is the issue of corporate social
responsibility (CSR). One way to find out the practice of CSR is through reporting or
disclosure of the CSR (Abbott and Monsen, 1979; Weldman, 2002).
Diversity in CSR disclosure has raised numerous questions, such as: 'Is the CSR disclosure the company’s reactive or proactive activity?' And 'Does the CSR
disclosure serve the company's interests or social interests?'. From the reactive
standpoint, CSR disclosure is expected to occur when the company suffers from
threats of legitimacy (Deegan and Rankin, 1996; 1997; Deegan et al., 2002). On the
other hand, from the proactive standpoint, CSR disclosure is expected to occur when
managers attempt to minimize the profits reported to reduce political actions that are
not beneficial for the firm (Belkaoui and Karpik, 1989).
Although many researches on the determinants of CSR disclosure had been
done, most of those studies were focused on public pressure in general (legitimacy
theory), the pressure force of certain stakeholder groups (stakeholder theory), and
political pressures (political cost theory in the positive accounting theory) as the
determinants of CSR disclosure. There are still very few studies that look at the CSR
disclosure from the psychological/manager behavioral aspect (Weldman, 2002).
CSR disclosure practices in Indonesia still vary among companies. It is
related to the voluntary nature of CSR disclosure. The voluntary nature of CSR
disclosure allows the manager to have different motivations in disclosing the CSR
thus causing differences in CSR disclosure practices. Therefore, managers’
the socio-economic perspective (Mangos and Lewis, 1995), managers’ behavior and
goals are not only influenced by certain institutions, investors, creditors or other
parties that make formal contracts with the company, but is also influenced by
noneconomic factors such as the managers’ personal relationships.
Verrecchia’s disclosure theory (1983) states that the company (managers)
would only disclose information to the public (market) if the benefits of voluntary
disclosure outweigh the proprietary cost of disclosure. In other words, in a voluntary
disclosure, the company (managers) only discloses information to the public if the
action is considered beneficial in the future. One of which is the economical benefit
for the company.
This study was aimed at achieving two objectives. First, to examine the
behavioral factors of managers that influenced CSR disclosure. Behavioral theory
basis used in this study was the Theory of Planned Behavior. Second, to examine the
relationship of CSR disclosure with corporate financial performance. Theoretical
basis used to achieve the second objective was the Stakeholder Theory.
2. Theory and Hypothesis Development Theory of Planned Behavior
Theory of Planned Behavior was developed by Ajzen (1985; 1991) and is an
extension of the Theory of Reasoned Action developed by Fishbein and Ajzen
(1975). The Theory of Reasoned Action assumes that people choose a set of actions
(behaviors) rationally/consciously by using available information and implicitly or
explicitly consider the implications of their actions.
The Theory of Reasoned Action postulate is one’s intention to perform or not
1985). A behavior is believed to be the result of behavioral intention. Behavioral
intention is defined as the subjective probability of an individual in determining the
choice made out of various alternative behaviors. The general rule of the Theory of Reasoned Action is the stronger an individual’s intention to perform a behavior is,
the greater the likelihood of such behavior’s exhibition is. Behavioral intention is a
function of two basic determinants, namely personal factors called the attitude
towards the behavior and the influence of social pressure called the subjective norms.
Attitude towards the behavior is a construct that combines individual beliefs about
the likelihood of certain outcomes of the behavior and thorough evaluation of these outcomes. Subjective norms show the individual’s beliefs of the social pressure to
perform or not to perform the behavior. Subjective norms are a construct that
combines individual’s confidence in certain referent behavior drives and the level of
compliance with these referents (Hanno and Violette, 1996).
The Theory of Planned Behavior is an extension of the Theory of Reasoned
Action. The expansion is necessary, given the limitations of the Theory of Reasoned
Action in facing the behaviors in the situation in which people do not have a
complete volitional control (Ajzen, 1991). One constructs added in the Theory of
Planned Behavior is perceived behavioral control. Perceived behavioral control is
defined as one's beliefs in the level of difficulty or ease in performing the behavior
(Ajzen, 1991). Thus, this construct is related to resources and opportunities are
believed to be owned by individuals (Ajzen, 1991). It means that the more resources
considered to be possessed by individuals, and the fewer obstacles or barriers that
The central factor of the Theory of Planned Behavior is the individual’s
intention to perform a behavior. Although the intention is expected to capture the
motivational factors that influence the behavior, a behavioral intention can find its
expression in the behavior only if the behavior is under complete volitional control,
i.e. if one can independently decide to do or not to do the behavior. On the other
hand, if a behavior is under incomplete volitional control, then the intention is not
sufficient to explain the behavior. Briefly, a behavioral intention, along with a
perceived behavioral control can be used directly to predict one’s behavior.
Stakeholder Theory
According to this theory the existence of a company requires supports from
stakeholders and all stakeholders are essential to the success of the company (Freeman and McVea, 2001). Therefore, using Jensen and Meckling’s term (1976),
the company can be viewed as a "nexus of contracts" between the company
(managers) and its stakeholders (Jones, 1995).
According to the Stakeholder Theory, the CSR disclosure is seen as a
dialogue between the company and its corporate stakeholders (Gray et al., 1995b).
The central thesis of the theory is that the corporate disclosure is a means for a
management to administer the information needs of various powerful stakeholder
groups. Managers use information to administer or manipulate the most powerful
stakeholders in order to gain their support, which is necessary for the continuity of
the company (Gray et al., 1996 in Van-der Laan, 2006).
The instrumental dimensions of the Stakeholder Theory explain that a
company could gain financial benefits from the practice of CSR towards the
arguments to support it. First, the explicit costs of the CSR are minimum and the
company will benefit significantly from the CSR action in the form of employee
morale improvement, which will eventually lead to productivity (Moskowitz, 1972).
Second, the costs of the CSR actions are significant, but will be covered by other
costs’ decline in the company (Cornell and Shapiro, 1987). Third, the CSR action
would improve the company's relationships with important constituencies such as
creditors, investors, and governments that will improve the company's access to the
capital sources (Moussavi and Evans, 1986). Furthermore, according to the
Stakeholder Theory, a company must provide satisfaction not only for the
shareholders, but also for the parties that have less explicit (implicit) claims.
Abandonment of the interests of the parties that have implicit claims will result in the
change of the implicit costs into explicit costs that are more expensive (costly) for
the company. For example, if a company does not pay attention to its negative
impacts on the environment, then the government will issue strict regulations to force
the company to take responsible actions in environmental fields, which can lead to a
more expensive explicit cost for the company.
Hypothesis Development
a. The Influence of Manager’s Attitude, Subjective Norms, and Perceived behavioral control of the CSR Disclosure on The Intention to Disclose CSR
The general rule of the Theory of Planned Behavior is the better or the more
positive one's attitude towards a behavior is, the stronger the social pressure to
perform behavior would be, and the more powerful the perceived behavioral control
is, the stronger one's intention to perform the behavior would be. In the context of the
more positive the manager’s attitude towards the CSR disclosure is, the stronger
his/her intention to disclose the CSR would be. Therefore, this study hypothesized as
follows:
H1: Manager’s attitude towards the CSR disclosure has a positive influence on the intention to disclose the CSR.
The second rule of the Theory of Planned Behavior states that the stronger one’s belief in the social pressure to perform a behavior is, the stronger the intention
to perform the behavior would be. In the context of CSR disclosure, the stronger the social pressure on managers to disclose CSR is, the stronger the managers’ intention
to disclose the CSR would be. Therefore, this study hypothesized as follows.
H2: Managers’ subjective norms of CSR disclosure have a positive influence on the intention to disclose the CSR.
The third rule of the Theory of Planned Behavior states that the more powerful someone’s perceived behavioral control is, the stronger the person's
intention to perform the behavior would be. In the context of CSR disclosure, the stronger a manager’s perceived behavioral control of CSR disclosure is, the stronger
the manager intention to disclose the CSR would be. Therefore, this study
hypothesized as follows.
H3: Managers’ perceived behavioral control of CSR disclosure has a positive influence on the intention to disclose the CSR.
b. The Influence of Managers’ Intention and Perceived Behavioral Control towards the CSR Disclosure on the CSR Disclosure
According to the theory of planned behavior, a behavioral intention, along
with a perceived behavioral control, can be used directly to predict a behavior’s
performance. The general rule of the theory of llanned behavior is the stronger the
control is, the greater the likelihood of the occurance of behavioral performance
would be. Therefore, this study hypothesized as follows.
H4: Managers’ intention to disclose the CSR has a positive influence on CSR disclosure.
H5: Managers’ perceived behavioral control of CSR disclosure has a positive influence on CSR disclosure.
c. Relationship between CSR Disclosure with Corporate Financial Performance
Instrumental dimensions of the stakeholder theory explain that a company
could obtain financial benefits from the practice of CSR towards the company's
stakeholders. According to the stakeholder theory, companies that are considered as
having a high CSR will have lower implicit claims compared with other companies,
therefore these companies will also have a higher financial performance (Cornell and
Shapiro, 1987). In addition, an unethical behavior within a company will decrease the company’s credibility and eventually will lower the company's performance
(Fritzsche, 2005). Since the CSR disclosure is a form of an ethical behavior in
business, therefore this study hypothesized as follows.
H6: CSR disclosure has a positively related to corporate financial performance.
3. Method of Research
Samples and Analysis Unit
This study used a sample of companies listed in the Indonesia Stock Exchange (IDX)
in 2007 and 2008, and engaged in the :(1) Agriculture, (2) Mining, (3) Basic and
Chemical, (4) Miscellaneous; and (5) Consumer Goods industrial sector. Selection of
criterions: (1) the companies are listed in the IDX in 2007 and 2008, (2) the
companies referred to in point (1) have an annual report for 2007 and 2008, and (3)
the annual report referred to in point (2) can be accessed or obtained from various
sources, for example through the IDX website, the website of each company, or a
library (Capital Market Reference Center) at the IDX.
This study used two units of analysis. First, the individual level. This unit of analysis was used to determine the managers’ behavioral factors that influenced CSR
disclosure. Second, the company level. This unit of analysis was used to determine
the influence of CSR disclosure on a company's financial performance.
Data and Method of Collection
The study used two sources of data, namely the secondary and primary data. The
secondary data included: (1) accounting performance, namely return on assets (ROA)
and earnings per share (EPS), (2) market performance (stock price in 2008 and 2007,
as well as dividends), and (3) CSR disclosure. The secondary data were obtained
from the company's annual report. The primary data were in the form of the response of the managers’ beliefs in the CSR disclosure. The primary data were obtained
through a questionnaire survey using three techniques, namely (1) mail survey, (2)
sending questionnaires via the internet by a direct access to
www.csr-nurofik.adkardus.com, and (3) submission of the questionnaire directly to each target
company (door to door).
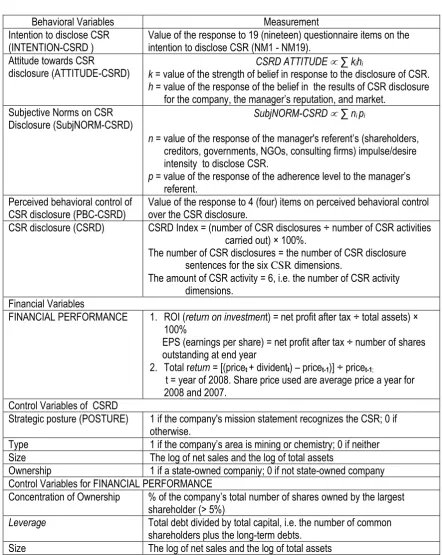
Research Variables and The Measurements
This study used five behavioral variables and one non-behavioral variable. In
influences on the CSR disclosure and financial performance. Table 1 presents the
research variables and measurements.
Table 1
Variables and Measurements
Behavioral Variables Measurement
Intention to disclose CSR (INTENTION-CSRD )
Value of the response to 19 (nineteen) questionnaire items on the intention to disclose CSR (NM1 - NM19).
Attitude towards CSR
disclosure (ATTITUDE-CSRD)
CSRD ATTITUDE ∑ kihi
k = value of the strength of belief in response to the disclosure of CSR. h = value of the response of the belief in the results of CSR disclosure
for the company, the manager’s reputation, and market. Subjective Norms on CSR
Disclosure (SubjNORM-CSRD)
SubjNORM-CSRD ∑ ni pi
n = value of the response of the manager's referent’s (shareholders, creditors, governments, NGOs, consulting firms) impulse/desire intensity to disclose CSR.
p = value of the response of the adherence level to the manager’s referent.
Perceived behavioral control of CSR disclosure (PBC-CSRD)
Value of the response to 4 (four) items on perceived behavioral control over the CSR disclosure.
CSR disclosure (CSRD) CSRD Index = (number of CSR disclosures ÷ number of CSR activities carried out) × 100%.
The number of CSR disclosures = the number of CSR disclosure sentences for the six CSR dimensions.
The amount of CSR activity = 6, i.e. the number of CSR activity dimensions.
Financial Variables
FINANCIAL PERFORMANCE 1. ROI (return on investment) = net profit after tax ÷ total assets) × 100%
EPS (earnings per share) = net profit after tax ÷ number of shares outstanding at end year
2. Total return = [(pricet + dividentt) – pricet-1)] ÷ pricet-1;
t = year of 2008. Share price used are average price a year for 2008 and 2007.
Control Variables of CSRD
Strategic posture (POSTURE) 1 if the company's mission statement recognizes the CSR; 0 if otherwise.
Type 1 if the company’s area is mining or chemistry; 0 if neither Size The log of net sales and the log of total assets
Ownership 1 if a state-owned companiy; 0 if not state-owned company Control Variables for FINANCIAL PERFORMANCE
Concentration of Ownership % of the company’s total number of shares owned by the largest shareholder (> 5%)
Leverage Total debt divided by total capital, i.e. the number of common shareholders plus the long-term debts.
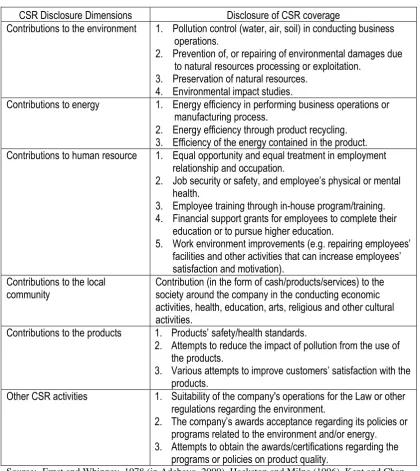
Questionnaire Development
Research questionnaire was constructed in two stages. Firstly was by identifying the
dimensions of CSR and the scope of disclosure. Table 2 presents CSR disclosure
dimensions and the scopes. Secondly, the questionnaire was constructed to find out
the existence of the CSR practice, INTENTION-CSRD, ATTITUDE-CSRD,
SubjNORM-CSRD, and PBC-CSRD.
THE EXISTENCE OF THE CSR PRACTICE. To find out the existence
of the CSR practice, nineteen CSR activities were provided for the respondents, as
shown in Table 2. Subsequently the respondents were asked to answer the question
'Does this company perform the following CSR activity?' The format of the answer
was 'yes' and 'no.' In addition, to reduce biased response, the respondents were asked
to select a range of average expenditure per year to fund the CSR activities
performed.
INTENTION-CSRD. To find out the respondent's INTENTION-CSRD, they were given nineteen items on CSR disclosure as shown in Table 2. Furthermore,
to measure the strength of INTENTION-CSRD, the questionnaire was constructed to
provide the statement 'I intend to disclose the following CSR activity in the annual
report.' The response format ranged from very unlikely to very likely, using a 5-point
Likert scale.
ATTITUDE-CSRD. ATTITUDE-CSRD construct has two dimensions,
namely the strength of beliefs to CSR disclosure and the evaluation of CSR
disclosure results (outcomes). Craighead and Hartwick (1998) present three sets of
executives/managers, and the market. This study used the aforementioned three sets
of benefits to measure the ATTITUDE-CSRD.
Table 2
CSR Disclosure Dimensions and Coverage
CSR Disclosure Dimensions Disclosure of CSR coverage
Contributions to the environment 1. Pollution control (water, air, soil) in conducting business operations.
2. Prevention of, or repairing of environmental damages due to natural resources processing or exploitation.
3. Preservation of natural resources. 4. Environmental impact studies.
Contributions to energy 1. Energy efficiency in performing business operations or manufacturing process.
2. Energy efficiency through product recycling. 3. Efficiency of the energy contained in the product. Contributions to human resource 1. Equal opportunity and equal treatment in employment
relationship and occupation.
2. Job security or safety, and employee’s physical or mental health.
3. Employee training through in-house program/training. 4. Financial support grants for employees to complete their
education or to pursue higher education.
5. Work environment improvements (e.g. repairing employees’ facilities and other activities that can increase employees’ satisfaction and motivation).
Contributions to the local community
Contribution (in the form of cash/products/services) to the society around the company in the conducting economic activities, health, education, arts, religious and other cultural activities.
Contributions to the products 1. Products’ safety/health standards.
2. Attempts to reduce the impact of pollution from the use of the products.
3. Various attempts to improve customers’ satisfaction with the products.
Other CSR activities 1. Suitability of the company's operations for the Law or other regulations regarding the environment.
2. The company’s awards acceptance regarding its policies or programs related to the environment and/or energy. 3. Attempts to obtain the awards/certifications regarding the
programs or policies on product quality.
Source: Ernst and Whinney, 1978 (in Adebayo, 2000), Hackston and Milne (1996), Kent and Chan
(2003) with some adjustments according to the relevance of its application in
To find out the strength of beliefs of the CSR disclosure, the respondents
were given nineteen items on CSR disclosure as shown in Table 2. Furthermore, to
measure the strength of beliefs, the questionnaire was constructed by providing the
following three statements:
Statement # 1 I believe that a disclosure on the annual report of following CSR activity* is ... for the company.
Statement # 2 I believe that a disclosure on the annual report of following CSR activity* is ... for the manager's reputation.
Statement # 3 I believe that a disclosure on the annual report of following CSR activity * is ... to market. "
* nineteen items of CSR disclosure
The format of the answer to each statement ranged from very bad to very good with a
5-point Likert scale.
For the evaluation dimensions of the CSR disclosure results, this study
modified the questionnaire items developed by Craighead and Hartwick (1998).
Modifications were made due to the differences in disclosure objects. The object of
the disclosure of this study is the CSR, while Craighead and Hartwick’s (1998) was
the disclosure of earnings and corporate strategy. The results of modifications
showed eight benefits of CSR disclosure as follow:
For the companies
1. The potential benefits of CSR disclosure in the annual report exceeded the potential costs for the company.
2. CSR disclosure in the annual report generally gives positive impacts to the company, that is the public would assume that the company has been responsible in managing the social and environmental issues.
For the reputation of the executives/managers
1. Reputation of the company’s executives will increase if the company communicates CSR activities to the public through annual reports.
2. Reputation of the company’s executives will improve if the CSR disclosure activity in the annual report is done compared to not disclosing it.
For the market
1. The market impact from bad news will decline if the company continuously announces good news to the public through annual reports.
2. Disclosure of information on the CSR to the public through annual reports will reduce the cost of information acquisition by the investors and stimulate investors’interests in the company’s shares.
3. The cost of raising capital will decline if the company perform an honest CSR disclosure on a regular basis to the public through annual reports because the information will enhance the investors/creditors’ confidence in and better understanding of the company.
Furthermore, to measure the benefits of CSR disclosure, respondents were
asked to make a statement of agreement or disagreement with the eight benefits of CSR disclosure. Respondents’ answers was constructed using a 5-point Likert scale,
from strongly disagree to strongly agree. The higher score reflects the higher benefits
of CSR disclosure.
SubjNORM-CSRD. This construct has two dimensions (Ajzen, 1991), namely the parties (referents) that affect the subject to perform a particular behavior (normative beliefs) and the subject’s level of compliance to the referents. This study
used 5 (five) referent managers, namely (1) shareholders, (2) creditors, (3)
government/politicians, (4) consultants, and (5) non-governmental organizations
(NGOs) engaged in the supervision of the social and environmental activities
conducted by the company.
Based on the aforementioned five referents, in order to measure the strength
of normative beliefs, the questionnaire was constructed by asking the question 'How
big/small is the impulse (desire) of the following parties for the CSR disclosure in
the annual report?' The response was constructed using a 5-point Likert scale from
In order to measure the level of compliance, the questionnaire was
constructed by asking the question 'How big/small is the possibility that you will
comply to the wishes the following parties on the CSR disclose in the annual report?'
The response was constructed using a 5-point Likert scale from very small to very
large. The higher scores reflect higher levels of compliance.
PBC-CSRD. This study adopted a questionnaire developed by Weldman (2002) by replacing the term ‘environment’ with ‘CSR’ to find out the perceived
behavioral control of CSR disclosure. The questionnaire consisted of four statements,
namely (1) I have control over the decision to disclose the CSR in the annual report,
(2) it would be very easy for me to disclose the CSR on the annual report, (3) the
authority given to my position is sufficient to make decisions regarding the CSR
disclosure in the annual report, and (4) I feel confident that the skills, the abilities,
and the quality of knowledge I possess will be helpful in the making of decisions
regarding the CSR disclosure in the annual report. Furthermore, to measure the
PBC-CSRD, the questionnaire was constructed using a 5-point Likert scale from strongly
disagree to strongly agree. The higher scores indicate higher PBC-CSRD.
Efforts to Eliminate (Decrease) Bias
Nonresponse bias. Efforts made to eliminate (reduce) nonresponse bias included (1) questionnaires delivered directly if sending by mail did not work as
expected, (2) providing questionnaires through www.csr-nurofik.adkardus.com, (3)
giving incentives to the respondents in the form of original silver craft from Kota
Gede, Yogyakarta, to express the gratitude toward the respondents, and (4)
the request for the manager to complete the questionnaire. The cover letter also
explained about the importance of the participation of the managers for the
development of science, especially accounting, in Indonesia.
Social desirability bias, leniency bias, extremity bias, and acquiescence bias. Efforts made to reduce the social desirability bias, leniency bias, the extremity bias, and the acquiescence bias included (1) requiring the respondent to answer all
questions as they are, (2) guarantying the confidentiality of respondents' answers,
including the anonymity of respondents, and (3) assuring the respondents that there
were no right or wrong answers so that they were willing to answer questions
truthfully. These efforts were written in the cover letter and at the beginning of the
questionnaire.
Ambiguity bias of item. To eliminate (reduce) ambiguity of item bias, the
efforts made were (1) providing questionnaires with the definition of the CSR to
clarify the meaning of disclosure and the limits (coverage) of each of the CSR area
therefore before answering the questionnaire respondents were expected to
understand the elements (items) of CSR and (2) conducting preliminary testing of the
questionnaire to find out as early as possible the statements in the questionnaire that
were confusing or contained multiple interpretations for the respondents.
Validity and Reliability Testing of the Instruments
Convergent validity. Convergent validity related to the principle that the
measures of a construct should be highly correlated (Hartono and Abdillah, 2009).
Parameters to determine the convergent validity were (1) score of loadings (rule of
(rule of thumb > 0.5 ). Questionnaire items that did not meet these criteria should be
removed and the test was performed only on the items that meet the criteria for
convergent validity.
Discriminant validity. Discriminant validity is the indicators of a construct
that are not only converging, but also different or negatively related with other
constructs (Neuman, 2000: 170). There are two ways to determine the discriminant
validity, namely (1) comparing between the root score of the AVE of a construct
with the correlations score of the latent variables (an indicator is said to meet the
criteria of discriminant validity if the root score of the AVE is > correlation score of
the latent variables) and (2) seeing the cross loadings score of a construct (an
indicator is said to meet of discriminant validity if the scores of cross loadings of the
constructs accumulates at their construct and have greater scores than the score of
cross loadings on other constructs).
Reliability. Reliability testing is conducted to determine the accuracy,
consistency, and precision of a measuring instrument in performing measurements
(Hartono, 2008). Parameters to determine the reliability of the instrument are the
score of Cronbachs alpha and the composite reliability. A research instrument is said
to meet the criteria as a reliable instrument if the instrument has Cronbachs alpha >
0.6 and composite reliability> 0.7.
Hypothesis Testing
Econometric equations to test the hypothesis of this study are as follows.
CSRD = α0+ α1 INTENTION-CSRD + α2PBC-CSRD + α3POSTURE + α4TYPE + α5SIZE + α6OWNERSHIP + ε. ………... (2)
FINANCIAL PERFORMANCEt = α0+ α1CSRDt-1 + α2CONCENTRATION OF OWNERSHIPt + α3LEVERAGEt + α4SIZEt + ε. ... (3)
t = year 2008
Data Processing and Analysis Method
This study used Partial Least Square (PLS) technique to process and analyze data.
Software used was SmartPLS version 2.0.M3. Processing and data analysis were
carried out through three stages, namely (1) creating an image of the research model
consisted of a structural model (inner model) and a measurement model (outer
model), (2) testing the measurement model to determine the validity and reliability
of the instrument, and (3) testing the structural model to determine the results of
hypothesis testing.
4. Empirical Results and Discussion
The research was conducted on 32 respondents of 32 sample of companies listed on
the Stock Exchange in 2007 and 2008 which engaged in these industrial sector: (1)
Miscellaneous Industry, (2) Consumer Goods Industry, (3) Basic and Chemical
Industry, (4) Mining Industry, and (5) Agricultural Industry.
Test Results of Nonresponse Bias
The t-test was used in testing the nonresponse bias. The results of the t-test showed
that the probability value (p-value) for each construct was > 0.05. This meant that
there was no significant difference between the average responses of the
questionnaires that were not late and those who were. Thus the data of this study
Test Results of Measurement Model
The first test results of the measurement model showed that some indicators of
INTENTION-CSRD, namely NM3, NM4, NM5, NM6, NM7, NM 11, NM12, and
NM 15 had score loadings < 0.6, while the loadings score required was > 0.7Besides
that, INTENTION-CSRD only had AVE and communality score of 0.4, that were
still far from th required score, ie > 0.5. These results suggested that indicators were
not valid, should be removed from the measurement model, and the measurement
model testing should be repeated without including the indicators are not valid.
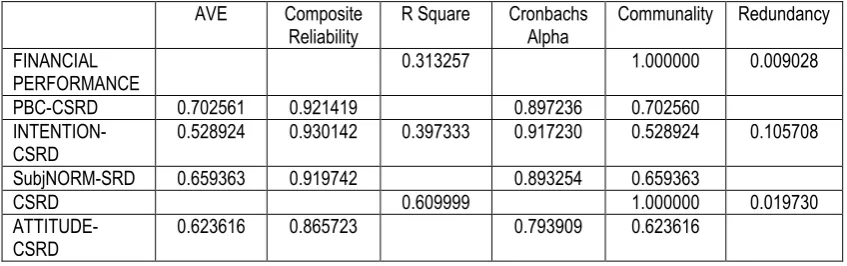
Convergent Validity. The results of repeated test of model measurement (the
advanced testing) indicated that the score loadings for the indicators in each
construct ranged from 0.74 to 0.94 (for PBC-CSRD); 0.64 to 0.82 (for
INTENTION-CSRD); 0, 67 to 0.98 (for SubjNORM-CSRD), and 0.60 to 0.95 (for ATTITUDE-
CSRD). AVE and communality scores of each construct were > 0.5 (see Table 3).
Thus, all indicators in this study had met the criteria for convergent validity.
Table 3
Quality Criteria: The Results of Advanced Test of Measurement Model
AVE Composite
0.313257 1.000000 0.009028
PBC-CSRD 0.702561 0.921419 0.897236 0.702560
INTENTION-CSRD
0.528924 0.930142 0.397333 0.917230 0.528924 0.105708
SubjNORM-SRD 0.659363 0.919742 0.893254 0.659363
CSRD 0.609999 1.000000 0.019730
ATTITUDE-CSRD
0.623616 0.865723 0.793909 0.623616
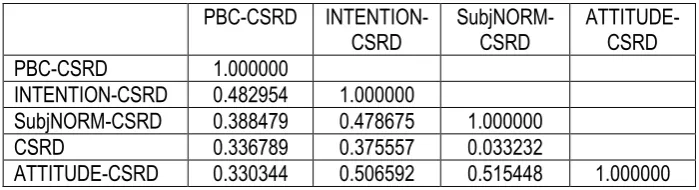
Discriminant Validity. Root of AVE for each construct was 0.838189 (for
0.528924); 0.812011 (for SubjNORM-CSRD, AVE = 0.659363); and 0.789693 (for
ATTITUDE-CSRD, AVE = 0.623616). If the scores of the root of AVE were
compared to the scores of correlation among the latent variables (see Table 4), then
the root of the AVE were > from the score of correlation among the latent variables.
Thus the indicators in this study had met the criteria for discriminant validity.
Table 4
Correlation of Latent Variables: Test Results of Measurement Model
PBC-CSRD INTENTION-CSRD
SubjNORM-CSRD
ATTITUDE-CSRD PBC-CSRD 1.000000
INTENTION-CSRD 0.482954 1.000000
SubjNORM-CSRD 0.388479 0.478675 1.000000
CSRD 0.336789 0.375557 0.033232
ATTITUDE-CSRD 0.330344 0.506592 0.515448 1.000000
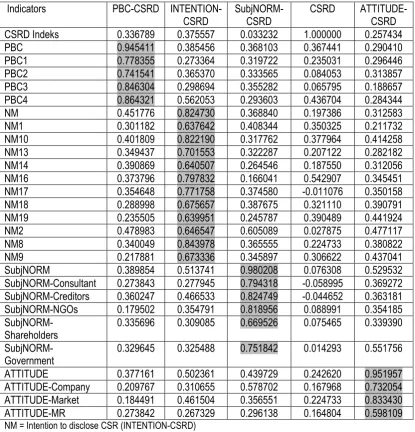
Discriminant validity could be found by looking at the score of cross loadings
of a construct. The scores of cross loadings of the measurement model test results
were presented in Table 5. From this table, it could be seen that the entire scores of
cross loadings for PBC, PBC1, PBC2, PBC3, and PBC4 indicator were accumulated
in their construct (i.e. PBC-CSRD) and had higher scores than the indicator scores to
other constructs (INTENTION-CSRD, SubjNORM-CSRD, CSRD and
ATTITUDE-CSRD). The same thing happened in other indicators. This showed that the indicators
Table 5
Cross Loadings Scores: Results of Measurement Model Testing
Indicators PBC-CSRD INTENTION-CSRD
SubjNORM-CSRD
CSRD ATTITUDE- CSRD CSRD Indeks 0.336789 0.375557 0.033232 1.000000 0.257434
PBC 0.945411 0.385456 0.368103 0.367441 0.290410
PBC1 0.778355 0.273364 0.319722 0.235031 0.296446
PBC2 0.741541 0.365370 0.333565 0.084053 0.313857
PBC3 0.846304 0.298694 0.355282 0.065795 0.188657
PBC4 0.864321 0.562053 0.293603 0.436704 0.284344
NM 0.451776 0.824730 0.368840 0.197386 0.312583
NM1 0.301182 0.637642 0.408344 0.350325 0.211732
NM10 0.401809 0.822190 0.317762 0.377964 0.414258
NM13 0.349437 0.701553 0.322287 0.207122 0.282182
NM14 0.390869 0.640507 0.264546 0.187550 0.312056
NM16 0.373796 0.797832 0.166041 0.542907 0.345451
NM17 0.354648 0.771758 0.374580 -0.011076 0.350158
NM18 0.288998 0.675657 0.387675 0.321110 0.390791
NM19 0.235505 0.639951 0.245787 0.390489 0.441924
NM2 0.478983 0.646547 0.605089 0.027875 0.477117
NM8 0.340049 0.843978 0.365555 0.224733 0.380822
NM9 0.217881 0.673336 0.345897 0.306622 0.437041
SubjNORM 0.389854 0.513741 0.980208 0.076308 0.529532 SubjNORM-Consultant 0.273843 0.277945 0.794318 -0.058995 0.369272 SubjNORM-Creditors 0.360247 0.466533 0.824749 -0.044652 0.363181 SubjNORM-NGOs 0.179502 0.354791 0.818956 0.088991 0.354185
SubjNORM-Shareholders
0.335696 0.309085 0.669526 0.075465 0.339390
SubjNORM-Government
0.329645 0.325488 0.751842 0.014293 0.551756
ATTITUDE 0.377161 0.502361 0.439729 0.242620 0.951957 ATTITUDE-Company 0.209767 0.310655 0.578702 0.167968 0.732054 ATTITUDE-Market 0.184491 0.461504 0.356551 0.224733 0.833430 ATTITUDE-MR 0.273842 0.267329 0.296138 0.164804 0.598109 NM = Intention to disclose CSR (INTENTION-CSRD)
NGOs = Nongovernmental Organization MR = Manager reputation
Reliability of the Test Results. Based on Table 3, Cronbach's alpha of each
construct has a score > 0.6. Composite reliability of each construct had a score > 0.7.
Structural Model Testing Results
Based on Table 3, the R-square value for the dependent variables of
INTENTION-CSRD was 0.397 (moderate). This meant that the construct variability of
INTENTION-CSRD could be explained by ATTITUDE-CSRD, SubjNORM-CSRD,
and PBC-CSRD construct at 0.397 (40%), the remaining 60% was explained by
other variables that were not examined (variables outside the research model).
R-square value for the dependent variable for CSRD was 0.609 (good). This meant that
the construct variability of CSRD could be explained INTENTION-CSRD construct,
PBC-CSRD construct, and the control variable at 0.609 (61%), The remaining 39%
was explained by other variables outside the model. R-square value for the dependent
variable FINANCIAL PERFORMANCE was 0.313 (moderate). This meant that the
variability of FINANCIAL PERFORMANCE could be explained by the all
independent variables in the model by 31%, the remaining 69% was explained by
other variables outside the model.
Research hypothesis would be supported if the coefficient β of ATTITUDE
-CSRD to INTENTION--CSRD, SubjNORM--CSRD to INTENTION--CSRD,
PBC-CSRD to INTENTION-PBC-CSRD, INTENTIONS-PBC-CSRD to PBC-CSRD, PBC-PBC-CSRD to
CSRD, and CSRD to FINANCIAL PERFORMANCE had a positive values and the
t-statistics values were greater than the t-table value (t-table value of significance of
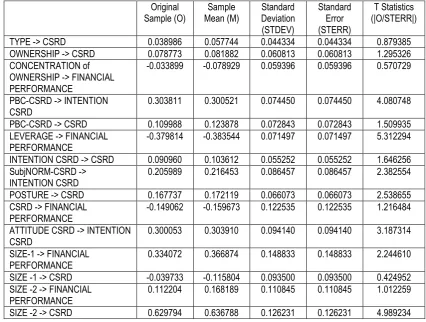
5% = 1.64). In Table 6 the test result of the structural model and ROA were placed as
Table 6
Path Coefficient: Structural Model Testing Results – ROA as indicators FINANCIAL PERFORMANCE
Original
TYPE -> CSRD 0.038986 0.057744 0.044334 0.044334 0.879385 OWNERSHIP -> CSRD 0.078773 0.081882 0.060813 0.060813 1.295326 CONCENTRATION of
OWNERSHIP -> FINANCIAL PERFORMANCE
-0.033899 -0.078929 0.059396 0.059396 0.570729
PBC-CSRD -> INTENTION CSRD
0.303811 0.300521 0.074450 0.074450 4.080748
PBC-CSRD -> CSRD 0.109988 0.123878 0.072843 0.072843 1.509935 LEVERAGE -> FINANCIAL
PERFORMANCE
-0.379814 -0.383544 0.071497 0.071497 5.312294
INTENTION CSRD -> CSRD 0.090960 0.103612 0.055252 0.055252 1.646256 SubjNORM-CSRD ->
INTENTION CSRD
0.205989 0.216453 0.086457 0.086457 2.382554
POSTURE -> CSRD 0.167737 0.172119 0.066073 0.066073 2.538655 CSRD -> FINANCIAL
PERFORMANCE
-0.149062 -0.159673 0.122535 0.122535 1.216484
ATTITUDE CSRD -> INTENTION CSRD
0.300053 0.303910 0.094140 0.094140 3.187314
SIZE-1 -> FINANCIAL PERFORMANCE
0.334072 0.366874 0.148833 0.148833 2.244610
SIZE -1 -> CSRD -0.039733 -0.115804 0.093500 0.093500 0.424952 SIZE -2 -> FINANCIAL
PERFORMANCE
0.112204 0.168189 0.110845 0.110845 1.012259
SIZE -2 -> CSRD 0.629794 0.636788 0.126231 0.126231 4.989234
Based on Table 6, the results of hypothesis testing were described as follows.
Hypothesis 1
Coefficient β value for ATTITUDE-CSRD to INTENTION-CSRD was 0.300053
and the t-statistic was 3.187314. Thus this study supports the hypothesis that states ‘The attitude of the managers toward the disclosure of CSR has a positive influence
on their intention to disclose the CSR.’
Hypothesis 2
Coefficient β value for SubjNORM-CSRD to INTENTION-CSRD was 0.205989 and
subjective norms of the managers toward the disclosure of CSR have a positive influence on their intention to disclose the CSR.’
Hypothesis 3
Coefficient β value for PBC-CSRD to INTENTION-CSRD was 0.303811 and the
t-statistic was 4.080748. Thus this study supports the hypothesis that states ‘The
control of the perceived behavior of the managers over the disclosure of CSR has a
positive influence on their intention to disclose the CSR.’
Hypothesis 4
Coefficient β value for CSRD to INTENTION CSRD was 0.090960 and the
t-statistic was 1.646256. Thus this study supports the hypothesis that states ‘The
intention of the managers to disclose the CSR has a positive influence on the
behavior of CSR disclosure.'
Hypothesis 5
Coefficient β value for PBC-CSRD to the CSRD was 0.109988 and t-statistic value
was 1.509935. Thus this study could not support the hypothesis that states ‘The
perceived behavior control of the managers over the disclosure of CSR has a positive influence on their intention to disclose the CSR.’
In this study the control variable POSTURE had a positive influence and was statistically significant for CSRD. This meant that Ullmann’s opinion (1985) that the
strategic posture is the company's response toward social demands is supported in
this study, that the company that has an active posture will make a lot of social
SIZE-2 (proxied using the log of total assets) had a positive influence and was
statistically significant for CSRD. This finding confirmed the existence of political
cost hypothesis (Watts and Zimmerman, 1986) and previous empirical studies
(Belkaoui, 1989; Kent and Chan, 2003) which concluded that a company makes a
disclosure of CSR in order to reduce its political visibility.
Hypothesis 6
Coefficient β value for CSRD to FINANCIAL PERFORMANCE was -0.149062 and
t-statistic value was 1.216484. Thus this study could not support the hypothesis that
states 'CSR disclosure has a positively correlated to corporate financial performance.'
5. Conclusion, Implications, Limitations, and Suggestions for Further Research Conclusion
The study produced the following main findings.
1. The disclosure of CSR in Indonesia was affected by the intention of the manager
to disclose CSR. The intention of the managers to disclose CSR was influenced
by three factors, namely the attitude of the managers towards the disclosure of
CSR, the subjective norms of the managers over the disclosure of CSR, and the
perceived behavioral control of the managers over the disclosure of CSR.
2. The perceived behavioral control over the disclosure of CSR does not affect the
disclosure of CSR. The perceived behavioral control over the disclosure may
affect the disclosure of CSR only when it preceded by managers intention to
disclose the CSR programs.
3. The disclosure of the CSR in Miscellaneous Industry, Consumer Goods
Industry has no effect on the companies’ financial performance for the period of
one year after the disclosure of the CSR. This means that the disclosure of CSR
in these five industries does not bring any values for the market and for the
companies themselves for the period of one year following the disclosure of the
CSR.
Implication
Theory. This study had proven that the company's practice of providing information to public is influenced by not only the observable factors related to
characteristic of the company, but also unobservable factors inherent in the manager
himself. This suggests that the socio-economic perspective can be used to describe
the practice of CSR disclosure.
The findings that CSR disclosure is not correlated to financial performance
have important implications in the teaching of accounting and financial reporting
practices by the company. In the teaching of accounting, the results of this study will
add the knowledge of lecturers and students about the economic benefits of CSR
disclosure. For companies, the findings of this study can be the subject of extensive
study in determining the extent of information that will be given to public.
Public Policy. This study had proven that the companies in Miscellaneous
Industry, Consumer Goods Industry, Basic and Chemicals Industry, Mining Industry,
and Agriculture Industry acquire no economic benefit from their decision to carry out
CSR activities. This means that the government's decision to legally oblige
companies to undertake CSR and disclose it (as stated in Article 74 paragraph (1)
and Artikel 66 of Company Act. No. 40/2007) did not bring any economic benefits to
This study found some variation in the disclosure of CSR among the
companies observed. The variation of the CSR makes it difficult to the public in
assessing and comparing the performance of CSR among the companies with CSR
programs. Therefore, the BAPEPAM-LK as regulator of financial reporting for
public companies should set standards for the disclosure of CSR, including the scope
of disclosure. Standardization of disclosure is necessary to reduce the variation of the
disclosure of CSR and, hence, it will facilitate the public in assessing and comparing
the performance of CSR among companies.
This study proves that shareholders, creditors, government, NGOs, and firms’
consultant affect managers in disclosing the CSR. This means that the government is
not the only "actor" that can ensure the success of CSR policy and its disclosure. The
government must socialize CSR policy intensively not only to managers, but also to
other parties which have certain concern in the company of interest, including issuing
continuum policy that requires the creditor of the company to include CSR as an
important consideration in any credit decision making.
Methodology. This study managed to establish a questionnaire to measure the constructs of intention, attitude and subjective norm with proven validity and
reliability. Therefore, this questionnaire can be used as a benchmark by the
researchers who will conduct research with these constructs.
Research Limitation
1. This research includes only behavioral variables which are considered in theory
of planned behavior, not variables that may affect behavior (e.g. self efficacy).
Although Ajzen (1991: 184) claims that PBC is compatible with self-efficacy,
constructs are not entirely identical. Moreover, Bandura (1986, 1992) as quoted
in Armitage and Conner (2001) states that self-control and self-efficacy are
different concepts. While the former is more general and includes external
factors, the latter is more focus on cognitive perception on control which is based
on internal control factors.
2. This research combines primary and secondary data. These two kinds of data are
difficult to combine due to the dissimilarity in their characteristics.
Future Research
Based on the limitations presented above, future study may need to consider the
followings:
1. To include variables other than those considered in planned behavior theory. The
difference of PBC and self-efficacy characteristics may open an opportunity for
future research to develop behavioral model in predicting CSR disclosing
behavior. Self-efficacy may be included in Planned Behavioral Theory and
incorporated as independent variable (in addition to PBC). This variable may also
be associated directly to CSR disclosure. Alternatively, self-efficacy can be used
as moderating variable that may affect the relationship between PBC and CSR
disclosing behavior.
2. The development of a new model that may separate primary and secondary data