The Application Of Raw Materials Controlling In UD Chandra
Group
Beby Mutiara Islami 1) Januar Wibowo 2) Endra Rahmawati 3) S1 / Jurusan Sistem Informasi
Institut Bisnis dan Informatika Stikom Surabaya Jl. Raya Kedung Baruk 98 Surabaya, 60298
Email: 1) [email protected], 2) [email protected], 3) [email protected]
Abstract:
UD Chandra Group is a manufacture company which focused in selling softcase. The brand which is developed is ultimate brand. The brand has already dotted throughout Indonesia such are Surabaya, Jember, Banyuwangi, Kediri, Malang, Madiun, Yogyakarta and other big cities. There two types of softcase, double type and single type which each size are 10 inch, 11.6 inch, 12 inch and 14 inch. Until now, in purchasing raw materials, the company refers to customer demand from the previous transaction and the waste stock in bond. Therefore, the company has not supplied the raw materials optimally yet. However, raw materials control application is needed to overcome the problem in supply the raw materials. Raw materials inventory control application provides some menu for calculate forecasting customer demand, including method such as Single Exponential Smoothing (SES) method, Double Exponential Smoothing (HOLT) method and Triple Exponential Smoothing (WINTER) method. That prediction methods are used to predict the customer demand in the future and provide the number of raw materials for the next period. The number result is used as the reference to process the calculation of reorder point (ROP). Reorder point is used to determine the raw materials reorder.
Keyword: Application, Forecasting, Inventory Control Raw Materials, SES, HOLT, WINTER, ROP
1. INTRODUCTION
UD Chandra Group is one company that is engaged in manufacturing sales of laptop bags (softcase). Brands developed is the ultimate brand. There are two types namely single softcase types and double type with a size of 10 inch, 11.6 inch, 12 inch and 14 inch. In the production process is based on the make to stock. The production capacity adjusted for the number of customer requests every day, so that the production of softcase changed every month. To produce softcase, there are several stages of the production process, before entering into the stages, the first part of the production saw the production plan. Here, production plan is used to see softcase daily production schedule based on customer demand, softcase type, size and number softcase. Then, do the checking of raw materials by the warehouse, if the raw material runs out it will be ordering raw materials, the warehouse will create a list of raw material demand on the part of the purchase, while to make a reservation of raw materials to suppliers, the waiting time (lead time) needed is for less over 2 days. If the raw material is available, it will be continued to the process of production, then part of the production of raw materials
make a list of requests to the warehouse. Further into the stages of the production process is the preparation stage, the stage of cutting, sewing stage, kun stage, stage quality control (QC) and the final stages of packing. Raw materials used in the manufacture of softcase is a motif fabric, foam, zippers, hoses, and handle while adjuvant is yarn, shoulder pad, rubber, and hook.
The main raw material used is the motif fabric and foam p83. Motif fabric used as an outer layer of foam softcase while p83 function as a reducer softcase foam and used as a basis for making softcase.
Exponential Smoothing (WINTER). All three of the forecasting methods used for forecasting customer demand so that the company can choose the appropriate forecasting method in forecasting customer demand, so that it can predict customer demand in the future and prepare the raw material requirements for the next period. The results of the raw material requirement is used as a reference in the process of calculating the reorder point (ROP). Reorder point is used to determine the reorder point materials. From this calculation, it can be seen how much the amount of raw materials to be ordered in accordance with the needs of raw materials in the period ahead and based safety stock and lead time (waiting time) each raw material to do the reordering of the raw material.
2. RESEARCH METHODS
A. FORECASTING USING SINGLE
EXPONENTIAL SMOOTHING (SES) According to (Arsyad, 2001) exponential smoothing is a procedure that repeats calculations continuesly using the latest data. This technique is widely used when forecasting monthly or weekly is required for goods - goods in large quantities. Mathematically, exponential smoothing equation can be seen in the following equation.
–
Where :
+1 = value forecast for the next period
smoothing constant 0 < < Yt = new data or Y actual value in period t
= value smoothing the old or the average is smoothed to period t-1
B. FORECASTING USING DOUBLE
EXPONENTIAL SMOOTHING
(HOLT)
According to (Arsyad, 2001) Double exponential smoothing (HOLT) smooth the trend and the slope directly using the different smoothing constants. Three equations used in this technique are as follows:
1. Exponential smoothing circuit
+ (1 – ) 2. Estimated trend
3. Forecast in the period p
Where :
= new value that has been smoothed
= smoothing constant for the data (0 1)
= new data or actual in period t
= smoothing constant for trend estimation (0 1)
= estimated trend = the forecast period
= the value forecast in the period p
C. FORECASTING USING TRIPLE
EXPONENTIAL SMOOTHING
(WINTER)
According to (Makridakis, Wheelwright, and McGee, 1999) method is based on three winters equation, that is the equation for stationary elements, one for the trend, and one for seasonal. This is similar to the method HOLT, with an additional equation to overcome seasonal.
According to (Arsyad, 2001) linear model of three parameters and seasonal exponential smoothing stated by Winter, it may reduce forecasting error. An additional equation is used to estimate the influence of seasonal factors. There are four models of equations used in the winter are as follows:
1. Exponential smoothing
+ (1- )( + )
2. Estimated trend
= ( + ) + (1- ) 3. Estimated seasonal
4. Forecast in the period p in the future
= (
Where :
= value smoothing new
= smoothing constant for the data (0 1) = new data or actual in period t
= smoothing constant for trend estimation (0 1)
= estimated trend
= smoothing constant for estimation of seasonal
(0 1)
= estimated seasonal = the forecast period = length of the season
= the forecast for the period p
D. REORDER POINT (ROP)
According to (Rangkuti, 2007) Reorder point (ROP) occurs when the amount of supplies that are in stock decreased continuously. Thus, we have to determine how much the minimum threshold level of inventory should be considered so that there is no shortage of inventory. The expected amount calculated during the grace period. Perhaps, it can also be added to the safety stock that usually refers to the probability or likelihood of shortages during the grace period. ROP or commonly called the boundary / point number reordering including the request is desired or required during the
d = level requirements per unit of time L = lead time
SS = safety stock
3. DESIGN OF RAW MATERIAL
INVENTORY CONTROL SYSTEM A. Data Collection
Interviews were conducted to the company to identify and analyze the problems happens and then collect the data that will be used to meet the needs of the system being designed. The data needed include customer demand data period 2013 - 2015 and raw materials data.
The observation is conducted to observe and identify the problems that occur in UD Chandra Group directly. By conducting observation or direct observation of the current condition of the company, so it can find the system requirements desired by the company.
B. Identification of Problems
The identification issues are conducted to find the problem as it exists in UD Chandra Group. From observations and interviews that have been conducted, the company has a problem in terms of producing and controlling the raw material requirements. Based on the identification of the problems, the company needed a system that can control the raw material needs, then made raw material inventory control applications.
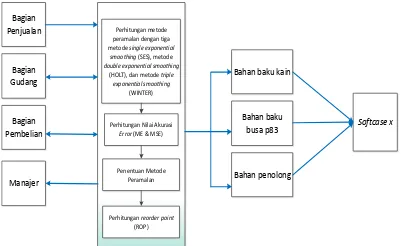
Below is a block diagram of raw material inventory control applications..
Picture 1. Block diagram of Raw Material Inventory Control data in forecasting customer demand of the year 2013-2015.
2. The process of demand forecasting provides three methods of forecasting the single exponential smoothing (SES), double exponential smoothing (HOLT), and triple exponential smoothing (WINTER). The provision of these three methods is to facilitate the company in determining the correct forecasting method by comparing the value of the smallest error.
3. The calculation of the value of accuracy error is performed to determine the smallest error value of each forecasting method. So that later will result in the value of ME and MSE in each forecasting method.
4. The process of determining which methods of forecasting in this process will be the selection of appropriate forecasting methods by manager of company.
5. The results of this customer demand forecasts are used to see the customer demand for the coming period, so it can be the raw material needs whatever is necessary so that the company can provide the raw material needs with the results forecast customer demand as reference the purchase of raw materials, so the raw materials takes no deficiency or excess stocks of raw materials.
6. After selecting the further customer demand forecasting methods calculate the reorder point (ROP). This process is carried
Softcase x metode single exponential smoothing (SES), metode double exponential smoothing
out to determine the reorder point of raw materials to the arrival or receipt of raw materials that can be ordered on time. 7. In making one type soft case main raw
material used the motif fabric and foam p83. Motif fabric and foam the size of p83 vary according to the size softcase itself. In making the fabric motif softcase need P38cm x (L28cm x 2) and requires foam p83 P37cm L27cm x T x 4cm. Adjuvant takes the form reselecting, hose, handle, yarn, shoulder pad and rubber. So after knowing customer demand forecasting for future periods to determine the amount of warehouse, purchasing, sales and manager.
C. Hierarchy Input Process Output (HIPO) Hierarchy Process Input Output (HIPO) or
Gambar 2. Diagram HIPO Raw Material Inventory Control Application
4. RESULTS AND DISCUSSION
Results from making inventory control applications in UD Chandra Group are as follows:
A. Context Diagram
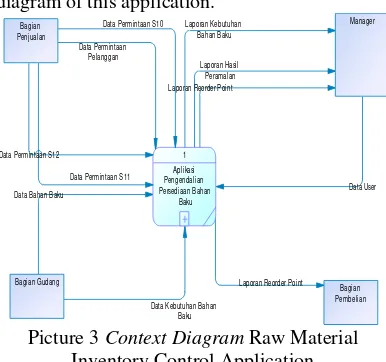
Solutions to problems described in the draft context diagram. Below is a context diagram of this application.
Picture 3 Context Diagram Raw Material Inventory Control Application
In this diagram, the input context used consisted of customer demand data, the data of raw materials, raw material demand data and user data. There are a few users who can access the system; it is tailored to the needs of the company. External entity sales department to provide data on customer demand, the role of manager here is tasked to forecast customer demand and receive the results of the calculation of reorder point (ROP), the role of the warehouse to provide information raw materials, warehouse and material require
B. Data Flow Diagram Level 0
Below is a data flow diagram level 0 of the raw material inventory control applications in UD Chandra Group. In the data flow diagram is described in more detail each process between the user and the system. There are four existing processes, namely the processing of the master, the process of forecasting the three methods of calculation, the electoral process and the method of calculating the reorder point (ROP). For more details can be seen in Picture 4.
1.2.1 1 Data Permintaan Pelanggan
Data Permintaan
Material Inventory Control Application
C. Data Flow Diagram Level 1
Below is a level 1 data flow diagram of raw material inventory control applications in UD Chandra Group. At level 1 data flow diagram is a fraction of a data flow diagram level 0 processes the prediction and search for the smallest MSE. There are four existing processes, namely the process of the prediction by SES method, the calculation process HOLT forecasting methods, the calculation process of forecasting methods and seek MSE WINTER. For more details can be seen in Picture 5.
Picture 5. Data Flow Diagram level 1 Raw Material Inventory Control Application
D. Calculation Forecasting with Three Forecasting Methods.
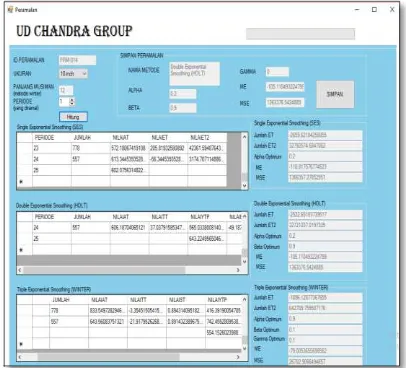
The prediction function to calculate the customer demand forecasting with three methods of forecasting single exponential smoothing (SES), double exponential smoothing (HOLT) and a triple exponential smoothing (WINTER). This form consists of three textbox to fill id forecasting, seasonal long for WINTER methods and periods foreseen. In this form, there are two buttons that button count used to calculate the prediction using three methods of forecasting, save button is used to store the results of the prediction and the need for raw materials. Then there are three data grid view that is used to display the results of the prediction of each forecasting method. Fill in the field textbox save forecasting results will appear automatically after the calculation in data grid view appears. The textbox is to display the results of a comparison of the three methods of forecasting. Then the result of the elections will be stored in the database forecasting results, the results of calculation of raw material requirements out automatically after knowing the result of customer demand forecasting.
Figure 6 Calculation Forecasting with Three Forecasting Method Based on Size Softcase
After doing the calculations forecasting customer demand with three methods will be forecasting the results obtained with the method chosen. 1 Data Permintaan Pelanggan
2 Data Bahan Baku
7 Data Kebutuhan Bahan Baku
8 Reorder Point 9 Peramalan
10 Hasil Peramalan 11 Data User
12 Data Permintaan S10
Laporan Reorder Point
Figure 7 Forecasting Reports
E. Report of Raw Material Needs
Reports need for raw materials is obtained after the prediction. After learning the results of forecasting customer demand for the next period it can be seen the amount of raw material requirements in the coming period.
Figure 8 reports Raw Material Needs
F. Calculation Reorder Point (ROP) Calculation Reorder Point (ROP) is used to calculate the amount of raw material reorder point based on raw material requirement from customer demand forecasting results for future periods.
Figure 9 Calculation Reorder Point (ROP)
From the calculation of reorder point (ROP) obtained reports reorder point of each raw material. This report contains the plan to reorder the raw material and the amount of raw materials should be ordered based on the raw material requirements for the coming period. Here is a report view reorder point (ROP).
Figure 10 Report Reorder Point (ROP)
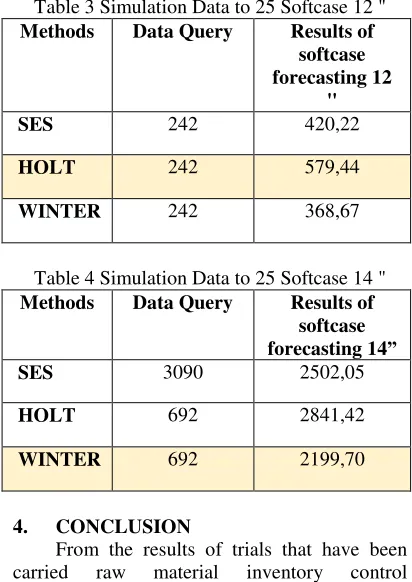
G. Trial Data To 25 Calculations Forecasting
Table 1 Simulation Data Into 25 Softcase 10 " Methods Data Query Results soft
case forecasting 10 "
SES 692 596,56
HOLT 692 637,68
WINTER 692 557,96
Table 2 Simulation Data to 25 Softcase 11.6 " Methods Data Query Results soft
case forecasting 11,6”
SES 598 544,43
HOLT 598 564,84
Table 3 Simulation Data to 25 Softcase 12 " Methods Data Query Results of
softcase forecasting 12
"
SES 242 420,22
HOLT 242 579,44
WINTER 242 368,67
Table 4 Simulation Data to 25 Softcase 14 " Methods Data Query Results of
softcase forecasting 14”
SES 3090 2502,05
HOLT 692 2841,42
WINTER 692 2199,70
4. CONCLUSION
From the results of trials that have been carried raw material inventory control applications in UD Chandra Group, the conclusion that can be drawn are as follows: 1. This application has yielded information on
the results of calculations per customer demand forecasting period using three methods: the method of Single Exponential Smoothing (SES), Double Exponential Smoothing (HOLT) and Triple Exponential Smoothing (WINTER).
2. The application also has produced information on the amount of raw material requirements based on customer demand forecasting for future periods.
3. The application can perform the calculation process reorder point (ROP) for each raw material in accordance with customer demand forecasting.
From the test results of simulation calculation data forecasting customer demand to 25 suggestions that can be submitted for the development of this application are as follows: 1. Method of forecasting single exponential
smoothing (SES), double exponential smoothing (HOLT) and a triple exponential smoothing (WINTER) is used to predict in the short term. If it is using the predicted long-term period, exponential smoothing method is less precise forecasting results.
2. For the prediction softcase 12 "chosen method is a method of Double Exponential Smoothing (HOLT), but the result of the prediction is far from the data request so that this method is less precise so it is advisable to use the methods of forecasting.
3. For the prediction softcase 14 "chosen method is a method Triple Exponential Smoothing (WINTER), but the result of the prediction is far from a data request that is experiencing the difference between a total of 891 so the method is less precise and advised to use other forecasting methods.
REFERENCE
Agus, R. (2009). Manajemen Persediaan Edisi 1. Yogyakarta: Graha Ilmu.
Arsyad, L. (2001). Peramalan Bisnis Edisi
Pertama. Yogyakarta:
BPFE-Yogyakarta.
Assauri, S. (2004). Manajemen Produksi dan Operasi. Jakarta: Fakultas Ekonomi Universitas Indonesia.
Haizer, J. d. (2009). Manajemen Operasi Buku 1 Edisi 9. Jakarta: Salemba 4.
Haming, M. d. (2007). Manajemen Produksi Modern : Operasi Manufaktur dan Jasa Buku 1. Jakarta: Bumu Aksara.
Herjanto, E. (2008). Manajemen Operasi Edisi Ketiga. Jakarta: PT Grasindo.
Makridakis, S., Wheelwright, S. C., & McGee, V. E. (1999). Metode dan Aplikasi Peramalan Edisi Kedua Jilid Satu. Jakarta: Binarupa Aksara.
Prawirosentono, S. (2000). Manajemen Operasi. Jakarta: PT Bumi Aksara.
Rangkuti, F. (2007). Manajemen Persediaan Aplikasi di Bidang Bisnis. Jakarta: PT RajaGrafindo Persada.