OFFICIAL BUILDINGS IN ITERA CAMPUS
Amna Citra Farhani1, Didik Supriyadi2
1Biosystem Engineering Department, ITERA ([email protected]) 2Chemical Engineering Department, ITERA, ([email protected])
Abstract: Decreasing of energy consumption for buildings has become a common issue in many countries. This makes rising in the importance of having an effort to conserve the energy use for consumption. Energy audit is a starting point to have the conservation energy effort. With energy audit, the energy consumption pattern of a system could be achieved and the scheme for decreasing energy consumption could be drawn. Higher education institution should be the agent to implement the energy conservation in society. This paper is aim to have energy audit and energy consumption pattern in ITERA especially for building A and B. With the result, a scheme for energy consumption in building A and B is presented. Both building is categorized as efficient enough in its energy consumption. Electrical energy used for air conditioner is the highest energy consumption for both building. Some proposed scheme for reducing energy consumption includes replacement for more energy efficient equipment and a better planning on people’s scheduling on each building.
Keyword : energy audit, conservation energy, energy consumption pattern, scheme forreducing energy consumption
1. Introduction
Every human activities demand energy. Electrical energy is a favorable kind of energy for it is easy to convert to another kind of energy and to get it. Mostly, electrical energy in Indonesia comes from PLN (Perusahaan Listrik Negara, State Electric Company) supply. If the supply is insufficient, the next step is by using diesel generator. This practice is common in Lampung in which its electrification ratio of PLN is 76.72 [1].
Institut Teknologi Sumatera (ITERA) is a new higher education institute of technology established in Lampung at 2014. As the only state owned institute of technology in Sumatra, ITERA receives a good feedback from the society. It can be shown from the increasing number of student. As in 2015 there were only 340 students, while in 2016 there were 1540 students while in 2017 ITERA plans to have 3240 students. This huge leap in number of student means a huge rise in energy consumption.
The energy consumption in most tropical building is mostly for air condition and artificial lightning [2]. This is true for ITERA situation since it is located in Indonesia. The increasing of energy demand should be followed with the increasing of energy supply. In ITERA, this could not meet by PLN. In order to have a sufficient electrical supply, ITERA installed its diesel generator in 2016. The 2016 cost percentage for electricity and diesel fuel is 2.9% and 3.1% respectively. With the increasing number of student, the cost for electricity and diesel fuel will follow. From this matter, the issue of energy conservation and efficiency is emerging.
There is a difference between energy conservation and energy efficiency. Energy conservation means using less energy for the same activity, while energy efficiency means using same amount of energy for more activity [3]. The ideal solution for lowering energy consumption is by combine these two methods. This ideal solution will have less energy usage and in turn will decrease energy consumption and consecutively will decrease energy cost. To have this ideal solution, the first step to do is by auditing the energy system in ITERA existing building.
Energy audit is not a new thing in Indonesia. Indonesia already has standard for auditing energy in industry and official building. An energy audit is a survey of energy usage in a system to decide a way to preserve the energy used. Another author stated that energy audit is an inspection, survey and analysis of energy flow for energy conservation in an industry or process to reduce the amount of energy input into the system without negatively affecting the output [4]. Based on this definition, the aim of the current research is to find out energy consumption pattern. This finding will help to determine conservation scheme that will be use.
2. Methods
2.1 Energy audit
As Thumann and Younger described [5], energy audit meaning could be varied according to different person. Simply said, energy audit is a process to evaluate energy usage in a building or a process and then identify an approach to reduce its energy consumption. Krafti in his book [6] described there are four types of energy audit, which are often done in sequence. They are :
1. A walk – through audit: in this type of audit, the audit process is conducted to have immediate results. Typically a short on site visit could be done to check the operating and maintenance condition of the system.
2. Utility cost analysis: the main purpose of this type of audit is to analyze the operating cost of a facility. From the operating cost, a suggestion for retrofitting or for utility modification could be proposed.
3. Standard energy audit: besides having a suggestion, the output of this audit is also a standard energy baseline of a facility and the effectiveness of the suggestion made from the previous audit.
4. Detailed energy audit: by conducting this type of audit, computer simulation program is applied to evaluate and recommend energy retrofits for the facility. This includes using sensors to analyze the energy use distribution by load type.
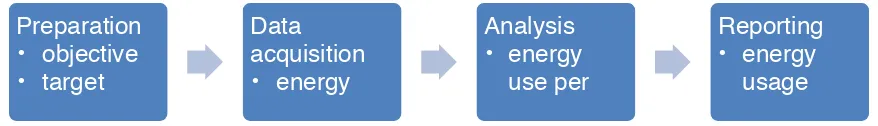
Our study is categorized as a utility cost analysis, since the output of this study is to have recommendation for decreasing energy usage in ITERA. Indonesia also have its guidance on how to perform an energy audit in a building [7]. Our study uses this guidance to perform the energy audit. Based on the guidance, figure 1 shows the step taken to have an audit process:
Figure 1. Conducted audit process in this study
2.2 Data Acquisition Method
Data acquisition for this study is conducted during semester break academic year of 2016/2017. After the semester break, energy consumption history is still gathered to have a better comprehension of the energy consumption on its peak use. The electricity usage data gathered is based on the technical data of the appliances used in every room or from the installed capacity of the appliances and generalization of the same function of appliances. Based on gathered data, there are several parameters that need to be measured. They are the temperature, the humidity, the luminance and the air flow. These parameters will be used later in the analysis process.
ITERA, until July 2017, has four major building, named as building A, B, C and D. Building A and B is solely used for official matters, while building C and D is used for both official (academic office, some department office) and academic use (laboratory, class room). Building A and B both have two floor. Since the time for data gathering is on summer break, the location for data gathering is selected on building A and B, which are exclusively used for official operation. Beside of this reasoning, the electricity supply is the consideration of choosing building A and B. Building C and D previously used diesel fuel for its electricity but later changes to PLN for its electricity.
2.3 Analysis method
The energy consumption history data gathered from previous method later used to determine the Intesitas Konsumsi Energi (IKE, intensity of energy consumption) with unit of kWh/m2/month. The
Preparation
• objective
• target
Data
acquisition
• energy
Analysis
• energy
use per
standard IKE are presented below.
Based on the criteria above, the system needs further analysis if it falls on criteria other than highly efficient or efficient. Further analysis also could be done based on the electricity usage. From these conditions, the suggestion for reducing electricity usage is selected and recommended to the institution. Later, the gathered data will be compared with the existing electricity bill from PLN.
3. Results and Discussion
3.1. Data gathered results
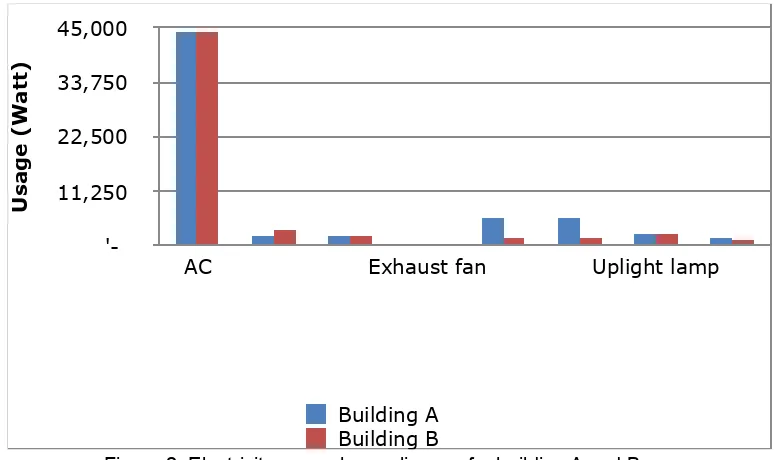
The results of data gathered from the building A and B based on electricity usage is presented on figure 2. Electricity usage for every room can not be presented because both building use a central air conditioning. The assumption for the electricity usage is for 10 hours and 20 workdays. According to figure 2, the highest electricity usage for both building is for the air conditioner. Since the server room for ITERA’s internet services is in building A it makes usage for other electricity appliances (server, router, switcher) is the second highest. The lightning and office appliance (monitors and dekstop) in both building are almost the same.
Figure 2. Electricity usage by appliances for building A and B
The total energy used for building A is 12.744,58 kWh and for building is 11.303,58 kWh. The electricity usage for both building is not too much in different (ratio for A and B is 1,13) Since the area of the both building is the same, that is 973,5 m2, that makes the IKE for both building is
13,09 and 11,61, respectively. From table 1, building A categorized as effiecient enough and building B is categorized as efficient. According to Mukhlis [8], potential for cost reducing every month could be determined using formula below
No Criteria Air - conditioned
room (kWh/m2/mth)
Un air – conditioned room (kWh/m2/mth)
1 Highly efficient 4,17 – 7,92 0,84 –1,67
2 Efficient 7,92 –12,08 1,67 – 2,50
3 Efficient enough 12,08 – 14,58
-4 Wasteful enough 14,58 – 19,17
-5 Wasteful 19,17 – 23,75 2,50 – 3,34
6 Highly wasteful 23,75 – 37,75 3,34 – 4,17
Us
ag
e
(
W
at
t)
'- 11,250 22,500 33,750 45,000
AC Exhaust fan Uplight lamp
In this study, the targeted IKE is for the highly efficient, 7,92. By applying above formula for both building condition, the potential for cost reducing in building A and B is presented on table 3.
By looking on the table 3 and gathered data, the impressions of getting a cost reducing plan for ITERA seems high. But in reality, based on the electricity bill data [9] presented on table 4, we cannot simply use the audit results. From table 4, the real electricity usage for building A is 8.362 kWh and 23.454 kWh for building B. Electricity meter for building B is shared with ITERA’s house. But from the ratio above, we assume that electricity usage for building B is 7.400 kWh.
Based on the table 3, the IKE for building A and B are categorized as efficient and efficient enough. The cost reducing plan for both building is not necessary. But from this result, we could see there is a discrepancy between the installed capacity and the real electricity usage. It means there is many installed appliances that are not in use. It is better to replace or to eliminate the unused appliances at all. This action will make the initial cost for setting up a building will be less economic and in further time, this action will make the maintenance cost lower.
3.2. Proposed power adjustment
As mentioned above, the targeted IKE for this study is 7.92. This number is selected in regard with the area of the building. With 7.92, the maximum electrical consumption for each building is 7710,12 kWh or 38,551 Watt (based on 20 day and 10 hour of work). Based on this value, we proposed some electricity power adjustment for both building which is presented in table below
The details of the proposed power adjustment are :
• The basic appliances for the building is considering for exhaust fan and down light only. We consider up light lighting as a decoration purposes so in regards with exposure and visibility of the building during night time, down light lighting has already fulfill the quality. Building Electricity usage
B 23.454 7.400 973.5 7.60 7,92 1.467,28 No need
Electric appliances Power (Watt)
Basic (down light + exhaust fan) 4,756
energy consumption between other appliances. Laptops take electricity power only when being plugged. By assuming each building has 50 people, the adjusted power usage in 2,500 Watt.
• Water dispenser, photocopy paper, and printer machine are counted only 2 in each building or 1 unit every floor. This system will make the electricity usage lower in both building.
• The air conditioning power is reduced to 30 hp. Besides reducing the power, the installed AC network also should be corrected so that only closed room has an AC network. The proposed Ac power still need to be investigated whether it is fulfill the cooling load or not. • There is still a slot for other appliances and the total is 7,530 Watt.
4. Conclusion
Based on the above data and discussion, the conclusion of the study are :
• Both building is categorized as efficient enough on its energy consumption. • Air conditioning unit is the highest electricity usage for building A and B
• There is a difference between the installed electricity power and actual electricity power. A scheduled inspection of unused appliances is needed to lower maintenance cost.
• Proposed power adjustment is presented and it will give a slot 7,350 Watt for other appliances. PC and compact PC is replaced by laptop and the AC is reduced to 30 HP • A study about the cooling load of each building is needed to determine the power of air
conditioning unit
5. Appreciation
This study is being funded by ITERA – Mandiri grant 2017. This paper has been presented on ICOSITER 2017
6. References
[1] Bappenas, Analisis Pembangunan Wilayah Provinsi Lampung 2015. 2015.
[2] Q. J. Kwong and Y. Ali, “A review of energy efficiency potentials in tropical buildings - Perspective of enclosed common areas,” Renew. Sustain. Energy Rev., vol. 15, no. 9, pp. 4548–4553, 2011.
[3] “Advantages of energy efficiency | Natural Resources Canada.” [Online]. Available: http:// www.nrcan.gc.ca/energy/efficiency/buildings/eeb/3949.
[4] H. S. Malkiat Singh, Gurpreet Singh, “Energy Audit: a Case Study To Reduce Lighting Cost,” Asian J. Comput. Sci. Inf. Technol., vol. 2, no. 5, pp. 119–122, 2013.
[5] A. Thumann and W. J. Younger, Handbook of Energy Audits, 6th ed. Georgia: The Fairmont Press, 2003.
[6] M. Krarti, Energy Audit of Building Systems An Engineering Approach, 2nd ed. Florida: CRC Press, 2011.
[7] B. S. Nasional, Prosedur audit energi pada bangunan gedung. Indonesia, 2011, p. 16. [8] D. I. Lingkungan and U. Tadulako, “Evaluasi Penggunaan Listrik pada Bangunan Gedung