EVALUATION OF SOIL EMBANKMENT MASS MOVEMENT BY USING SUBDRAIN
SYSTEM AND REINFORCEMENT BASED ON THE NUMERICAL SIMULATION OF
SEMARANG-SOLO TOLL ROAD
Syahbudin Dayanun
Local Government of Luwuk Banggai, INDONESIA Email: [email protected]
Ahmad Rifa’i
Civil and Environmental Engineering Department, Universitas Gadjah Mada, Yogyakarta, INDONESIA E-mail : [email protected]
Kabul Basah Suryolelono
Civil and Environmental Engineering Department, Universitas Gadjah Mada, Yogyakarta, INDONESIA E-mail : [email protected]
ABSTRACT
Semarang-Solo highway is a part of Trans Java Toll Road System, which in construction stage has soil embankment mass movement between Sta. 5+ 500, -5+800 part II Gedawang-Penggaron. In this case, research is conducted to again effective and efficient solution. The research object is soil embankment which moved on site. The research aim is to identify the cause of soil embankment mass movement, to know the effect of sub drain system to soil movement and also to provide alternative solution. Slope stability analysis was solved by Plaxis, based on topography, investigation data and field instrumentation after gain the validation result with accuracy of soil movement on horizontal direction of the slope, continued by simulation with variants model which affected by strength, loading combination (traffic load), water level (dry and raining season), sub drain system and earthquake. Horizontal movement result of simulation can be seen in location of inclinometer 4.
The research result shown that soil movement pattern which strengthened with bored pile is sliding combination type of translation and rotation. The strengthened soil embankment mass with bored pile apparently still has movement as 0,246 m with SF 1,448. Due to traffic load, horizontal movement is 0,322 m with SF 1,368 where water level located in 5,5 m at BM 10 and 3,5 m at BM 11 and sub drain is pointed in 4 m mean depth. When rainy season the horizontal movement increase 0,324 m with SF 1,321 while in dry season become 0,320 m with SF 1,479. When sub drain existing reduce in average 2,0 m so horizontal movement also decrease as 0,254 m with SF 1,465. Earthquake simulation shown maximum horizontal movement is 1,422 m with SF 1,193. As alternative to minimize horizontal movement which cause by earthquake can be solved by reduce embankment height from 25,72 m to 20,72 m, simulation result provide horizontal deformation as 0,703 m with SF 1,567. In hence the existence of sub drain construction able to reduce horizontal movement of soil embankment mass in which increase the safety factor, reduction of embankment height also show positive impact and significant to horizontal movement due to earthquake.
Keyword
: soil mass movement, Plaxis program, sub drain system1 INTRODUCTION
The construction of Semarang-Solo toll road is one of the parts of Trans Java Toll Road System, with an objective to accelerate the connection between overall Trans Java toll roads. The Semarang–Solo toll begins from Tembalang village of Semarang city, passes through sub district of Bawen, the Regency of Salatiga, The Regency of Boyolali and ends in Kartosura (Solo), covering about 75,7 km distance. The topographic condition in the location consists of steep valleys with rivers and avoer, which are filled with water during the rainy season and dry during the dry season.
due to its effectiveness in dealing with the soil embankment mass movement.
The objectives of this study are to identify the causes of soil embankment mass movement and the influence of the sub drain system, as well as to simulate and analyze the Plaxis program in the use of sub drain system by decreasing the sub drain construction from the existing sub drain in 2 meters.
The boundaries of the problem in this study consisted of: Section II of Gedawang-Penggaron at Sta. 5+625 as the command area, the use of Plaxis 2D (plane strain) for analysis with soil material parameter input adjusted to field data, and secondary data of soil taken from Semarang-Solo toll road construction. The analysis was limited to the behavior of soil embankment mass movement using the sub drain system with no analysis on the behavior of bored pile.
2 LITERATURE STUDY AND THEORITICAL BACKGROUND
2.1 Soil Mass Movement
Soil movement is the shifting of slop composing materials such as rocks, embankments, soil or the mixture of them, which move downward and out of the slope (Varnes, 1978 in Soedradjat, 2008). Varnes (1978), Hutchincon (1988) in Rahardjo (2002) explained the classification of slope movement with consideration on the material type classified into five including falls, topples, slides, spreads, and flows.
2.2 Subsurface Drainage
Rahardjo, et al. (2012) in their researches use the horizontal drainage to decrease the water concentration due to rainwater infiltration and the slope surface. This will minimize the slope movement and gives contribution to the increasing stability of slope. One of the efforts is by making the slope to become water-unsaturated, which is by positioning a subsurface drainage system. The objective is to enable the drainage system to flow some of the water for the ground to absorb and to maintain water content in the slope from decreasing (Suryolelono, 2003). Model of a sub drain construction is as seen in Figure 1.
2.3 Finite Element Method and Plaxis Program
Bringkgreve (2007) explains that Plaxis program is a finite element program, developed to analyze the deformation and stability within the geotechnical area. The approach model can be either a plane strain or axi-symmetry (analysis on concentric axe). This
analysis uses the material model of elasto-plastic or known as Mohr-Coulomb.
Figure 1. Sub drain section. 3 RESEARCH METHOD
3.1 Research Area
The research area of this research was Semarang–Solo toll road with a problem of embankment slope stability on Sta. 5+625 area of Section II Gedawang-Penggaron Toll road, as seen in Figure 2.
Figure 2. The research area.
Measured data were taken from the field observation at 4 points: 2 points on BM-11 with ground water level at 3,5 m depth, and BM-10 with ground water level at 5,5 m, and 2 points on inclinometer (Incl-4, incl-5) positioning, as seen in Figure 3.
Figure 3. Measured data point.
Incl.4 BM.11 BM.1
0 Incl.5
3.2 Steps of the Research
The steps of this research were begun with validation following the simulation within various possible conditions after the toll road was operated. This included the influence of the load and water level surface (rainy and dry seasons), the effectiveness of sub drain system and the impacts of earthquakes.
According to FHWA (2003), the plan and load criteria that can be calculated included the 15 kPa traffic load added to the overall width of the embankment surface. However, in the traffic load simulation, 16 kPa was used in reference to several project reports of Semarang–Solo toll road construction.
The earthquake simulation was carried out based on the acceleration size which was relatively similar to the earthquake experienced by the surrounding command area, with maximum earthquake acceleration of Semarang area between 0.2 - 0.25 g. These can be seen in Figure 4.
Figure 4. The earthquake map of Indonesia(The Ministry of Public Work, 2010).
The earthquake data relevant to these values is the Upland, California in 1990 with earthquake peak acceleration of 0.24 g. The earthquake interval was inputted in the PLAXIS and 10 seconds were taken under the assumption that it passed through the peak acceleration.
4 NUMERICAL SIMULATION ANALYSIS
4.1 Results
In the result validation step, the relevancy was assumed to be quite representative to field inclinometer condition reading. The simulation was then continued to the bored embankment phase II
setting following with the embankment works up to finish. The followings are the soil parameters resulted from validation, as seen on Table 1 and the numerical validation results are presented on Figure 5.
Then, simulation was carried out following the possible toll road operation/service mass, which would enable the horizontal deformation comparisons based on inclinometer 4 on-field data to the simulation results. Figure 7 shows the horizontal deformation of various conditions or construction work.
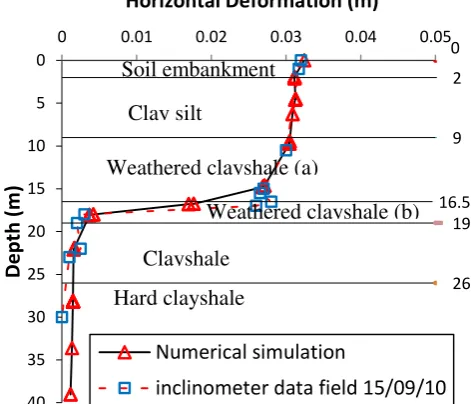
Figure 5. Numerical simulation results (validation) and inclinometer readings data 4.
5 DISCUSSIONS
This part discusses the behaviors of soil embankment mass movement or the horizontal deformation in each modeling phase. To observe the horizontal deformation occurred in the slope, a transverse section in three different points was made (see in Figure 6).
Figure 6. Transversal section of the embankment at Sta 5+6 0
2
9
26 16.5 19 0
5
10
15
20
25
30
35
40
0 0.01 0.02 0.03 0.04 0.05
Dep
th
(
m)
Horizontal Deformation (m)
Numerical simulation
inclinometer data field 15/09/10
Soil embankment
Clay silt
Weathered clayshale (a)
Clayshale
Hard clayshale
Weathered clayshale (b)
+ 265,97 m
+ 240,25 m
C
C B
A
Table 1. Soil parameters resulted from validation
No Name unsat sat kx ky nu Eref cref phi
[kN/m3] [kN/m3] [m/day] [m/day] [ - ] [kN/m2] [kN/m2] [ ° ]
1 Soil embankment 15 17 0,063 0,063 0,32 18800 74 14
2 Clay silt 15 17 0,631 0,631 0,33 58500 45 16
3 Weathered clayshale (a) 16 18 0,473 0,473 0,34 32300 31 17 4 Weathered clayshale (b) 16 18 0,788 0,788 0,34 2000 11 9
5 Clayshale 18 19 0,315 0,315 0,30 100000 185 27
6 Hard clayshale 18 19 0,032 0,032 0,30 510000 350 26
5.1 The influence of bored embankment reinforcement
Soil embankment mass reinforced by bored embankment would experience horizontal deformation from phase I to II in the sections of A-A = 0,085 m, B-B = 0,072 m and C-C = 0,102 m. After the embankment work was finished, increasing displacement occurred on section A-A = 0,079 m, uniformity to lateral direction.
5.2 The influence of traffic load
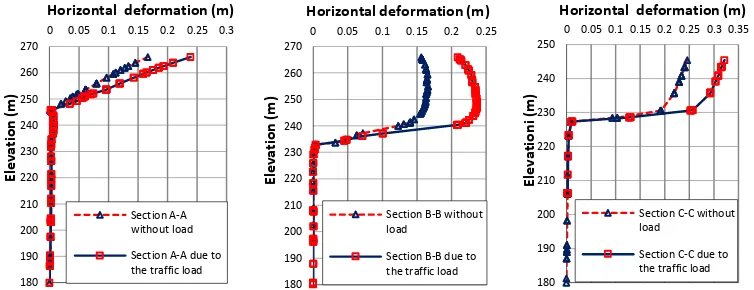
During the operation, the traffic load would increase more load to the slope. Such increase of pressure would make the soil to experience compressive strain enabling the soil to be compacted. In general, the movement of the slope was indicated on sections A-A, B-B, and C-C, moving in 0,239 m, 0,209 m, and 0,322 m, respectively with safety number of 1,369 (see Figure 9).
Figure 8. Horizontal deformation after the embankment is reinforced with bored pile up to when the embankment work is finished.
Figure 9. Horizontal deformations (with no load and with impacts of traffic load).
5.3 The influence of ground water surface
During the rainy season, the deformation became relatively larger than in dry season. Displacement of the section A-A, B-B and C-C shown in Figure 10 were 0,243 m, 0,214 and 0,324 m, respectively. The changing of the condition was between rainy and dry season with no significant difference. However the safety factor of the slope increased from 1,321 to 1,479.
5.4 The influence of Sub drain Construction
The existence of sub drain construction would give influence to the decreasing soil mass movement. It was indicated that the deformation decreased. When the existing sub drain was lowered in 2,0 m in average, the horizontal movement on the three sections would also decrease as depicted in Figure 11 (A-A, B-B, ad C-C sections of 0,173 m, 0,158 m and 0,245 m , respectively) with increasing safety number from 1,403 to 1,589.
Horizontal deformation (m)
Section A-A without load
Section A-A due to the traffic load
Section B-B due to the traffic load
Horizontal deformation (m)
Section C-C without load
5.5 The influence of Earthquake Load
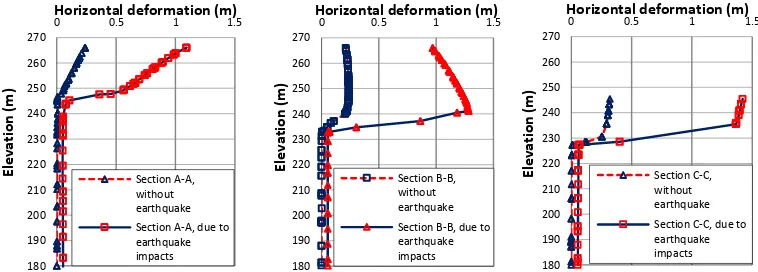
In general, the influence of earthquake load increased the deformation occurred to the slope. It was indicated that the horizontal movement occurred on section A-A was 0,853 m. However a relatively large displacement changing was experienced by section B-B, C-C, of 0,785 m and C-C = 1,100 m as shown in Figure 12, respectively with safety number from 1,368 to 1,193. The size of displacement indicated that the embankment slope was in plastic condition.
5.6 The Influence of embankment height decrease
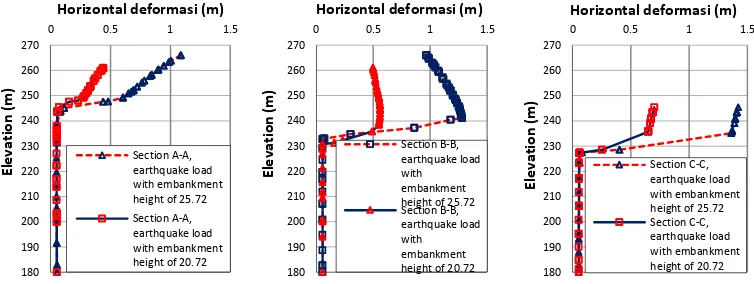
The objective of stability efforts was to reduce the load on the top of the embankment. Thus, the load above the slope would lessen the mass of the soil embankment to the bottom slope direction when earthquake occurred. It can be indicated from sections A-A, B-B and C-C that the horizontal movement can be reduced up to 50 % with safety number from 1,358 to 1,815 (see Figure 13).
Figure 10. Horizontal deformationof water surface during dry and rainy season.
Figure 11. Horizontal deformation (sub drain existing and sub drain was lowered).
Figure 13. The Impact of Earthquake Load (after the embankment height decreased).
6 CONCLUSIONS AND RECOMMENDATIONS
6.1 Conclusions
Some conclusions that can be drawn from the results are as follow:
a) The soil mass movement at Sta. 5+625 was caused by the impact of the layer experiencing weakening at 16,5 m from the surface with 2,5 m thickness.
b) The slope surface formed was the combination of translation slope and rotation and generally occurred on soil or rock experiencing decomposition.
c) Due to the traffic load, the embankment experienced horizontal deformation of 0,322 m with safety number of 1,368.
d) During the rainy and dry season, the horizontal deformations were 0,324 m and 0,320 m, respectively, indicating insignificant difference. However, the safety number increased from 1,321 to 1,479.
e) When existing sub drain construction was decreased in averagely 2,0 m, it would be very effective to reduce the horizontal deformation from 0,322 m to 0,254 m with safety number increased from 1,367 to 1,465.
f) The earthquake increased the horizontal deformation to 1,422 m from 0,322 m with safety number from 1,367 to 1,193.
g) The decrease of the embankment height from 25,72 m to 20,72 m described a significant deformation based on the earthquake load. Horizontal deformation was from 1,422 m to 0,703 m with safety factor from 1,193 to 1,567. This indicated increasing slope stability.
6.2 Recommendations
There are some recommendations which may be applied for further research:
a) It is required to develop a better method on Plaxis Program due to the limitations in modeling the sub drain to have a more representative sub drain simulation for in field model.
b) It is required to have more detailed analysis on the slope stability at the stationing points along the Sta. 5+500 to Sta. 6+000.
c) In the analysis of slope stability, it is required to take many trials and errors in the validation process in order to obtain results representing the real condition on field.
REFERENCES
Bringkgreve, J.B.R. (2007). Delft University of Technology & Plaxis, Delft University, Netherland.
FHWA. (2003). Soil Nail Walls, Geotechnical Engineering Circular, Federal Highway Administration, U.S. Department of Transportation, USA.
Rahardjo, H., Satyanaga, A., and Leong, E. C. (2012). “Unsaturated Soil Mechanics for Slope Stabilization, Geotechnical Engineering Journal of the SEAGS & AGSSEA”. Nanyang Technological University, Singapore, Vol. 43. ISSN 0046-5828.
Rahardjo, P.P. (2002). “Geotechnical risk and Forensic Investigation on avalanches”. Proceeding of National Seminar, Bandung, Indonesia.
Suryolelono, K.B. (2003). “Natural Disasters, Landslides, Geotechnical Sciences Perspective.” 180
height of 20.72 180