Internal pressure of liquids from the calorimetric measurements near the
critical point
Ilmutdin M. Abdulagatov
a,b,⁎
, Nikolai G. Polikhronidi
a, Rabiyat G. Batyrova
a aInstitute of Physics of the Dagestan Scientific Center of the Russian Academy of Sciences, Makhachkala, Dagestan, Russia
bThermophysical Properties Division, Geothermal Research Institute of the Russian Academy of Sciences, 39 A Shamil Ave., Makhachkala, Dagestan, 367030, Russia
a b s t r a c t
A new relation between the internal pressure and isochoric heat capacity jump of liquids along the coexistence curve near the critical point was found. Our previously reported one- and two-phase isochoric heat capacities and specific volumes at saturation were used to calculate internal pressure of molecular liquids (water, carbon dioxide, alcohols,n-alkanes, DEE,etc.).The internal pressure derived from the calorimetric measurements was compared with the values calculated from the reference (NIST, REFPROP) and crossover equations of state. Locus of the isothermal and isochoric internal pressure maxima and minima was studied using calorimetric data and the reference and crossover equations of state near the critical point. The maximum of the internal pressure of light and heavy water around the temperature of 460 K along the liquid saturation curve was found. We also found very simple relation between the internal pressure,ΔPintsat, and isochoric heat capacity,
ΔCV, jumps near the critical point.
© 2016 Elsevier B.V. All rights reserved. Keywords:
In liquids, cohesion is extremely important because the intermolecu-lar interaction is intense in liquid phase. The internal pressure provides the estimate of magnitude of cohesive forces. Cohesion (or intermolecular forces) creates a pressure within a liquid of value between 102to 103MPa.
For example, if the liquid compressed more, internal pressure decreases and becomes large and negative. This means that the repulsive forces become predominant. Internal pressure provides very useful information for understanding the nature of the intermolecular interaction and the structure of molecular liquids. For example, according to statistical mechanical definition the internal pressure is
Pint¼−2π
molecules separated by a distancer, whereϕA(r)is the smoothly varying
long-range attraction energy andϕR(r) is the steep short-range repulsion;
g(r) is the radial distribution function. Eq.(1)allows splitting the
repulsivePAand attractivePRcontributions of the total experimentally
observed internal pressure. Therefore, internal pressure is a very valuable thermodynamic quantity (instrument) to directly study intermolecular interactions through the macroscopic properties. Internal pressure is a part of the total pressure, which is caused by the intermolecular interac-tions,i.e., describes the effect of intermolecular interactions on the measuring total external pressure. The total measured external pressure and internal pressures are related as
Pint¼ ∂U
Internal pressure is important also in development equation of state of liquids for physically correct selection of the attractive and repulsive parts of the external pressure. The internal pressure is useful in under-standing the properties of the liquids and in the study of structural changes (internal structure), and ordered structure in binary mixtures. As follows from Eq.(2), the internal pressure describes the sensitivity of internal energyU(T,V) to a change in volume (isothermal expansion or compression) at isothermal condition,i.e., isothermal influence of volume on the intermolecular interaction energy.
2. Brief review of the internal pressure measurement methods
All of the available methods of internal pressure measurements can be divided into two groups: the calculation of the internal pressure from
⁎ Corresponding author at: Thermophysical Properties Division, Geothermal Research Institute of the Russian Academy of Sciences, 39 A Shamil Ave., Makhachkala, Dagestan 367030, Russia.
E-mail address:[email protected](I.M. Abdulagatov).
http://dx.doi.org/10.1016/j.molliq.2016.02.009 0167-7322/© 2016 Elsevier B.V. All rights reserved.
Contents lists available atScienceDirect
Journal of Molecular Liquids
Dack[1,2]and Barton[3]performed direct measurements of the derivative (∂P/∂T)Vfrom experimentally determined heat of vaporization
from the equation
Pint¼ ΔHvap−RTðρ=MÞ; ð4Þ
whereMis the molecular weight,ρis the density, andΔHvapis the
enthalpy of vaporization. This is a most frequently used method. Dack[1]used constant volume apparatus to determine the internal $ pressure of several liquids at 298 K. The uncertainty inPintdetermination in this method is about 2%. Grant-Taylor and Macdonald[4]determined thermal-pressure coefficient of acetonitrile + water mixture at tempera-tures between 298 and 328 K using 25 ml glass constant volume cell. The measuredP–Tisochores werefitted with the linear equation ofP=(∂P/ ∂T)VT+C. The derived values of (∂P/∂T)Vwere corrected for thefinite expansion and compression of glass. The measured values of (∂P/ ∂T)Vwere used to calculate the energy-volume (∂U/∂V)T(internal
pressure) coefficient and other thermodynamic quantities. The uncertainty of the derived values of (∂P/∂T)Vis 2%. Macdonald and Hyne[5]reported thermal-pressure and energy-volume coefficients measurements for dimethyl sulfoxide + water mixtures at tempera-tures between 286 and 328 K and at atmospheric pressure using the same technique. Westwater et al.[6]and Smith and Hildebrand[7]
directly measured (∂P/∂T)Vusing the constant-volume thermometer
apparatus. The liquid was confined to a glass bulb with a capillary neck in which its level may be maintained at afixed point by an electrical contact to a mercury interface. The coefficient (∂P/∂T)V
was found directly as the slope of a plot of pressure against temperature. McLure and Arruaga-Colina[8]reported thermal-pressure coefficient measurements for ethanenitrile, propanenitrile, and butanenitrile from 297 to 398 K. Measurements were made with an apparatus consisting of a constant-volume thermometer in which the pressure is controlled and measured for a series of temperatures at a series of different constant densities. McLure et al.[9]also measured the thermal-pressure coefficient for five dimethylsilioxane oligomers in the temperature range from 298 to 413 K. Thermal-pressure coefficients were measured in Pyrex cells (dilatometers). The sample was confined by mercury, and changes in its volume were monitored by weighing the amount of mercury expelled from or drawn into the dilatometer. Measured isochore slopes, (∂P/∂T)V, were corrected using the effect of
the thermal expansion and compression of both quartz and mercury. The uncertainty in thermal-pressure coefficient measurements is about 1.0%. Bianchi et al.[10]determined the internal pressure for carbon tetrachloride, benzene, and cyclohexane by direct measure-ments of (∂P/∂T)V. The measured values of (∂P/∂T)Vwere corrected
for thermal expansion and compressibility of the Pyrex cell. They studied temperature dependence ofPintfrom 293 to 333 K. Direct
measured values together with literature isobaric heat capacity data were used to calculated internal pressure using Eq.(3). Kumar et al.
[17]used measured ultrasonic velocity and density data to study inter-nal pressure of binary mixtures (acetone-CCl4and acetone-benzene).
The measured data were used to study of the molecular interactions in binary liquid mixtures. Vadamalar et al.[18]also used acoustic and viscometric parameters to accurately calculate the internal pressure for binary mixtures of tert-butanol and isobutanol with methyl methac-rylate. Sachdeva and Nanda[19]used measured ultrasonoic wave veloc-ity and densveloc-ity measurements of normal paraffins to calculate internal pressure. The acoustic method was used by Dzida[20]to calculate the internal pressure of cyclopentanol at pressures up to 100 MPa and at temperatures from 293 to 318 K. Allen et al.[25]also determined the internal pressure for some compounds using the speed of sound data.
2.3. Volumetric method
Verdier and Anderson [21] used indirect method to estimate the values of internal pressure of mixtures, using thermal expansivity (determined by microcalorimeter) and isothermal compressibility (determined by density measurements). Korolev[22]studied internal pressure of alcohols using the values of volumetric coefficient (thermal expansion and isothermal compressibility coefficients). Shukla et al.
[23]studied the internal-pressure coefficient and its correlation with solubility and pseudo-Gruneisen parameters for binary and multicom-ponent liquid mixtures over a wide range of concentration at 298 K using the measured values of viscosity, density, and ultrasonic velocity. Singh and Kumar[24]measured density, speed of sound, and refraction index of IL [C8mim][Cl], [C4mim][C1PSO3], and [C4mim][C8OSO3] over the temperature range from 283 to 343 K. The measured density and speed of sound data were used to calculate the internal pressure from relation (3) where thermal expansion coefficient and isothermal compressibility were calculated using the measured values of density and speed of sound. Piekarski et al.[26]reported density, heat capacity, and speed of sound data for binary acetonitrile + 2-methoxyethanol mixture at 298.15 K in the whole composition range. The measured data were used to calculate the internal pressure of the mixture using relation(3). Almost linear dependence of the internal pressure as a function of concentration was observed. Kannappan et al.[27]
measured the speed of sound, density, and viscosity of ternary mixture of alcohols with DMF and cyclohexane at three temperatures 303, 308, and 313 K. The measured data were used to calculate excess internal pressure.
2.4. Determination of the internal pressure from calorimetric measurements
coefficient, (∂P/∂T)V, external pressure,P, and heat capacity,CV. This method provides accurate measurements of the total external pressures,
P, and the temperature derivatives, (∂P/∂T)V, therefore and internal
pressure using Eq.(2). Thus, in the same apparatus, we can simulta-neously measure the temperature derivatives of the internal energy (energy-temperature coefficient), (∂U/∂T)V=CV, isochoric heat
capac-ity and the volume derivatives of the internal energy (energy-volume coefficient), (∂U/∂V)T=Pint,i.e., the internal pressure. The experimental details have been described previously in publications[28–31]. Only es-sential information will be given briefly here. The direct measurements of the thermal-pressure coefficient, (∂P/∂T)V, were performed using the high-temperature and high-pressure nearly constant-volume adiabatic piezo-calorimeter. The pressure (P) and temperature derivatives of the pressure at constant volume,(∂P/∂T)V, were measured with a calibrated pressure transducer. The synchronously recording both temperature changes (thermograms, T−τ, reading of the resistance platinum
thermometer PRT) and pressure changes (barograms,P−τ, readings of the tenzotransducer) was performed with a strip-chart recorders. Using the records of the thermo-barograms (T−τ andP−τ) the changes in temperatureΔTand in pressuresΔP, therefore, the derivative (∂P/∂T)V= lim
ΔT→0
ðΔP=ΔTÞV, at anyfixed time can be calculated. This
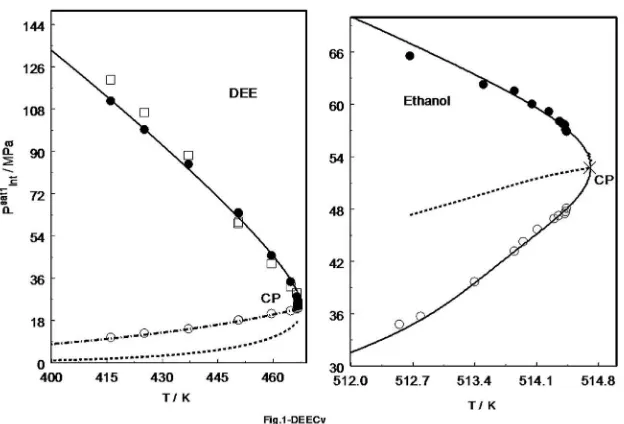
technique was successfully applied for various molecular fluids andfluid mixtures such as DEE, water + ammonia, and carbon dioxide + n-decane[31,63,64]. The measured thermal-pressure coefficient and internal pressure data for DEE, as an example, are depicted inFig. 1.
Therefore, simultaneously measured values ofCV= (∂U/∂T)Vand
thermal-pressure coefficient, (∂P/∂T)V, together withPVTmeasurement
in the same experiment can be used[52]to determine the values of in-ternal pressure using relation(2). The uncertainties of temperature
ΔTand in pressureΔPchange measurements are much more accurate
Fig. 1.Measured thermal-pressure coefficient (left) and internal pressure (right) of DEE as a function of temperature near the critical point including saturation curve[63].
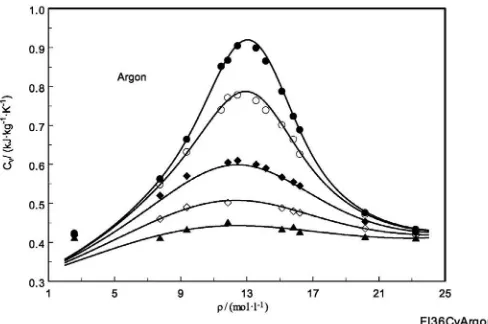
Fig. 2.Measured and calculated isochoric heat capacities of argon as a function of density in the supercritical region. Symbols are reported by Anisimov et al.[54,55]; solid lines are calculated from Tegeler et al.[56].
than the measurements of their absolute values (TandP). Therefore, the uncertainty in (∂P/∂T)Vmeasurements is within 0.12% to 1.5%
depend-ing on the temperature increment (ΔTchanges within 0.02 to 0.10 K). The expanded uncertainty of the isochoric heat-capacity measurements at the 95% confidence level with a coverage factor ofk= 2 is estimated to be (2 to 3) % in the near-critical and supercritical regions, (1.0 to 1.5) % in the liquid phase, and (3 to 4) % in the vapor phase. Uncertainties of the density and temperature measurements are estimated to be 0.05% and 15 mK, respectively.
3. Internal pressure and one- and two-phase isochoric heat capacities
3.1. One-phase isochoric heat capacity and internal pressure
The internal pressure, (∂U/∂V)T=Pint, and isochoric heat capacity,
(∂U/∂T)V=CV,i.e., volume and temperature derivatives of the internal
energyU(T,V), describes the sensitivity of internal energy to a change in specific volumeVand temperatureTat the isothermal and isochoric processes, respectively. Therefore, direct simultaneous measurements
ofPint(T,V)=(∂U/∂V)TandCV(T,V)=(∂U/∂T)V, (see aboveSection 2.4)
provides the caloric equation of stateU(T,V),
dU¼PintðT;VÞdVþCVðT;VÞdT; ð5Þ
or the internal pressure can be expressed as
PintðT;VÞ ¼ðdU=dVÞ−CVðT;VÞðdT=dVÞ;
which is significantly accurate than thermalP(T,V) equation of state. Thus, the total differential of internal energy defines throughPintandCV
(see Eq.5), which are can be measured in the same experiment as de-scribed above inSection 2.4. The caloric equation of state can be derived directly by integrating relation(5).
Fig. 4.Measured and calculated isochoric heat capacities of light water as a function of density in the critical and supercritical regions. Symbols are reported by Abdulagatov et al.[65,66]; dashed lines are calculated from the crossover model[41].
Fig. 5.Measured and calculated isochoric heat capacities of heavy water as a function of density in the critical and supercritical regions. Symbols are reported by Polikhronidi et al.[49]; solid lines are calculated from crossover model[42]; dashed line is the isothermalCVmaximum loci.
Fig. 6.Second temperature derivative of external pressure (orfirst temperature derivative of the internal pressure, (∂Pint/∂T)V) as a function of density along the near- and
supercritical isotherms of pure water calculated from crossover equation of state[41]. Symbols are derived from direct isochoric heat capacity measurements[65,66,72].
Fig. 7.Calculated from crossover equation of state[62]values ofð∂Pint
∂TÞVfor carbon dioxide
The temperature derivate of the internal pressure (internal thermal-pressure coefficient) can be calculated directly from Eq.(2)as
∂Pint
As one can be noted, the measured internal pressure as a function of temperature is providing information of second temperature derivative (curvature) of the real external pressure properties of the liquids,ð∂2P
∂T2ÞV
or isothermal specific volume behavior of the isochoric heat capacity,
ð∂CV
∂VÞT. As well-known (see, for example[32–39]), the isochoric heat
capacity exhibits isothermal maximum in the near- and supercritical regions (along the near- and supercritical isotherms, seeFigs. 2–5) and isothermal minimum[33,36]at high densities (≈2ρC), where
(∂CV/∂V)T= 0. The density dependence ofð∂
along the near-critical isotherms for pure H2O and CO2calculated
from the crossover model together with the values derived from
CVmeasurements is depicted inFigs. 6 and 7. The values ofð∂Pint ∂TÞV
calculated from the crossover model for light water along the various near-critical isobars are depicted inFig. 8. Therefore, the locus of iso-thermal extreme ofCV(or inflection point of the P–Tisochores, where (∂2P/∂T2)
V= 0) is determined by the isochoric temperature
extreme of the internal pressure,i.e., (∂Pint/∂T)V= 0. The locus of isochoric temperature maximum and minimum of the internal pressure or isothermal extreme ofCVfor some selected molecular liquids inρ−T
andP−Tprojection is shown inFigs. 9 and 10. The isothermal maxima and minima loci ofCVand isochoric maxima and minimums of the inter-nal pressure Pintare associated with the inflection points in P–T
isochores where (∂2P/∂T2)
V= 0 (see Fig. 9). The curvature of P–T
isochores is positive within the isochore inflection curve and negative outside (seeFigs. 6 and 7). AsFigs. 5 and 8show, the isothermalCV max-ima or isochoric temperature maxmax-ima ofPintcurves in the supercritical region are not exactly at the critical isochore. The isothermalCVmaxima curve in the supercritical region starts at the critical point and runs along a density minimum (ρmin≈0.95ρC) to higher temperatures (see Fig. 5). This curve intersects twice with the critical isochore, namely at
T=TCand approximatelyT= 1.1TC. Abdulagatov et al.[32]reported a
detail discussion of the loci of isochoric heat capacity maxima and minima behavior for molecular liquids along the supercritical isotherms. The locus of isochoric heat capacity or internal pressure extreme as it also is the locus along whichP–Tisochores have an inflection, (∂2P/ ∂T2)
V=0 is one of the important characteristic curves of thePVTsurface.
The analysis of the extremum properties of isochoric heat capacity and the internal pressure is one way to study the qualitative behavior of the thermodynamic surface offluids, especially near the critical point where thePVTsurface shows anomalous behavior. Comparison experimental
CVandPintextreme with calculations is a stringent test of the accuracy and reliability of the equation of state. Loci ofCVextreme are very sensi-tive to the structure of an equation of state and the molecular structure
Fig. 8.Temperature dependence of the derivativeð∂Pint
∂TÞVfor pure water along the
near-critical and supernear-critical isobars calculated from crossover model[41].
Fig. 9.IsothermalCVmaximum and minimum loci (or isochoric temperature maximum and minimum of the internal pressure) of water and carbon dioxide calculated from crossover equation of state[41,62].Dashed lines are isothermal maximum (CA) and minimum (AB) ofCVand isochoric maximum and minimum of the internal pressure, where (∂Pint/∂T)V=
offluids; therefore, they can be used to test the quality of the equation of state and molecular theory of thermodynamic property.Figs. 11 and 12
are demonstrate temperature behavior of the internal pressure of CO2,
H2O, C3H8, and n-C5H12calculated from crossover equation of state[41,
62,67]along the various liquid and vapor isochores near the coexistence curve. As one can see from Figs. 11 and 12 the crossover model correctly represented scaling behavior of theCVnear the critical and the supercritical regions and temperature behavior of the internal pressure. (SeeFig. 9.)
3.2. Two-phase isochoric heat capacity and internal pressure
Two-phase isochoric heat capacity also directly related with the internal pressure along the saturation curve. The Yang and Yang[47]
relation for two-phase isochoric heat capacity is
CV2¼−Td 2
μ
dT2þVT
d2PS
dT2; ð8Þ
where second temperature derivative of chemical potential,dd2μ
T2, and
vapor pressure,d2PS
dT2, are function of temperature only. By integrating
relation(8), using the Eq.(9)
CV2¼ ∂U2 ∂T
V
ð9Þ
we can derive the Yang and Yang caloric equation of state for two-phase system as
ΔU2¼−
ZT
T0 Td
2
μ
dT2dTþV
ZT
T0 Td
2 PS
dT2dT; ð10Þ
whereΔU2=U(T)−U(T0) and the second temperature derivatives of
chemical potential,d2μ
dT2, and vapor–pressure, d2P
S
dT2, can be directly calculated
from two-phase isochoric heat capacity measurements as a function
Fig. 10.Isothermal maxima and minima loci ofCVforn-pentane calculated from crossover model[67]inT−ρandP−Tplanes. CB-isothermalCVmaxima loci; BD-isothermalCVminima loci.
of temperature or using measured values of saturated properties (TS,V',C'V2,V' ',C' 'V2)[43,48,49]as
d2PS
dT2 ¼ C″
V2−C0V2 T V ″−V0and
d2μ
dT2¼ V″C0
V2−V0C″V2
T V 0−V″ : ð11Þ
Internal pressure from the Yang and Yang two-phase caloric equa-tion state (Eq.(10)) is
Psatint2¼ ∂ΔU2
∂V
T
¼
ZT
T0 Td
2 PS
dT2dT¼T dPS
dT −PS ð12Þ
Thus, from caloric equation of state (Eq.(10)), based on Yang–Yang two-phase isochoric heat capacity Eq.(8), we derived the equation for internal pressure along the vapor–pressure curve, Eq.(12), through the slope of the vapor–pressure curvedPS
dT. Relation(12)is the definition
of the internal pressure through the vapor–pressure equation by analo-gy to equation of state Eq.(2)for one-phase region.
Therefore, as follows from Eq.(12), the internal pressure at satura-tion can be directly calculated from two-phase isochoric heat capacity measurements at saturation as
Psatint2¼
Z T
T0 C00
V2−C0V2
V00−V0 dT: ð13Þ
Fig. 12.Detailed view of the internal pressure of propane andn-pentane as a function of temperature along the critical, liquid, and vapor isochores in the immediate vicinity of the coex-istence curve together with the values ofPintalong the vapor–pressure curve (dashed-dotted line). Dashed and solid lines are the vapor and liquid internal pressures along the coexistence curve, respectively, calculated from crossover model[62,67].
As follows from Eq.(12), thefirst temperature derivative of the in-ternal pressure at saturation diverge at the critical point as
dPsat2 int dT ¼T
d2PS
dT2
∝t−α ð14Þ
or
dPsatint2 dT ¼
C″V2−C
0
V2 V″−V0
: ð15Þ
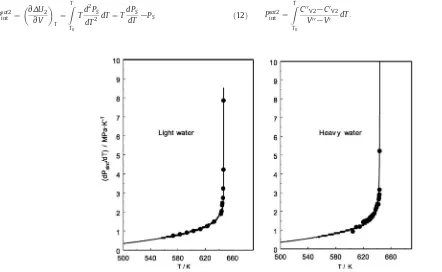
The slope of the saturated internal pressure equationPsint-Tdirectly related with the two-phase isochoric heat capacity difference (CV2″ −CV2′)
between the vapor (CV2″ ) and the liquid (CV2′) heat capacities at saturation.
Eqs.(14)and (15) are the analogy of the Eqs.(6) and (7)forð∂Pint ∂TÞVin the
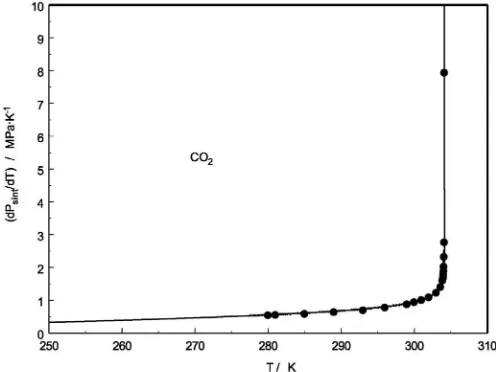
one-phase region.Figs. 13 to 15demonstrate the comparison between
the values ofdPsint
dT derived from the direct isochoric heat capacity
measurements and calculated from the vapor–pressure data for some selected very well studied liquids and gasses.
As follows from well-known thermodynamic relation (Abdulagatov et al.[50–52], Polikhronidi et al.[53]) the one-phase partial temperature derivative (thermal-pressure coefficient) of pressure at saturation is
∂P
∂T
sat
V ¼dPS
dT þ
1
T dT
dVΔCV; ð16Þ
or
T ∂∂P T
sat
V ¼TdPS
dT þ dT
dVΔCV; ð17Þ
whereð∂P ∂TÞ
sat
V one-phase partial temperature derivative of external
pressure at saturation (or initial slope of theP–Tcurves (isochores) at saturation curve; dPS
dT is the slope of the two-phase saturation
Fig. 14.Temperature derivatives of the internal pressure along the vapor–pressure saturation curve directly derived from calorimetric measurements[58–61](Eq.15) together with the values calculated from vapor pressure equation (REFPROP[46]) for carbon dioxide.
Fig. 15.Temperature derivatives of the internal pressure along the vapor–pressure saturation curve directly derived from calorimetric measurements[50,51,70,71](Eq.15) together with the values calculated from vapor pressure equation (REFPROP[46]) forn -alkanes.
Fig. 16.MeasuredΔPintsatversesΔ
CVplot for DEE. Solid line is calculated from experimental coexistence curve (V–T) data.
Fig. 18.a–c. Internal pressure of propane (a),n-pentane (b), andn-hexane (c) at the liquid and vapor one-phase saturation curve derived from isochoric heat capacity measurements to-gether with the values calculated (solid and dashed lines) from reference equation of state (REFPROP[46]). Dashed-dotted lines are the internal pressure along the two-phase vapor– pres-sure curve. CP-the critical point. The symbols are derived from calorimetric meapres-surements[50,51,70](Eq.15).
curve (vapor–pressure curve);dT
dVis the temperature derivative of the
specific volume at saturation curve; andΔCV=CV2−CV1isochoric heat capacity jump at the saturation. As follows from Eq.(17), the internal pressure in the one-phase region at the saturation is
Psatint1¼P
sat2 int þ
dT
dVΔCV ð18Þ
or
Psat1 int ¼
ZT
T0 C00
V2−C0V2 V00−V0 dTþ
dT
dVΔCV;i:e: ; ; ;C
0V2”to; ;C0
V2”: ð19Þ
As one can see fromEq. (18), the internal pressure at saturation in the one-phase (liquid and vapor) regionPintsat1defined from two-phase internal pressurePsint(Eq.(13)) and isochoric heat capacity jumpΔCV
or only liquid (C'V2) and vapor (C"V2) two-phase heat capacities and
ΔCV(Eq.(19)). As was mentioned above (Section 2.4) the saturated liquid (V') and vapor (V' ') specific volumes can be accurately measured in the same calorimetric experiment. Other words, the internal pressure
jump,ΔPintsat=Pintsat1-Pintsat2, when the phase transition curve is crossing can
be calculated as
ΔPsatint¼ dT
dVΔCV; ð20Þ
i.e., completely defined by two-phase through the isochoric heat capacity jump at saturationΔCV, and the slope of the coexistence curve,dT
dV. Thus, the internal pressure jump at the saturationΔPint satis
the linear function of isochoric heat capacity jump at saturation
ΔCVwhere the slope is defined as a coexistence curve temperature derivative,dT
dV.Fig. 16shows the plot of measuredΔPint
satverses of
ΔCVfor DEE. Thisfigure also contains the values ofΔPintsatas a function
ofΔCVderived using the calculated values ofdT
dVfrom equation of state
(REFPROP[46]). As one can note, the agreement is good, which is
con-firm the thermodynamic consistency of our previous calorimetric (ΔCV) and thermal,(dT/dV), (∂P/∂T)Vsat, and (dPS/dT) measurements at saturation. The values of one liquid and vapor one-phase saturated in-ternal pressure,Pintsat1, and difference (or jump)
ΔPintsat, calculated from
our previous measured isochoric heat capacity data for some selected
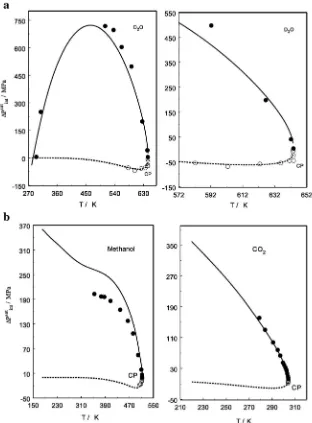
Fig. 20.a,b. Internal pressure jumps of heavy water (a), methanol (b, left) and CO2(b, right) at the liquid (solid lines) and vapor (dashed liens) one-phase saturation curve derived from
molecular liquids and gasses are presented inFigs. 17 to 20. The values ofPintsat2
can be calculated directly from two-phase isochoric heat capaci-ties (Eq.(13)). As follows from Eq.(20), near the critical point internal pressure jumpΔPintsatbehave as∝t1−α−β. The derived from the
calori-metric measurements values of liquid and vapor saturatedΔPintsatas a
function of temperature near the critical point for heavy water, metha-nol, and carbon dioxide as an example shown inFig. 20a,b. For vapor phase the values ofΔPintsatwas calculated as
ΔPint"sat=dT dV}ΔC}V.
In addition, another useful relation for the vapor–pressure equation can be presented through the two-phase internal pressure as
PS¼ðCS−CV2ÞdT dV−P
sat2
int ; ð21Þ
whereCSis the saturated heat capacity.
4. Conclusions
A new method of calculation of the internal pressure of molecular
fluids based on the calorimetric (one- and two-isochoric heat capacity) measurements near the critical and supercritical regions have been proposed. Previously reported one- and two-phase isochoric heat capacities and specific volumes at saturation were used to calculate internal pressure of molecular liquids (water, carbon dioxide, alcohols,
n-alkanes, DEE,etc.). The results were compared with the values calcu-lated from the reference and crossover equations of states. We demon-strated good agreement between the calorimetric method of calculation of the internal pressure and direct method of calculation from the ther-mal equation of state. We also showed that the isotherther-malCVextreme is the isochoric temperature extreme of the internal pressure. Using our previously publishedCVdata we studied locus of theCVmaxima and minima (or isochoric internal pressure extreme) for various molecular
fluids. For light and heavy water we found temperature maximum of the internal pressure at the saturation curve around 460 K. Based on our previous isochoric heat capacity measurements we have calculated internal pressure of molecularfluids at saturation curve near the critical point. These data were compared with the values directly calculated from reference and crossover equations of state. The temperature deriv-ative of the internal pressuredPintsat/dTat saturation was directly calculat-ed from the measurcalculat-ed two-phase isochoric heat capacity measurements at saturation. It was illustrate that (dPintsat/dT) and (∂Pint/∂T)
Vhave the
same singularity at the critical point as the second temperature deriva-tives of (d2PS/dT2) and (∂2P/∂T2)V.We found a very simple relation
between the internal pressure,ΔPintsat, and isochoric heat capacity,
ΔCV, jumps,ΔPintsat=dT
dVΔCV.
Acknowledgments
This work was supported by a Russian Foundation of Basic Research (RFBR) grants NHK13-08-00114/15 and 15-08-01030. The authors thank Dr. Magee for his interest to the work and useful discussion.
References
[1] M.R.J. Dack, Aust. J. Chem. 28 (1975) 1643–1648. [2] M.R.J. Dack, Chem. Soc. Rev. 7 (1975) 731-. [3] A.F.M. Barton, J. Chem. Educ. 48 (1971) 152–162.
[4] D.F. Grant-Taylor, D.D. Macdonald, Can. J. Chem. 54 (1976) 2813–2819. [5] D.D. Macdonald, J.B. Hyne, Cand. J. Chem. 49 (1971) 611–617.
[6] W. Westwater, H.W. Frantz, J.H. Hildebrand, Phys. Rev. 31 (1928) 135–143. [7] E.B. Smith, J.H. Hildebrand, J. Chem. Phys. 31 (1959) 145–157.
[8] I.A. McLure, J.I. Arriaga-Colina, Int. J. Thermophys. 5 (1984) 291–300. [9] I.A. McLure, A. Pretty, P.A. Sadler, J. Chem. Eng. Data 22 (1977) 372–376. [10] U. Bianchi, G. Agabio, A. Turturro, J. Phys. Chem. 69 (1965) 4392. [11] G.A. Few, M. Rigby, J. Phys. Chem. 79 (1975) 1543.
[12] E. Zorębski, Mol. Quant. Acoust. 27 (2006) 327–335. [13] A. Kumar, J. Sol. Chem. 37 (2008) 203–214.
[14] E. Zorębski, internal pressure in liquids and binary mixtures, J. Mol. liq. 149 (2009) 52–54.
[15] E. Zorębski, M. Geppert-Rybczyńska, J. Chem. Thermodyn. 42 (2010) 409–418. [16] E. Zorębski, Mol. Quant. Acoust. 28 (2007) 319–327.
[17] R. Kumar, S. Jayakumar, V. Kannappan, Ind. J. Pure Appl. Phys. 46 (2008) 169–175.
[18] R. Vadamalar, P. Mani, R. Balakrishnan, V. Arumugam, E-J. Chem. 6 (2009) 261–269.
[19] V.K. Sachdeva, V.S. Nanda, Ultrasonic wave velocity in some normal parafins, J. Chem. Phys. 75 (1981) 4745–4746.
[20] M. Dzida, Acta Phys. Pol. A. 114 (2008) 75–80.
[21] S. Verdier, S.I. Anderson, Fluid Phase Equilib. 231 (2005) 125–137. [22] V.P. Korolev, Russ. J. Struct. Chem. 48 (2007) 573–577.
[23] R.K. Shukla, S.K. Shukla, V.K. Pandey, P. Awasthi, J. Mol. Liq. 137 (2008) 104–109. [24] T. Singh, A. Kumar, J. Sol. Chem. 38 (2009) 1043–1053.
[25] G. Allen, G. Gee, G. Wilson, J. Polym. 1 (1960) 456–466.
[26] H. Piekarski, A. Piekarska, K. Kubalczyk, J. Chem. Thermodyn. 43 (2011) 1375–1380. [27] A.N. Kannappan, S. Thirumaran, R. Palani, J. Phys. Sci. 97 (2009) 97–108. [28] N.G. Polikhronidi, I.M. Abdulagatov, R.G. Batyrova, G.V. Stepanov, Int. J. Thermophys.
30 (2009) 737–781.
[29]N.G. Polikhronidi, I.M. Abdulagatov, R.G. Batyrova, G.V. Stepanov, Int. J. Refrig. 32 (2009) 1897–1913.
[30] N.G. Polikhronidi, R.G. Batyrova, I.M. Abdulagatov, J.W. Magee, J.T. Wu, Phys. Chem. Liq. 52 (2014) 657–679.
[31] N.G. Polikhronidi, I.M. Abdulagatov, R.G. Batyrova, G.V. Stepanov, Bull. S. Petersburg Univ. 1 (2013) 154–186.
[32] A.I. Abdulagatov, G.V. Stepanov, I.M. Abdulagatov, A.E. Ramazanova, G.A. Alisultanova, Chem. Eng. Commun. 190 (2003) 1499–1520.
[33] D.E. Diller, Cryogenics 11 (1971) 186–191.
[34] J.W. Magee, Kaboyashi R., Proc. 8th Symp. Thermophys. Prop. in: J.V. Sengers (Ed.), Thermophysical Properties of Fluids, Vol. 1, ASME, New York 1982, pp. 321–325. [35] E.M. Gaddy, J.A. White, Phys. Rev. A 26 (1982) 2218–2226.
[36] C. Gladun, Cryogenics 11 (1971) 205–209.
[37] F. Theeuwes, R.J. Bearman, J. Chem. Thermodyn. 2 (1970) 513–521. [38] J. Stephenson, Can. J. Phys. 54 (1976) 1282–1291.
[39] R.J. Bearman, F. Theeuwes, M.Y. Bearman, F. Mandel, G.J. Throop, J. Chem. Phys. 52 (1970) 5486–5487.
[41] S.B. Kiselev, D.G. Friend, Fluid Phase Equilib. 155 (1999) 33.
[42] S.B. Kiselev, I.M. Abdulagatov, A.H. Harvey, Int. J. Thermophys. 20 (1999) 563–588. [43]I.M. Abdulagatov, S.B. Kiselev, J.F. Ely, N.G. Polikhronidi, A.A. Abdurashidova., Int. J.
Thermophys. 26 (2005) 1327–1367.
[46]E.W. Lemmon, M.L. Huber, M.O. McLinden, NIST Standard Reference Database 23, NIST Reference Fluid Thermodynamic and Transport Properties, REFPROP, Version 9.0, Stan-dard Reference Data Program, National Institute of StanStan-dards and Technology, Gai-thersburg, MD, 2010.
[47] C.N. Yang, C.P. Yang, Phys. Rev. Lett. 13 (1969) 303–305.
[48]I.M. Abdulagatov, N.G. Polikhronidi, T.J. Bruno, R.G. Batyrova, G.V. Stepanov, Fluid Phase Equilib. 263 (2008) 71–84.
[49]N.G. Polikhronidi, I.M. Abdulagatov, J.W. Magee, G.V. Stepanov, Int. J. Thermophys. 22 (2001) 189–200.
[50] I.M. Abdulagatov, L.N. Levina, Z.R. Zakaryaev, O.N. Mamchenkova, J. Chem. Thermodyn. 27 (1995) 1385–1406.
[51] I.M. Abdulagatov, L.N. Levina, Z.R. Zakaryaev, O.N. Mamchenkova, Fluid Phase Equilib. 127 (1997) 205–236.
[52]A.I. Abdulagatov, G.V. Stepanov, I.M. Abdulagatov, Fluid Phase Equilib. 209 (2003) 55–79.
[53] N.G. Polikhronidi, I.M. Abdulagatov, R.G. Batyrova, G.V. Stepanov, Ustuzhanin EE, Wu J., Intl. J. Thermophys. 32 (2011) 559–595.
[54] M.A. Anisimov, B.A. Kovalchuk, V.A. Rabinovich, V.A. Smirnov, Thermophysical prop-erties of substances and materials, GSSSD, Moscow 8 (1975) 237–245.
[55] M.A. Anisimov, B.A. Kovalchuk, V.A. Rabinovich, V.A. Smirnov, Thermophysical prop-erties of substances and materials. GSSSD, Moscow 12 (1978) 86–106.
[56] C. Tegeler, R. Span, W. Wagner, J. Phys. Chem. Ref. Data 28 (1999) 779. [57]I.M. Abdulagatov, N.G. Polikhronidi, R.G. Batyrova, J. Chem. Thermodyn. 26 (1994)
1031–1045.
[58]I.M. Abdulagatov, N.G. Polikhronidi, R.G. Batyrova, Ber. Bunsenges. Phys. Chem. 98 (1994) 1068–1072.
[59]Kh.I. Amirkhanov, N.G. Polikhronidi, R.G. Batyrova, Teploenergetika 17 (1971) 70–72. [60] Kh.I. Amirkhanov, N.G. Polikhronidi, B.G. Alibekov, R.G. Batyrova, Teploenergetika 18
(1971) 59–62.
[61] Kh.I. Amirkhanov, N.G. Polikhronidi, B.G. Alibekov, R.G. Batyrova, Teploenergetika 1 (1972) 61–63.
[62] S.B. Kiselev, J.C. Rainwater, Fluid Phase Equilib. 141 (1997) 129–154.
[63]N.G. Polikhronidi, Batyrova R.G., Abdulagatov I.M., Stepanov G.V., J. T.Wu, J. Chem. Thermodyn 53 (2012) 67–81.
[64] N.G. Polikhronidi, I.M. Abdulagatov, R.G. Batyrova, G.V. Stepanov, Fluid Phase Equilib. 292 (2010) 48–57.
[65]I.M. Abdulagatov, V.I. Dvoryanchikov, A.N. Kamalov, J. Chem, Eng. Data 43 (1998) 830–838.
[66] I.M. Abdulagatov, B.A. Mursalov, N.M. Gamzatov, in: H. White, J.V. Sengers, D.B.Neumann, J.C. Bellows (Eds.), Proc. 12th Int. Con. Proper. Water and Steam, Begell House, New York 1995, pp. 94–102.
[67] I.M. Abdulagatov, A.R. Bazaev, J.W. Magee, S.B. Kiselev, J.F. Ely, Ind. Eng. Chem. Res. 44 (2005) 1967–1984.
[68] B.A. Mursalov, I.M. Abdulagatov, V.I. Dvoryanchikov, A.N. Kamalov, S.B. Kiselev, Int. J. Thermophys. 20 (1999) 1497–1528.
![Fig. 6. Second temperature derivative of external pressure (orof the internal pressure, ( first temperature derivative∂Pint/∂T)V) as a function of density along the near- andsupercritical isotherms of pure water calculated from crossover equation of state [41].Symbols are derived from direct isochoric heat capacity measurements [65,66,72].](https://thumb-ap.123doks.com/thumbv2/123dok/2792259.1685714/4.595.43.290.517.701/temperature-derivative-temperature-derivative-andsupercritical-isotherms-calculated-measurements.webp)
![Fig. 9. Isothermal( CVmaximum and minimum loci (or isochoric temperature maximum and minimum of the internal pressure) of water and carbon dioxide calculated from crossoverequation of state [41,62].Dashed lines are isothermal maximum (CA) and minimum (AB) of CVand isochoric maximum and minimum of the internal pressure, where (∂Pint/∂T)V=∂CV/∂V)T=0.](https://thumb-ap.123doks.com/thumbv2/123dok/2792259.1685714/5.595.138.449.491.709/isothermal-cvmaximum-isochoric-temperature-calculated-crossoverequation-isothermal-isochoric.webp)
![Fig. 11. Internal pressure of carbon dioxide and light water as a function of temperature along the various liquid and vapor isochores near the phase transition curve calculated from thecrossover equation of state [41,62]](https://thumb-ap.123doks.com/thumbv2/123dok/2792259.1685714/6.595.147.461.53.243/internal-pressure-temperature-isochores-transition-calculated-thecrossover-equation.webp)