SERVICES
FOREWORD . . . xxxv
INTRODUCTION . . . xxxvii
⊲ PART I
GETTING STARTED
CHAPTER 1 Introducing Reporting Services . . . 3CHAPTER 2 Reporting Services Installation and Architecture . . . 23
CHAPTER 3 Confi guring SharePoint Integration . . . 69
⊲ PART II
REPORT DESIGN
CHAPTER 4 Basic Report Design . . . 95CHAPTER 5 Report Layout and Formatting . . . 123
CHAPTER 6 Designing Data Access . . . 143
CHAPTER 7 Advanced Report Design . . . 189
CHAPTER 8 Chart Reports . . . 229
⊲ PART III BUSINESS INTELLIGENCE REPORTING
CHAPTER 9 BI Semantic Models . . . 251CHAPTER 10 Reporting with Analysis Services . . . 263
CHAPTER 11 OLAP Reporting Advanced Techniques . . . 295
⊲ PART IV ENABLING USER REPORTING
CHAPTER 12 Tabular Models . . . 349CHAPTER 13 Visual Analytics with Power View . . . 373
⊲ PART VI ADMINISTERING REPORTING SERVICES
CHAPTER 17 Content Management . . . 525
CHAPTER 18 Integrating Reports with SharePoint . . . 559
CHAPTER 19 Native Mode Server Administration . . . 581
⊲ PART VII REPORTING SERVICES CUSTOM PROGRAMMING
CHAPTER 20 Integrating Reports into Custom Applications . . . 619CHAPTER 21 Using Embedded and Referenced Code . . . 681
CHAPTER 22 Extending Reporting Services . . . 697
⊲ PART VIII APPENDIXES
APPENDIX A T-SQL Commands, Clauses, and Predicates . . . 758APPENDIX B T-SQL System Variables and Functions . . . 779
APPENDIX C MDX Reference . . . 803
Reporting Services
Paul Turley,
Robert M. Bruckner,
Thiago Silva,
Indianapolis, IN 46256
www.wiley.com
Copyright © 2012 by John Wiley & Sons, Inc., Indianapolis, Indiana
Published simultaneously in Canada
ISBN: 978-1-118-10111-7
ISBN: 978-1-118-22379-6 (ebk)
ISBN: 978-1-118-23713-7 (ebk)
ISBN: 978-1-118-26210-8 (ebk)
Manufactured in the United States of America
10 9 8 7 6 5 4 3 2 1
No part of this publication may be reproduced, stored in a retrieval system or transmitted in any form or by any means, electronic, mechanical, photocopying, recording, scanning or otherwise, except as permitted under Sections 107 or 108 of the 1976 United States Copyright Act, without either the prior written permission of the Publisher, or authorization through payment of the appropriate per-copy fee to the Copyright Clearance Center, 222 Rosewood Drive, Danvers, MA 01923, (978) 750-8400, fax (978) 646-8600. Requests to the Publisher for permission should be addressed to the Permissions Department, John Wiley & Sons, Inc., 111 River Street, Hoboken, NJ 07030, (201) 748-6011, fax (201) 748-6008, or online at http://www.wiley.com/go/permissions.
Limit of Liability/Disclaimer of Warranty: The publisher and the author make no representations or warranties with respect to the accuracy or completeness of the contents of this work and specifi cally disclaim all warranties, including without limitation warranties of fi tness for a particular purpose. No warranty may be created or extended by sales or promotional materials. The advice and strategies contained herein may not be suitable for every situation. This work is sold with the understanding that the publisher is not engaged in rendering legal, accounting, or other professional services. If professional assistance is required, the services of a competent professional person should be sought. Neither the publisher nor the author shall be liable for damages arising herefrom. The fact that an organization or Web site is referred to in this work as a citation and/or a potential source of further information does not mean that the author or the publisher endorses the information the organization or Web site may provide or recommendations it may make. Further, readers should be aware that Internet Web sites listed in this work may have changed or disappeared between when this work was written and when it is read.
For general information on our other products and services please contact our Customer Care Department within the United States at (877) 762-2974, outside the United States at (317) 572-3993 or fax (317) 572-4002.
Wiley publishes in a variety of print and electronic formats and by print-on-demand. Some material included with standard print versions of this book may not be included in e-books or in print-on-demand. If this book refers to media such as a CD or DVD that is not included in the version you purchased, you may download this material at
http://booksupport.wiley.com. For more information about Wiley products, visit www.wiley.com. Library of Congress Control Number: 2012933621
Krista, Sara, Rachael, and Josh.
— Paul Turley
Dedicated to my parents.
— Robert M. Bruckner
I dedicate this book to my beautiful wife, Michelle,
who still loves me and encourages me, after all
these years; to my children, Gabriella, Joshua, and
Olivia, who brighten my life with their smiles and
unconditional hugs; and to my mother Lucia who
keeps believing that I am a rockstar.
— Thiago Silva
I dedicate this book to my wife and best friend,
Rosemarie Withee.
— Ken Withee
I dedicate this book to my wife Sue, who still loves
me after all these years; to my teenage kids, Megan,
Lisa, and Zoe, who have turned out even better than I
could have hoped; and to mum and dad who gave me
the opportunity and encouragement to always do and
learn new things.
PAUL TURLEY is a Mentor with SolidQ, a Microsoft MVP, solution architect, teacher and presenter. He speaks at industry conferences and authors several publications on BI, data visualization, and reporting. He blogs at SQLServerBIBlog.com. He has been developing business database solu-tions since 1991 for companies like Microsoft, Disney, Nike, and Hewlett-Packard. He has been a Microsoft Certifi ed Trainer since 1996 and holds several industry certifi cations, including MCTS and MCITP for BI, MCSD, MCDBA, MSF Practitioner, and IT Project+.
Paul has authored and coauthored several books and courses on databases, business intelligence, and application development technologies. His books include SQL Server Reporting Services Recipes for Designing Expert Reports, Professional SQL Server 2008 Reporting Services, Professional SQL Server 2005 Reporting Services, Professional SQL Server Reporting Services (SQL Server 2000), Beginning T-SQL with SQL Server 2005 and 2008, Beginning Transact-SQL with SQL Server 2000 and 2005, Beginning SQL Server 2005 Administration, Beginning Access 2002 VBA, Data Warehousing with SQL Server 2000 Analysis Services, and Professional Access 2000 Programming — all from Wrox. He is also the lead author for SQL Server 2005 Integration Services Step by Step from Microsoft Press.
ROBERT M. BRUCKNER, is a principal software architect and developer with the Microsoft SQL Server division. Robert is responsible for the technical architecture of SQL Server Reporting Services including Power View. One of Robert’s core areas has been the design and development of the scal-able report processing engine, utilized by Reporting Services and Power View. Power View is an enhancement of Reporting Services 2012, enabling end-users to easily and interactively visualize data, quickly gain analytical insights, and simply have fun exploring data!
Prior to joining Microsoft in 2003, Robert researched, designed, and implemented database and business intelligence systems as a system architect at T-Mobile Austria, and as a researcher at Vienna University of Technology, Austria. Robert holds Master and PhD degrees with highest distinctions in Computer Science from Vienna University of Technology, and holds several patents.
Anyone good with a search engine can fi nd thousands of Robert’s past postings on public news-groups and MSDN forums sharing his insights, tips, tricks, and expert advice related to Reporting Services and other SQL Server technologies. Robert has co-authored books on SQL Server
Reporting Services as well as Analysis Services. Robert regularly presents at industry conferences and also maintains a popular blog at: http://blogs.msdn.com/robertbruckner. In his spare time, Robert enjoys mountain biking, skiing, and reading.
was a contributor in the book Microsoft SQL Server Reporting Recipes for Designing Expert Reports. Thiago has been featured on the tech podcast “.NET Rocks!”, and he is a member of the DFW .NET user groups and community. He occasionally writes articles on his tech blog
“Silvaware,” found at http://silvaware.net. Thiago holds a BBA in Information and Operations Management with a focus on Information Systems from Texas A&M University. He holds MCAD, MCPD, and MCTS titles for web development using ASP.NET 2, 3.5, and 4.
KEN WITHEE is President of Portal Integrators LLC (www.portalint.com), a software develop-ment company focused on developing world class business applications for the SharePoint platform. He lives with his wife Rosemarie in Seattle, Washington, and is the author or coauthor of several books including Microsoft Offi ce 365 For Dummies (Wiley, 2011), SharePoint 2010 Development For Dummies (Wiley, 2011), Professional Microsoft Project Server 2010 (Wrox, 2012), Microsoft Business Intelligence For Dummies (Wiley, 2010), Professional Microsoft SQL Server 2012 Reporting Services (Wrox, 2012), and Professional Microsoft SQL Server 2008 Reporting Services (Wrox, 2008). Ken has also written a number of other published works in a variety of journals and magazines.
Ken earned a Master of Science degree in Computer Science studying under Dr. Edward Lank at San Francisco State University. Their work has been published in the LNCS journals and was the focus of a presentation at the IASTED conference in Phoenix. Their work has also been presented at various other Human Computer Interaction conferences throughout the world.
Ken has more than 12 years of professional computer and management experience working with a vast range of technologies. He is a Microsoft Certifi ed Technology Specialist and is certifi ed in SharePoint, SQL Server, and .NET.
GRANT PAISLEY is an SQL Server MVP and founder of Angry Koala, a Microsoft Business
EXECUTIVE EDITOR Mary Beth Wakefi eld
FREELANCER EDITORIAL MANAGER
VICE PRESIDENT AND EXECUTIVE GROUP PUBLISHER
Richard Swadley
VICE PRESIDENT AND EXECUTIVE PUBLISHER Neil Edde
Thanks to:
My wonderful family for their enduring support and occasional tolerance for my over-commitment to books, papers, projects, and events. To my wife Sherri who says “Honey, I love you, but if you bring home one more piece of conference swag, you’ll sleep in the garage.”
…the Reporting Services and SQL Server BI product teams at Microsoft; Thierry, Sean, Carolyn, Lukasz, Ariel, Robert, and many others who have been open and available for the past nine years of books, projects, and support. Thank you for letting me play a small role in your quest to avail these fantastic technologies to people who use them to deliver information and make important things happen all over the world. Thanks to Mark, Chuck, Denny, Carl, John, and the SQL CAT team.
…the Microsoft MVP organization for building an unbelievable network of dedicated professionals. To the SQL Server PASS organization who have nurtured a respected and trusted community. To Arnie and the Oregon SQL team for being my “homies.” Thanks to all the PASS chapter directors and SQL Saturday organizers everywhere.
…everyone at SolidQ for building a stellar organization, unlike any other. I’m proud to be counted among so many trusted friends and professionals.
A heartfelt thanks to the editorial and management team at Wiley; especially Bob and Kelly. How you maintain your sanity trying to manage those who write books in our “spare” time is beyond my comprehension. Thank you for your enduring patience and perseverance. Thank you to my co-authors and reviewers; Robert, Ken, Grant, Thiago, Joe, Chris, Nigel, and Glyn who have endured endless nights and weekends, reviews, and rewrites. Just one more revision and we should be done, guys! Thank you all for making this book happen.
I have a profound respect for those who write “those other” books, and who I consider to be peers and co-contributors to a vibrant industry. Thank you Stacia, Teo, and Brian for keeping the bar high and for your contributions to the industry.
— Paul Turley
Robert would like to thank in particular Paul Turley and Bob Elliott for great collaboration through-out this project, drawing from the experience of several seasoned Reporting Services experts, and collecting proven best practices from large-scale customer deployments of Reporting Services. Furthermore, Robert would like to express a big “thank you” to all co-authors contributing to this book, to Kelly Talbot for great editorial work, and to technical reviewers for ensuring accuracy.
guidance and technical assistance during the authoring of this book.
Thanks to Paul Turley for continuing to give me the opportunity to be a part of this book project, and for Kelly Talbot and Bob Elliot’s support and patience during the writing and editorial process.
Finally, thanks to my wife and kids, who have put up with my long hours and weekend nights spent during the writing of this book. I appreciate their love and encouragement and could not have done this without them.
— Thiago Silva
I would like to acknowledge my grandma Tiny Withee who turns 99 this year and is still going strong. I would also like to acknowledge my wife Rosemarie Withee, mother Maggie Blair, father Ken Withee, sister Kate Henneinke, and parents-in-law Alfonso and Lourdes Supetran and family.
An extraordinary amount of thanks goes to my co-authors; Paul Turley, Robert Bruckner, Thiago Silva, and Grant Paisley. Special thanks to Bob Elliott, Kelly Talbot, Gayle Johnson, Joe Salvatore, Chris Albrektson, Nigel Sammy, and the rest of the Wrox team for making this book a reality.
— Ken Withee
Thank you to the Angry Koala Team, Glyn Llewellyn who picks up the reins in my absence and helped in the writing of my chapters; Colin McGowan, David Lean, Geoff Orr, Mark Fitzpatrick, Lesley Llewellyn, Peter Orgill, and Praveen Chand, who through their professionalism and enthusi-asm for BI, are the backbone to my success. Thanks to my good friend Paul Turley for opportunity and support during authoring; Kelly and the team at Wrox for their invaluable role in getting the book into production. And fi nally my family Sue, Megan, Lisa, and Zoe that I love but rarely say so. Oh and I nearly forgot: “Megan is awesome” — actually you all are!
FOREWORD xxxv INTRODUCTION xxxvii
PART I: GETTING STARTED
CHAPTER 1: INTRODUCING REPORTING SERVICES 3
Who Uses Reporting Services?
4
Business Information Workers 5
Business Managers 5
Software Developers 5
System Administrators 5
Dashboards, Reports, and Applications
6
Blurring the Line Between Applications and Reports 6
Launching Reports from an Application 7
User Interaction 7
Integrating Reports and Applications 8
Enterprise Reporting
9
Solution Types
10
Simple Report Design 10
IT-Designed Reports 11
User-Designed Reports 12
Server-Based Reports 15
Business Intelligence Reporting Solutions
16
Report Data Sources 18
Analytic Data Sources and Self-Service BI 18
Complexity and Report Performance 19
Customizing the Reporting Experience
20
Summary 20
CHAPTER 2: REPORTING SERVICES INSTALLATION
AND ARCHITECTURE 23
The Basic Installation
24
Installing Reporting Services 25
Installing the Reporting Services Samples and
xvi
The Enterprise Deployment
41
SQL Server Editions 41
Named Instances 44
Topology 44 Modes 45
Installation Options 45
Command-Line Installation 46
The Reporting Life Cycle
46
Authoring 47 Management 47 Delivery 47
Reporting Services Tools
47
Report Designer 48
Power View 48
Report Builder 48
Third-Party Authoring Tools 49
Report Manager 49
SharePoint Libraries and Web Parts 49
Reporting Services Confi guration Manager 49
SQL Server Management Applications 49
Command-Line Utilities 50
HTML Viewer 50
Report Viewer Control 51
Reporting Services Web Service 51
Subscriptions 52
Reporting Services Windows Service
52
HTTP.SYS and the HTTP Listener 53
The Security Sublayer 54
Report Manager and the Web Service 55
Core Processing 55
Service Management 55
Confi guration Files 56
WMI and the RPC Interface 57
Reporting Services Processors and Extensions
57
The Report Processor 58
Report Session Caching 59
Report Execution Caching 59
Snapshots 60
Data Processing Extensions 60
xvii
Rendering Extensions 61
The HTML Rendering Extension 62
The CSV-Rendering Extension 62
The XML-Rendering Extension 62
The Image-Rendering Extension 63
The PDF-Rendering Extension 63
The Excel-Rendering Extension 63
The Word-Rendering Extension 64
The Scheduling and Delivery Processor 64
Delivery Extensions 64
Reporting Services Application Databases
64
ReportServer 65 ReportServerTempDB 66
Summary 66
CHAPTER 3: CONFIGURING SHAREPOINT INTEGRATION 69
The SharePoint Technologies
70
SharePoint Foundation 70
SharePoint Server 71
SharePoint Web Parts 73
Installation and Confi guration
74
Installing SharePoint Server 2010 74
Installing Service Pack (SP) 1 76
Installing and Confi guring PowerPivot for SharePoint 77 Installing and Confi guring Reporting Services for SharePoint 81
SharePoint Site Settings 89
Architecture 90
Summary 91
PART II: REPORT DESIGN
CHAPTER 4: BASIC REPORT DESIGN 95
What Good Are Wizards, Anyway?
95
Building Blocks 96
Following Along? 97
Let’s Get Started 97
Touring Report Builder 107
Offi ce Tabs and Ribbons 108
xviii
Insert Tab 109
View Tab 110
Report Builder Menu 111
Viewing and Setting Properties 112
Data Sources 112
Server Reports 112
Manual Report Design
113
Building a Matrix 113
Wrapping It Up 118
Running and Saving the Report 120
Summary 120
CHAPTER 5: REPORT LAYOUT AND FORMATTING 123
Report Layout Types
124
Table Reports 124
Matrix Reports 125
List Reports 126
Chart Reports 126
Gauge Reports and Dashboards 127
Maps and Spatial Reports 127
Defi ning Table Groups 128
Group Expressions and Options 128
Formatting Table Values 130
Interactive Sort 134
Adding Page Breaks 135
Creating Drill-Down Reports and Dynamic Visibility 136
Formatting Report Data 138
Introduction to Dynamic Formatting 138
Designing Multicolumn Reports
139
Designing Gauge Reports
139
Browser Compatibility 140
Offl ine Viewing 141
Rendering Format Limits and Considerations 141
Summary 142
CHAPTER 6: DESIGNING DATA ACCESS 143
Business Intelligence Reporting
146
Reporting for Relational Data
148
Data and Query Basics 148
xix
Creating a Data Source from the Project Add Item Template 149
Creating a Data Source in the Report Wizard 149
Creating a Data Source When Defi ning a Dataset 152
Data Sources and Query Languages 153
T-SQL Query Design 154
Data Warehouse Star Schema 155
Filtering Techniques
161
Filtering a Query 162
Parameter Concepts 163
Filtering Data with Query Parameters 165
Creating a Parameter List 167
Multivalue Parameters 168
Cascading Parameters 170
Report Parameters 175
Using Stored Procedures 176
Filtering Data with Report Parameters 177
Using Other Data Sources
180
Microsoft Access 180
Building a Query in a String Expression 183
Microsoft Excel 184
Oracle P/L SQL 185
Sybase Adaptive Server 186
Federating Data Sources 186
Best Practices
187
Summary 187
CHAPTER 7: ADVANCED REPORT DESIGN 189
Headers and Footers
190
Aggregate Functions and Totals 194
Adding Totals to a Table or Matrix Report 196
Creating Report Templates
198
Creating Composite Reports
199
Anatomy of a Textbox 199
Padding and Indenting 200
Embedded Formatting 201
Embedded HTML Formatting 202
Designing Master/Detail Reports 204
Groups and Dataset Scope 205
Using a List to Combine Report Items and
xx
Designing Subreports
212
Federating Data with a Subreport 213
Execution and Resource Implications 216
Navigating Reports
219
Creating a Document Map 219
Links and Drill-Through Reports 221
Navigating to a Bookmark 223
Navigating to a URL 223
Reporting on Recursive Relationships
224
Summary 228
CHAPTER 8: CHART REPORTS 229
Chart Types
230
Column Charts 230
Stacked Charts 233
Area and Line Charts 233
Pie and Doughnut Charts 234
Bubble and Stock Charts 235
Chart Type Summary 237
The Anatomy of a Chart 239
Creating a Multiseries Chart
240
Using Multiple Chart Areas 242
Useful Properties and Settings 246
Control the Number of Items Displayed on an Axis 246
Manage Axis Text Placement and Rotation 246
Manage the Format of Axis Values 246
Change the Color and Width of a Series Line 246
Set a Tooltip for a Chart Value 246
Control the Width and Gap Between Columns or Bars 246 For a Chart with Multiple Chart Areas, Control the Exact Position
of Each Chart Area 247
Dynamically Increase a Chart’s Size 247
Summary 247
PART III: BUSINESS INTELLIGENCE REPORTING
CHAPTER 9: BI SEMANTIC MODELS 251
Introduction to Data Modeling
252
The BI Semantic Model
253
Conceptual Architecture 256
xxi
Business Logic and Queries 260
Data Access 260
The Hybrid Nature of the BI Semantic Model 261
Summary 262
CHAPTER 10: REPORTING WITH ANALYSIS SERVICES 263
Why Use Analysis Services for Reporting?
264
Using Reporting Services with Analysis Services Data
266
Working with Multidimensional Expression Language
266
MDX: Simple or Complex? 267
Building Queries with the MDX Query Designer 267
Creating a Data Source 268
Building the Dataset Query 270
Using Parameterized Queries 273
Modifying the MDX Query 278
Adding Nonadditive Measures
285
When to Use the Aggregate Function 287
MDX Properties and Cube Formatting
289
Drill-Through Reports
290
Creating Cube Report Actions 291
Parameter Safety Precautions 292
Best Practices and Provisions
293
Summary 293
CHAPTER 11: OLAP REPORTING ADVANCED TECHNIQUES 295
Cube Dynamic Rows
296
Cube Dynamic Rows Anatomy 296
Parameters 296 Dataset 297
Matrix Content 301
Formatting the Row Label 301
Highlighting the Current Row 303
Dynamic Number Formatting 304
Self-Calling Drill-Through Action 304
Cube Dynamic Rows Summary 306
Cube Dynamic Rows Expanded
306
MDX Query Modifi cations 306
Design Surface Modifi cations 308
Tablix 308
Visualization Tweaks 308
xxii
Cube Restricting Rows
309
Designing the Report 309
pRowCount Parameter 309
Restricting the Number of Rows in the MDX Query 312 Adding pRowCount to Self-Calling Drill-Through Report Action 314 A Better Way to Interact with a Report Parameter 314 Summary 314
Cube Metadata
315
Designing the Report 315
MeasureGroups 318
Adding Other Cube Metadata 320
Final Thoughts 324
Cube Browser
324
Anatomy of the Reports 326
Cube Browser 326
Cube Browser Metadata 327
Cube Browser Member 329
Behind the Scenes 329
Cube Browser 329
Report Body 334
Restricting Rows and Columns 336
Swap Actions 336
Titles 338
Footer Information 342
Final Thoughts 345
Summary 346
PART IV: ENABLING USER REPORTING
CHAPTER 12: TABULAR MODELS 349
Introduction to PowerPivot
350
PowerPivot for Excel 352
Setup and Installation 354
Importing Data into PowerPivot
355
PowerPivot Window
360
The Home Tab 360
The Design Tab 361
The Advanced Tab 362
Analyzing and Enriching Data
363
Filtering and Sorting 363
xxiii
Calculated Columns 367
Measures 368
Browsing the Model 371
Summary 372
CHAPTER 13: VISUAL ANALYTICS WITH POWER VIEW 373
Introduction to Power View
374
Power View Architecture
379
Architecture Overview 380
Reporting Services Add-in 381
Reporting Services Service Application 381
PowerPivot for SharePoint 382
Preparing a Model and Connection for a Tutorial
382
Deploying the FAA Flight Data Model 383
Creating a SharePoint Image Library for FAA Airline Images 384 Publishing the FAA Workbook Directly to the PowerPivot Gallery 386 Creating Data Source Connections for Power View 387
BI Semantic Model (BISM) Connection File 387
Report Data Source (RSDS) Connection 388
Visual Analytics with Power View
389
Getting Started with Power View 390
Creating a New Power View Report 390
Opening an Existing Power View Report 391
Introduction to the Design Experience 391
Creating a Table Visualization 392
Converting Visualizations 394
Sorting Inside a Chart 395
Expanding Visualizations 396
Filtering in Views 396
Multiple Views 400
Saving Reports 403
Permissions for Power View 405
Visualizations and Interactivity 405
Tile Visualizations 405
Highlighting in Visualizations 408
Matrix 409 Slicers 410 Filters 410
Card and Callout Views 411
Zooming in Charts 413
xxiv
Animated Timeline Charts 416
Refreshing Data in a Power View Report 418
Presenting and Exporting in Power View 418
Reading and Presentation Modes 419
Printing Views 421
PowerPoint Export and Interactivity 421
Tips and Tricks for Power View 424
Confi guring Data Source Connections
425
Connecting to PowerPivot Workbooks 427
Connecting to a BISM Connection File 428
Connecting to an RSDS 429
Authentication Scenarios 430
Comparison and Trade-off s 432
Kerberos Delegation with BISM or RSDS 432
BISM Connection and RS Service Account 433
RSDS and Stored Windows Credentials 433
RSDS with Impersonation and Eff ectiveUser 435
Analysis Services Tabular
437
Installing Analysis Services Tabular 437
Deploying a PowerPivot Workbook to Analysis Services Tabular 440
Summary 442
Resources 443
CHAPTER 14: REPORT BUILDER SOLUTION STRATEGIES 445
Report Builder and Semantic Model History
447
Planning a Self-Service Reporting Environment
448
You Need a Plan 448
Design Approaches and Usage Scenarios 448
Defi ne Ownership 449
Data Governance 450
Data Source Access and Security 451
User Education 451
Optimizing the Report Builder User Experience 452
Conducting User Training 452
Folder and Library Management 452
Report Branding 452
Data Source and Query Options 453
Using Shared Data Sources 453
Using a BI Semantic Model 454
xxv
Using Report Parts 457
Using Shared Datasets 457
User Report Migration Strategies
457
Report Migration Phases 457
Review 457
CHAPTER 15: MANAGING REPORT PROJECTS 463
Solutions and Projects
463
Project Structure 464
Multiple Reporting Environments 465
Multiple Logical Folders and Projects 465
Report-Naming Conventions 466
Shared Datasets and Data Sources 466
Key Success Factors 467
Solution Scope 467
Report Specifi cations 468
Report Template 469
Development Phases 469
Multiple Reporting Environments 469
Multiple Logical Folders and Projects 470
Version Control
471
Why Use Version Control? 471
Setting Up Version Control 471
Getting the Latest Version 472
Viewing a Report’s History 472
Restoring a Previous Version of a Report 472
Setting Check-out and Check-in Policies 472
Applying Labels 473
Synchronizing Content
473
Deploying an Individual Report 473
Deploying a Suite of Reports 473
Checking for Build Errors 473
xxvi
Managing Server Content
474
Checking the Deployment Location 474
Managing Content in Native Mode 475
Managing Data Sources 475
Managing Data Sets 476
Managing Reports 476
Managing Content in SharePoint 477
Getting Started with Azure Reporting
477
Deploying and Executing Reports 481
Summary 482
CHAPTER 16: REPORT SOLUTIONS, PATTERNS, AND RECIPES 483
Super Reports
484
Working with the Strengths and Limitations of the Architecture 484
Report Recipes: Building on Basic Skills
487
Dashboard Solution Data Sources and Datasets 488
KPI Scorecard 488
Deploying a Report Part 492
Interactive Sparkline and Chart 494
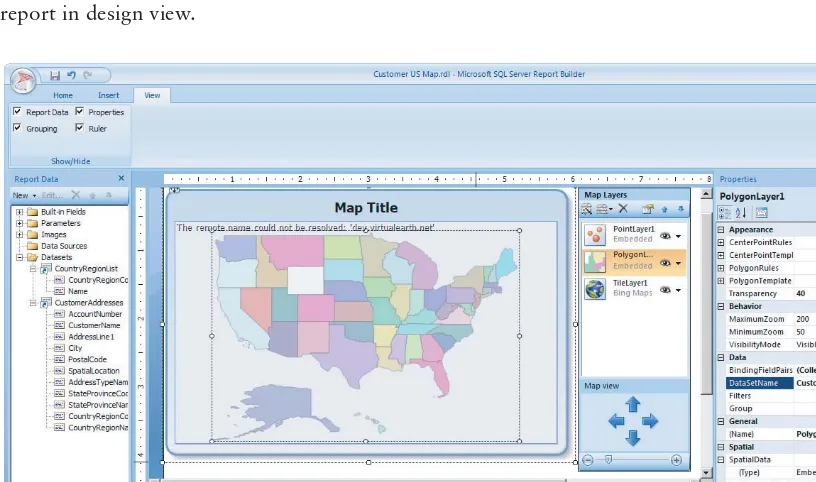
Map with Navigation and Zoom 502
Geographic Shape Colors 506
Adding Spatial Point Markers 508
Zoom, Pan, and Tilt 509
Using Report Parts to Assemble a Dashboard 511
Dynamic Colors and Themes 514
Table Report with Dynamic Columns 517
Designing the Report 517
Summary 521
PART VI: ADMINISTERING REPORTING SERVICES
CHAPTER 17: CONTENT MANAGEMENT 525
Using Report Manager
526
Content Management Activities
529
Folders 529
Shared Data Sources 531
Report Models 534
Reports 535
Report Resources 543
xxvii
Item-Level Security
545
Content Management Automation
553
The RS Utility 553
Reporting Services Scripts 555
Summary 557
CHAPTER 18: INTEGRATING REPORTS WITH SHAREPOINT 559
Native Mode Web Parts
560
Native Mode Web Parts Installation 560
Report Viewer 561
Report Explorer 562
Publishing Reports to SharePoint
564
SharePoint Foundation and SharePoint Server Standard Edition 564
SharePoint Server Enterprise Edition 570
Report Management
572
Integrated Mode Web Parts
574
Native Mode Versus Integrated Mode
577
Report Models
578
Summary 579
CHAPTER 19: NATIVE MODE SERVER ADMINISTRATION 581
Security 582
Account Management 582
The Service Account 583
The Application Database Account 585
The Unattended Execution Account 586
System-Level Roles 587
Surface Area Management 589
Backup and Recovery
590
Application Databases 590
Encryption Keys 592
Confi guration Files 594
Other Items 595
Monitoring 595
Setup Logs 596
Windows Application Event Logs 596
Trace Logs 596
Execution Logs 600
Performance Counters 602
xxviii
PART VII: REPORTING SERVICES CUSTOM PROGRAMMING
CHAPTER 20: INTEGRATING REPORTS INTO CUSTOM APPLICATIONS 619
URL Access
620
URL Syntax 620
Accessing Reporting Services Objects 621
Folders 621
Data Sources 623
Resources 625 Reports 625
Reporting Services URL Parameters 627
Parameter Prefi xes 627
Parameters 628
Passing Report Information Through the URL 632
Report Parameters 633
Rendering Snapshot History 634
URL Rendering Summary 635
Programmatic Rendering
635
Common Scenarios 636
Custom Security 636
Server-Side Parameters 636
Rendering Through Windows 637
Building the Application Interface 637
Setting Up the Web Services 637
Retrieving Report Information 643
Retrieving Report Parameters 648
Rendering a Report to a File on the Filesystem 653
Rendering a Report to the Filesystem Summary 660
Rendering to the Web 661
xxix
Modifying the web.confi g File 662
Confi guring ASP.NET 2.0 in IIS 6 and Older Versions 662
Setting Up the Report Execution Web Service 662
Rendering to the Response Object 662
Using the ReportViewer Control
669
Embedding a Server-Side Report in a Windows Application 672
Summary 678
CHAPTER 21: USING EMBEDDED AND REFERENCED CODE 681
Using the Expression Builder
683
Calculated Fields
684
Conditional Expressions
687
IIF() Is Your Friend
687
Using Custom Code
690
Using Custom Code in a Report 691
Using a Custom Assembly 692
Custom Assembly Security 694
Errors, Warnings, and Debugging Code 695
Summary 695
CHAPTER 22: EXTENDING REPORTING SERVICES 697
Extension Through Interfaces
699
What Is an Interface? 699
Interface Language Diff erences 700
A Detailed Look at Data Processing Extensions 702
Creating a Custom Data Processing Extension
705
The Scenario 705
Creating and Setting Up the Project 706
Creating the DataSetConnection Object 708
Variable Declarations 710
Constructors 710
Implementing IDbConnectionExtension 711
Impersonate Property 711
IntegratedSecurity Property 712
UserName and Password Properties 712
Implementing IDbConnection 713
Begin Transaction Method 715
xxx
Open Method 716
Close Method 717
ConnectionString Property 717
ConnectionTimeout Property 719
Creating the DataSetParameter Class 720
Declarations 720
Implementing IDataParameter 720
ParameterName Property 721
Value Property 722
Creating the DataSetParameterCollection Class 723
Namespaces 723
Implementing IDataParameterCollection 723
Creating the DataSetCommand Class 725
Variable Declarations 726
Creating the DataSetDataReader Object 741
Declarations 741
Installing the DataSetDataProcessing Extension 746
Server Installation 746
Server Security Confi guration 747
WorkStation Installation 748
WorkStation Security Confi guration 748
Testing DataSetDataExtension 749
xxxi
PART VIII: APPENDIXES
APPENDIX A: T-SQL COMMAND SYNTAX REFERENCE 757
T-SQL Commands, Clauses, and Predicates
758
WITH 758
EXCEPT and INTERSECT 762
ORDER BY 762
COMPUTE and COMPUTE BY Clauses 763
xxxii
CREATE VIEW 768
CREATE SCHEMA 769
CREATE PARTITION FUNCTION 769
CREATE PARTITION SCHEME 769
Script Comment Conventions
769
Reserved Words
770
ODBC Reserved Words 772
Future Reserved Words 775
APPENDIX B: T-SQL SYSTEM VARIABLES AND FUNCTIONS 779
System Global Variables
779
Confi guration 780
APPENDIX C: MDX REFERENCE 803
Object Identifi ers
803
Reserved Keywords
803
Member References
806
xxxiii
The SELECT Statement
808
Axis Defi nitions 809
The WHERE Clause 809
The FROM Clause 810
The WITH Clause 810
Parameters 811
MDX Functions and Keywords
812
Keywords 812
KPI Functions 813
Metadata Functions 813
Navigation Functions 815
Other Functions 817
Set Functions 818
Statistical Functions 821
String Functions 824
Time Functions 825
UI Functions 826
Value Functions 828
Fifteen years ago, in January 1997, our company, Panorama Software, was acquired by Microsoft during its entry into the business intelligence space. That was a long time ago. In fact, it was so long ago, I’m not sure that business intelligence was even called BI. Back then our mission and strategy were simple, accompanied by the short but effective slogan “OLAP for the masses.” For the most part that mission hasn’t changed over the years. We’ve simply focused on different aspects of the product that would deliver us the “masses.”
In the early years, our focus and mission were to ensure that our technology was easy to use, didn’t require much consulting (relative to what was required at the time in the market), and yes, was cheap. The idea was to make the technology accessible to as many companies as possible. The other element of the strategy was to make the solution a platform play and build a healthy ecosystem around our BI offering.
Indeed, in the early years we set out to build a server with strong capabilities, with a rich set of APIs and query language (MDX). We also built a thriving ecosystem of partners.
Results were seen quickly. The SQL OLAP Server, later known as SQL Server Analysis Services, became the most widely used OLAP Server in the world, a title the product still holds today.
Witnessing the market adoption of and reaction to the Analysis Services server, we began our sec-ond act by offering something new and innovative for reporting solutions: SQL Server Reporting Services. Its adoption surpassed our wildest expectations. Overnight our user base grew by tens of millions of report consumers, who got their reports and insights from their IT departments. Just like that, we took a giant step forward in reaching the masses we were after.
As more and more companies have begun using BI solutions, user sophistication has evolved. Our users suddenly felt the power and value BI offers, and they wanted more of it. However, they discov-ered that their IT departments could not address their demand, and they became a bottleneck.
Viewing the problem as both an inhibitor and an opportunity to expand our reach and continue our mission of providing “BI for the masses,” we developed a set of tools. PowerPivot was released in 2010, followed by Power View in 2012. They aimed to help information workers build their own BI solutions with what we called “managed self-service BI.” The self-service concept is easy to grasp: Build a tool that can be used by any information worker who has access to data so that he can build his own BI solution. The managed aspect is more fundamental. Even though we want to empower end users, IT wants to do so in a controlled and safe fashion. IT wants to ensure that all critical data and apps are properly backed up, that the data is not stale, and that it is clear how the data is used and by whom.
xxxvi
to learn the product. It required a whole new level of interactivity of performance, with instant response times, because users are impatient. We needed to assume that the users would experiment with their data set. This is unlike a professional BI project, which has a well-defi ned set of require-ments that developers must meet. In the self-service scenario, the user simply experirequire-ments with the data and discovers insights on his own. This leads us to one of our most important design points: have fun. The only way a user will take the time to discover insights on his own is if he has fun with the data.
What I really like about Professional SQL Server 2012 Reporting Services is that it’s a perfect refl ection of the Microsoft BI journey through the eyes of the Reporting Services product line, from the early days of managed and operational to the latest addition of self-service reporting. This book was written by experts who built the product and have implemented it at customers’ sites. Together they have more than 40 years of business intelligence experience.
I call this book the encyclopedia of SQL Server Reporting Services. All the chapters have been updated with the latest information to ensure accuracy and compatibility with the latest version of SQL Server 2012. The book includes a new section that refl ects the addition of Power View with PowerPivot. You’ll learn how to best use the two together to refl ect the latest management capabili-ties of Reporting Services in SharePoint.
I hope you will enjoy reading this book and using SQL Server Reporting Services 2012 as much as we, the product team, have enjoyed building the product.
Reporting Services is a report design and enterprise-class information delivery tool that has aged and matured for more than nine years now. And this book has grown along with the product. We fi rst started writing Professional Microsoft SQL Server Reporting Services before the product was released, back in 2003. After four new versions of Reporting Services, there have been four editions of this book.
We have learned a lot about report writing and report solution development from our experience with SSRS and other reporting tools, and we share the benefi t of that experience in this book. Not only do we show you how to use this technology and tools to design reports as they were intended to be used, but we also share the best practices and lessons we have learned along the way. The authors have spent tens of thousands of hours using these tools to solve business problems for organizations in many different industries and businesses.
WHO THIS BOOK IS FOR
Some books are written specifi cally for beginners, and others are for serious developers and advanced report designers. We’ve made it a point to address the needs of the many without sacrifi c-ing the needs of the few. We wanted to write a book that would meet the needs of a broad audience, along with specifi c solutions for report designers, developers, administrators, and business profes-sionals. Our goal is for this book to be a comprehensive guide and valuable reference. To meet this objective, we’ve divided this book into parts — “mini-books,” if you will. Depending on your needs, you may spend more time focusing on the material in one of these parts and using the others for reference. This book is written for the novice report designer and the expert interested in learning to use advanced functionality. For the application developer, we cover programming in reports and custom applications that integrate reports. You also learn about report server administration and security issues.
We’ve come to know more about the people who use Reporting Services in various ways. The follow-ing sections describe people in different roles and the parts of the book that address their needs. We’ve given these people names to make the examples more realistic. Use these examples as a guide to fi nd the role that best describes your needs and the ways in which you will use Reporting Services.
Report Designer
xxxviii
exported from the HR and customer billing systems. After a while, she learned how to write queries and build Access reports without the wizards, with custom formatting, groups, and summaries. She has used other reporting tools to report on the data in the company’s data warehouse and some opera-tional databases. She has designed several reports with charts and pivots to analyze sales trends and profi tability. Her company recently standardized the use of Reporting Services.
Mary’s focus is on out-of-the-box reporting — designing and deploying reports as easily as possible using the tools readily available within the product. She might end up designing standard server-based reports that users will access from a central report server via the corporate intranet. She may also want to create her own ad hoc client-side reports from data models created by an administrator or more advanced designer.
The following parts of the book will be of most interest to Mary:
‰ Part I, “Getting Started”
‰ Part II, “Report Design”
‰ Part III, “Business Intelligence Reporting”
‰ Part IV, “Enabling User Reporting”
Application Developer
Joe has been writing database applications for several years. A few years ago he began using Microsoft .NET programming tools and landed a programming position in the company’s Information
Technology group. Joe has designed many of the company’s web sites and portals using the Visual Basic .NET and C# programming languages. Most of the reports Joe has created were written from scratch as custom web pages. He has worked a little with a few specialized reporting applications. He wants to add reporting capabilities to some of the company’s custom business applications.
As far as Joe is concerned, writing simple reports is for others to do. He’s more concerned with add-ing functionality to a solution rather than dealadd-ing with business questions and aesthetic qualities of reports. His focus will likely be to add fi ltering, custom formatting, and conditional logic using program code and query scripts. He will also design his reports so that they fi t into applications as an integrated part of a solution. He may also want to create customized management utilities to automate report server maintenance routines.
Joe understands that Reporting Services offers many fl exible options for integrating reports into dif-ferent application interfaces. He may want to build reports into a custom Windows desktop applica-tion, web applicaapplica-tion, SharePoint Portal, or mobile device application.
Joe will be most interested in these parts:
‰ Part II, “Report Design”
‰ Part III, “Business Intelligence Reporting”
‰ Part V, “Solution Patterns”
xxxix
Systems Engineer or DBA
Bob is a network engineer and database administrator. He is more concerned with the security and stability of the corporate servers than with the aesthetics and features of each report. He will want to make sure that the report managers, designers, developers, and users are organized into roles and that the report server is appropriately secured. Bob will install and confi gure options on the report server. He will schedule maintenance tasks, optimize the database and queries, and provide ongoing maintenance and disaster recovery.
Bob will fi nd these parts most useful:
‰ Part I, “Getting Started”
‰ Part V, “Solution Patterns”
‰ Part VI, “Administering Reporting Services”
Business Leader
As a business owner, corporate executive, or project manager, you may be the consumer of a reporting solution or the director of the development effort. Perhaps you have enlisted the ser-vices of a business intelligence consulting fi rm to architect a decision-support system to help run your business. You need to be informed about your options and understand the capabilities of the products and technologies used to create your solution. This book helps you understand these features and the choices necessary to put them into practice. The implementers of this solu-tion will look to you for business requirements and feature choices. Chapters 1 and 4 are a good place to start. Part III, “Business Intelligence Reporting,” may be of particular interest to you because it is a guide for the types of reporting scenarios applied to your business analytics. Part V, “Solution Patterns,” discusses how to defi ne and manage reporting solutions and business requirements and specifi cations. This will serve as a communication medium between you, busi-ness users, and your report designers.
WHAT THIS BOOK COVERS
This book is divided into seven parts:
‰ Part I, “Getting Started”
‰ Part II, “Report Design”
‰ Part III, “Business Intelligence Reporting”
‰ Part IV, “Enabling User Reporting”
‰ Part V, “Solution Patterns”
‰ Part VI, “Administering Reporting Services”
xl
Part I: Getting Started
Chapter 1, “Introducing Reporting Services,” describes the capabilities and features of Reporting Services. You learn about its extensible architecture, which makes it a powerful and fl exible addi-tion to nearly all existing business systems. This chapter builds a foundaaddi-tion of understanding upon which you will learn to design, deploy, manage, and perhaps customize business intelligence and reporting solutions. You learn about report user profi les and report application and solution types. The new report design tools for SQL Server 2012 are introduced. These include the new SQL Server Data Tools Report Designer and Report Builder.
Chapter 2, “Reporting Services Installation and Architecture,” helps you install Reporting Services and explains the architecture of a complete reporting solution. This chapter guides you through the steps to set up your development environment and plan your enterprise deployment. This helps you understand the core services and technologies that Reporting Services uses. By learning how the product works and how the components interact, you will be better prepared to design and maintain a scalable solution.
Chapter 3, “Confi guring SharePoint Integration,” is for you if you plan to integrate Reporting Services with SharePoint. You learn how to install and confi gure all the integrated components. You can skip this chapter if you plan to use Reporting Services in Native deployment mode, without SharePoint.
Part II: Report Design
Designing reports can be as simple as running a wizard, or it can be a highly complex development process that defi nes advanced features. You learn how reports actually process and render data, and how to use parameters and expressions to defi ne creative report solutions.
Chapter 4, “Basic Report Design,” starts with the fundamentals and teaches you how to create basic reports using simple design tools. You learn the essentials of what you need to get started building basic reports using the Report Wizard and common Report Designer features. You’re introduced to the fundamental building blocks of report design: report items and report layout properties. This chapter describes the two report design tools used to create standard reports. Report Builder is for users who want a simple, straightforward tool for designing basic reports. The SQL Server Data Tools help you manage report projects and design reports in the Microsoft Visual Studio develop-ment environdevelop-ment.
xli
Chapter 6, “Designing Data Access,” reveals that reports are based on a data source and that Reporting Services may be used to present data from many different data sources. You learn to defi ne stand-alone and shared data sources, queries, and datasets and to use parameters to fi lter data at the database and at the Report Server. You learn to use new parameter features introduced in the latest version of the product. This chapter is a primer on T-SQL queries and stored proce-dures. You also learn how to build reports using Analysis Services and the MDX Query Builder. Query examples are also provided for Oracle PL/SQL, Sybase, and Access SQL dialects.
Chapter 7, “Advanced Report Design,” helps you take design elements to the next level by showing you how to creatively use data groups and combinations of report items. Calculations and condi-tional formatting may be added by using simple programming code. Whether you are an applica-tion developer or a report designer, this chapter contains important informaapplica-tion to help you design reports to meet your users’ requirements and raise the bar with compelling report features.
Chapter 8, “Chart Reports,” focuses on simple and advanced charting visuals. You learn how to group and aggregate values in a variety of chart presentations. This chapter is a guide for the types of charts you can use to present different types of data in different scenarios. We also expose several hard-to-fi nd chart features and properties that are useful when you create more advanced visual reports.
Part III: Business Intelligence Reporting
Chapter 9, “BI Semantic Models,” covers a new topic and set of capabilities introduced in SQL Server 2012. This chapter explains these options and technologies in simple terms, clarifying the choices and best solutions.
Chapter 10, “Reporting with Analysis Services,” discusses the advantages and unique challenges of reporting on multidimensional cubes and databases. You learn the fundamentals of MDX query design and consuming cube data in the report designer.
Chapter 11, “OLAP Reporting Advanced Techniques,” addresses the design techniques and unique best practices for reporting on multidimensional cube data. You learn how to create MDX queries with parameters, calculations, and aggregations. You also learn to apply advanced report design patterns and techniques to build a dynamic cube browser.
Part IV: Enabling User Reporting
Chapter 12, “Tabular Models,” covers semantic modeling using PowerPivot and enterprise-scale tabular models in SQL Server 2012. You learn about the basic use and application of tabular models used to perform in-memory aggregation, modeling data from different sources, defi ning relation-ships, and performing calculations using DAX, hierarchies, and KPIs.
xlii
understand a semantic model and the core mechanics of the tool can create compelling reports and attractive business presentations in a tactile and interactive reporting interface.
Chapter 14, “Report Builder Solution Strategies,” is a guide to using the Report Builder design tool, which can be used to enable user self-service reporting scenarios. It helps users help themselves after the necessary preparation and planning. You learn how to teach users to utilize this tool to consume data available to them for reporting. You also learn how to support users and train them to use this tool to answer question and build their own reports using shared components such as shared data sources, shared datasets, and report parts.
Part V: Solution Patterns
Chapter 15, “Managing Report Projects,” helps you plan and manage report projects of varying sizes and scales. You learn how to maintain small-scale report projects with one or a few report designers and large-scale, formal projects with a team of developers and report designers. We dis-cuss strategies for using Report Builder in SharePoint to manage business user reports and SQL Server Data Tools with integrated version control and team collaboration.
Chapter 16, “Report Solution Patterns and Recipes,” covers design patterns we’ve learned from years of solution design. We separate reality and theory, and discuss the best practices and tech-niques that work for others in the industry. We also discuss how to establish the standards and prac-tices adapted for the needs and requirements of your users and business.
Part VI: Administering Reporting Services (via tracking grid)
Report server administration has an important job: keeping data secure and available to the right users. Server-side reports can be confi gured and secured to optimize performance and to provide the right information to the appropriate user communities. Chapters 13 and 14 teach you how to use all the tools necessary to confi gure and manage your Report Server.Chapter 17, “Content Management,” teaches you how to use management tools and Reporting Services features to publish reports and manage execution and delivery. You learn to create auto-mated scripts and custom solutions to manage all the Report Server content. You revisit the stages of report execution from an administrator’s point of view and learn how to optimize them. You also learn how to automate report delivery and server management.
Chapter 18, “Integrating Reports with SharePoint,” helps you understand how Reporting Services and SharePoint are used together to create business solutions. Whether you choose to confi gure Reporting Services in SharePoint integrated or Native deployment mode, you can embed report content using web parts. You also learn how to take advantage of Integrated mode features to make reporting a seamless part of the team collaboration culture in your business.
xliii
Part VII: Reporting Services Custom Programming
Practically all the built-in functionality in Reporting Services can be automated and performed through custom program code. This includes report rendering and the core services of the reporting environment: data access, rendering formats, security, and delivery.
Chapter 20, “Integrating Reports into Custom Applications,” shows you that Reporting Services is a fl exible reporting tool that can be easily incorporated into different applications. In this chapter, you learn to use URLs to access reports from document and web page links and use the Reporting Services Web service to programmatically render reports. You also use the ReportViewer controls to embed reports into custom Windows Forms and ASP.NET Web Forms applications. You learn to display reports in web portals using SharePoint web parts and other techniques. You can use programmatic rendering, URL, or the ReportViewer controls to create custom report viewers and parameter interfaces. Examples are provided in C# and VB.NET.
Chapter 21, “Using Embedded and Referenced Code,” shows you techniques for adding custom logic to your reports using application code contained within a report or in an externally referenced assembly component. Using either of these techniques, you can use programming techniques to add custom behaviors and to enable advanced reporting features.
Chapter 22, “Extending Reporting Services,” is written for serious application developers using object-oriented programming techniques, with examples in C# and VB.NET. You learn how to create custom libraries and extensions to add functionality to reports and Report Server features. These extensions may be used to access unique data sources, to render reports to specifi c formats, to authenticate users, and to deliver reports outside of the default methods provided with the product.
Appendixes
The appendixes describe T-SQL syntax, variables, and functions and MDX language functions and reference.
WHAT YOU NEED TO USE THIS BOOK
The hardware and software requirements for designing and running SQL Server 2012 and Reporting Services are such that they will run on most newer business grade computers. Some fea-tures and the capabilities integrated with SharePoint will require a more advanced confi guration including software and more capable hardware. Custom programming examples require that you install any edition of Visual Studio 2010.
The requirements for SQL Server 2012 specifi ed by Microsoft may be found online in the MSDN library located at: http://msdn.microsoft.com/en-us/library/ms143506.aspx. Setting up and confi guring a SharePoint BI environment can be a complex process that requires specifi c hardware capabilities. The requirements specifi ed by Microsoft for SharePoint, PowerPivot, Power View, and Reporting Services running in SharePoint Integrated mode may be found at:
xliv
‰ The Developer or Enterprise Editions are recommended for all the advanced capabilities cov-ered in the book. You can download an evaluation version of SQL Server from Microsoft at
www.microsoft.com/sql.
‰ Report design examples that use standard Reporting Services reports will work with any edition of SQL Server 2012 and will run on a computer meeting the minimum computer requirements.
‰ Chapter 11 and some examples used in other chapters require an installation of SQL Server Analysis Services in multidimensional storage mode. This is an optional part of the SQL Server setup and is installed with a full installation of SQL Server.
‰ Chapters that cover SharePoint integration and Power View require a SharePoint 2010 Enterprise installation, which includes Chapters 13 and 14.
‰ Examples of custom programming performed outside of the report designer will require a sepa-rate installation of Visual Studio 2010. This includes the material in Chapters 20, 21, and 22.
‰ The sample databases used in the examples and exercises are available to download from www. wrox.com along with the sample projects for this book. Additional resources may be available.
‰ The complete source code for the samples is available for download from our web site at www. wrox.com. For programming examples, versions are available in both Visual Basic .NET and C#.
An effective method for simulating a multi-server server environment is to use virtual machine images. Microsoft has made virtual images available at times with pre-confi gured server installa-tions for testing and evaluating their tools. These often contain time-limited-use software. Refer to the book support materials at www.wrox.com for current and updated information.
CONVENTIONS
To help you get the most from the text and keep track of what’s happening, we’ve used a number of conventions throughout the book.
Boxes with a warning icon like this one hold important, not-to-be-forgotten information that is directly relevant to the surrounding text.
The pencil icon indicates notes, tips, hints, tricks, and asides to the current discussion.
As for styles in the text:
‰ Wehighlight new terms and important words when we introduce them.
xlv
‰ We show fi lenames, URLs, and code within the text like so: persistence.properties.
‰ We present code in two different ways:
We use a monofont type with no highlighting for most code examples.
We use bold to emphasize code that is particularly important in the present context or to show changes from a previous code snippet.
SOURCE CODE
As you work through the examples in this book, you may choose to either type in all the code man-ually or use the source code fi les that accompany the book. All the source code used in this book is available for download at www.wrox.com. When at the site, simply locate the book’s title (use the Search box or one of the title lists) and click the Download Code link on the book’s detail page to obtain all the source code for the book. Code that is included on the web site is highlighted by the following icon:
Listings include the fi lename in the title. If it is just a code snippet, you’ll fi nd the fi lename in a code note such as this:
Code snippet fi lename
Because many books have similar titles, you may fi nd it easiest to search by ISBN; this book’s ISBN is 978-1-118-10111-7.
After you download the code, just decompress it with your favorite compression tool. Alternatively, you can go to the main Wrox code download page at www.wrox.com/dynamic/books/download. aspx to see the code available for this book and all other Wrox books.
ERRATA
xlvi
To fi nd the errata page for this book, go to www.wrox.com and locate the title using the Search box or one of the title lists. Then, on the book details page, click the Book Errata link. On this page, you can view all errata that have been submitted for this book and posted by Wrox editors. A complete book list, including links to each book’s errata, is also available at www.wrox.com/misc-pages/ booklist.shtml.
If you don’t spot “your” error on the Book Errata page, go to www.wrox.com/contact/
techsupport.shtml and complete the form there to send us the error you found. We’ll check the information and, if appropriate, post a message to the book’s errata page and fi x the problem in subsequent editions of the book.
P2P.WROX.COM
For author and peer discussion, join the P2P forums at p2p.wrox.com. The forums are a Web-based system for you to post messages relating to Wrox books and related technologies and to interact with other readers and technology users. The forums offer a subscription feature that e-mails you when new posts are made to the forums concerning your chosen topics of interest. Wrox authors, editors, other industry experts, and your fellow readers are present on these forums.
At http://p2p.wrox.com, you will fi nd a number of different forums that will help you not only as you read this book, but also as you develop your own applications. To join the forums, follow these steps:
1.
Go to http://p2p.wrox.com and click the Register link.2.
Read the terms of use, and then click Agree.3.
Complete the required information to join, as well as any optional information you want to provide, and click Submit.4.
You will receive an e-mail with information describing how to verify your account and com-plete the joining process.You can read messages in the forums without joining P2P, but to post your own messages, you must join.
After you join, you can post new messages and respond to messages that other users post. You can read messages at any time on the Web. If you want to receive new messages from a particular forum, click the Subscribe to this Forum icon by the forum name in the forum listing.