CHAPTER IV
RESEARCH METHODOLOGY
4.1 RESEARCH FIELD
This research is in the field of molecular genetics
4.2 LOCATION AND RESEARCH PERIOD
Research will be performed in Department of Human Genetics, Radboud University of Medical Center, the Netherlands for the period of one year.
4.3 RESEARCH DESIGN This is an explorative study.
4.4 POPULATIONS AND SAMPLES
Populations in this research are colorectal cancer patients that were admitted to RUNMC, the Netherlands.
Samples selected for the study cohort are those with the inclusion criteria of:
- No MLH and MSH deletion (stable microsatellites)
- Diagnosed with CRC at the age of less than 40 years old or
4.5 OPERATIONAL DEFINITION
Deletions, insertions, duplications, and complex multi-site variants of DNA segments, collectively termed copy number variants (CNVs) or copy number polymorphisms (CNPs), are found in all humans. MicroRNAs (miRNAs) are functional RNA molecules that are transcribed from the DNA sequence of RNA genes, but not translated into protein and to profile the CNVs affecting miRNA genes a high resolution microarray (385K) is used. Validation of CNVs found will be performed using PCR and q-PCR.
4.6 RESEARCH PROTOCOLS 4.6.1 Microarray design
CGH measures DNA copy number differences between a test and reference genome. Human microarrays used in the current study comprised approximately 380 × 103 oligonucleotides probes (385K) tiling the positive strand.Each perturbed oligonucleotide originated from a perfect match oligonucleotide in which the GC content of the perturbed oligonucleotide was identical to the GC content of the original oligonucleotide in an attempt to maintain the same melting temperature. Each perturbed oligonucleotide can therefore be associated with a specific perfect match oligonucleotide present on the array and the difference in fluorescence intensity between the pair should be a reflection of the perturbation applied.
Next the probes in the array were combined with miRNAs latest database (miRBASE v1.5) that currently covers 939 annotated miRNA. In total 495 of annotated miRNAs in the latest database are covered also covered in our array design.
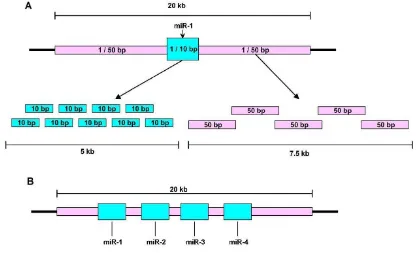
The design of the array is that the each region oh human DNA covered in the array has a 20kb probes span. The 20kb probes are divided into two major areas. The first area has a length of 5kb in total. Each probe in this location has a length of 10bp thus making it a high density area. The high density area is located at the miR genes and predicted miR genes. The second area are flanking on each side of the first area, has a length of 7.5kb each. The probes positioned in this area, each has a length of 50bp making it a low density area.
4.6.2 DNA fragmentation and labeling
Cy3 and Cy5 dye-labeled random 9-mers were diluted into
of buffer containing 0.125 M Tris-HCl (pH 8.0), 0.125 M MgCl2 -mercaptoethanol. Patient DNA samples were labeled with Cy3 and the control/reference DNA samples were labeled with Cy5. One microgram of genomic DNA was added to each random 9-mer buffer solution, denatured at 98°C for 10 minutes, and then chilled on ice for 2 minutes in 0.2 mL PCR tubes. , 10 mM each of dATP, -) was added to each tube and mixed well with a pipet. Samples were centrifuged and incubated at 37°C for
12-mixed wel
min at room temperature, and centrifuging at 12,000g for 10 min. The supernatant was removed and the DNA
centrifugation at 12,000g for 2 min, the supernatant was removed, and the pellet
of DI water. DNA concentration was measured using a spectrophotometer.
4.6.3 Sample hybridization, imaging and data analysis
procedures, as previously described [74]
reference DNA sample were added to a single 1.5 mL tube and dried down in the
was added to the tube, mixed well, and heated at 95°C for 5 min in the dark. Samples were hybridized at the NimbleGen Service Facility for 16 20 h at 42°C and then washed with NimbleGen wash buffers and scanned on an Axon scanner (Model GenePix 4000B). For mapping of genomic breakpoints the segMNT v1.1 CGH
To determine the threshold for scoring of gain and loss, normalized, log2-transformed ratios were used. Based on the variation in autosomal genomic regions, which should not vary between the two reference samples, thresholds for averaged log2 ratio data were set to 0.25 and -0.25 for gains and losses, respectively.
4.6.4 Data Analysis
This is a descriptive study and the data analysis being performed was done majorly to illustrate the size distribution of the CNVs found affecting miRs in CRC patients.
4.6.5 CNVs Validation
the nucleus and is used for the longer length of CNVs. Q-PCR was used for the shorter length of CNVs found. However there were no specific criteria to be used for the selection of validation method technique.
4.6.5.1 Polymerase Chain Reaction (PCR)
Approximately 100 nanogram DNA solution was amplified in a final
volume of 50 µl mix solution containing 5 µl of 10X PCR Buffer, 2 µl MgCl2, 2
µl 10mM dNTP, 2 µl 10mM forward primer, 2 µl 10mM reverse primer, 0,4
AmpliTaq Enzyme, 35 µl milli Q water and 2 µl DNA. Samples were denatured
initially for 5 minutes at 95°C followed by 30 cycles of 95°C for 15 seconds, 64°C for 2 minutes, 72°C for 2 minutes; with a final extension of 5 minutes at 72°C. Five microliters of each sample was then runned on an 1.5% agarose gel with 130V for 30 minutes and stained with ethidium bromide, to confirm PCR amplification product.
4.6.5.2 Quantitative Polymerase Chain Reaction (qPCR)
Applied Biosystems 7900HT Fast Real-Time PCR System. Reaction mix
4.7 ETHICAL CLEARANCE
The study was part of an ongoing main research. The main research was approved by Institutional Review Board of Radboud University Nijmegen Medical Centre, Nijmegen Centre for Molecular Life Sciences, Nijmegen, The Netherlands.
4.8 RESEARCH FLOW
Validation of genetic copy number (e.g. PCR and q-PCR) Identification of genes and
proteins of interest High throughput assay:
Array comparative genomic hybridization Patients DNA
Inclusion criteria of:
- no MLH or MSH deletion(microsatellite stable) - diagnosed at age <40 yrs old or
- diagnosed at age <50 yrs old with at least one 1st degree relative and/or recessive inheritance
pattern CRC